
Kai Yang, Zhanshan Sun, Ruiqi Mao, Yi Lin, Yi Liu, Qiang An, Yunqi Fu, "Wideband Rydberg atom-based receiver for amplitude modulation radio frequency communication," Chin. Opt. Lett. 20, 081203 (2022)
- Chinese Optics Letters
- Vol. 20, Issue 8, 081203 (2022)
Abstract
1. Introduction
Conventional radio frequency (RF) receivers acquire information by sensing electromagnetic waves at wavelengths comparable to their dimensions, so their corresponding bandwidth is limited by their physical size, according to the Chu limit[
However, most studies of atom-based receivers are on the basis of on-resonance transitions of Rydberg states at only a few individual frequencies[
2. Experimental Setup
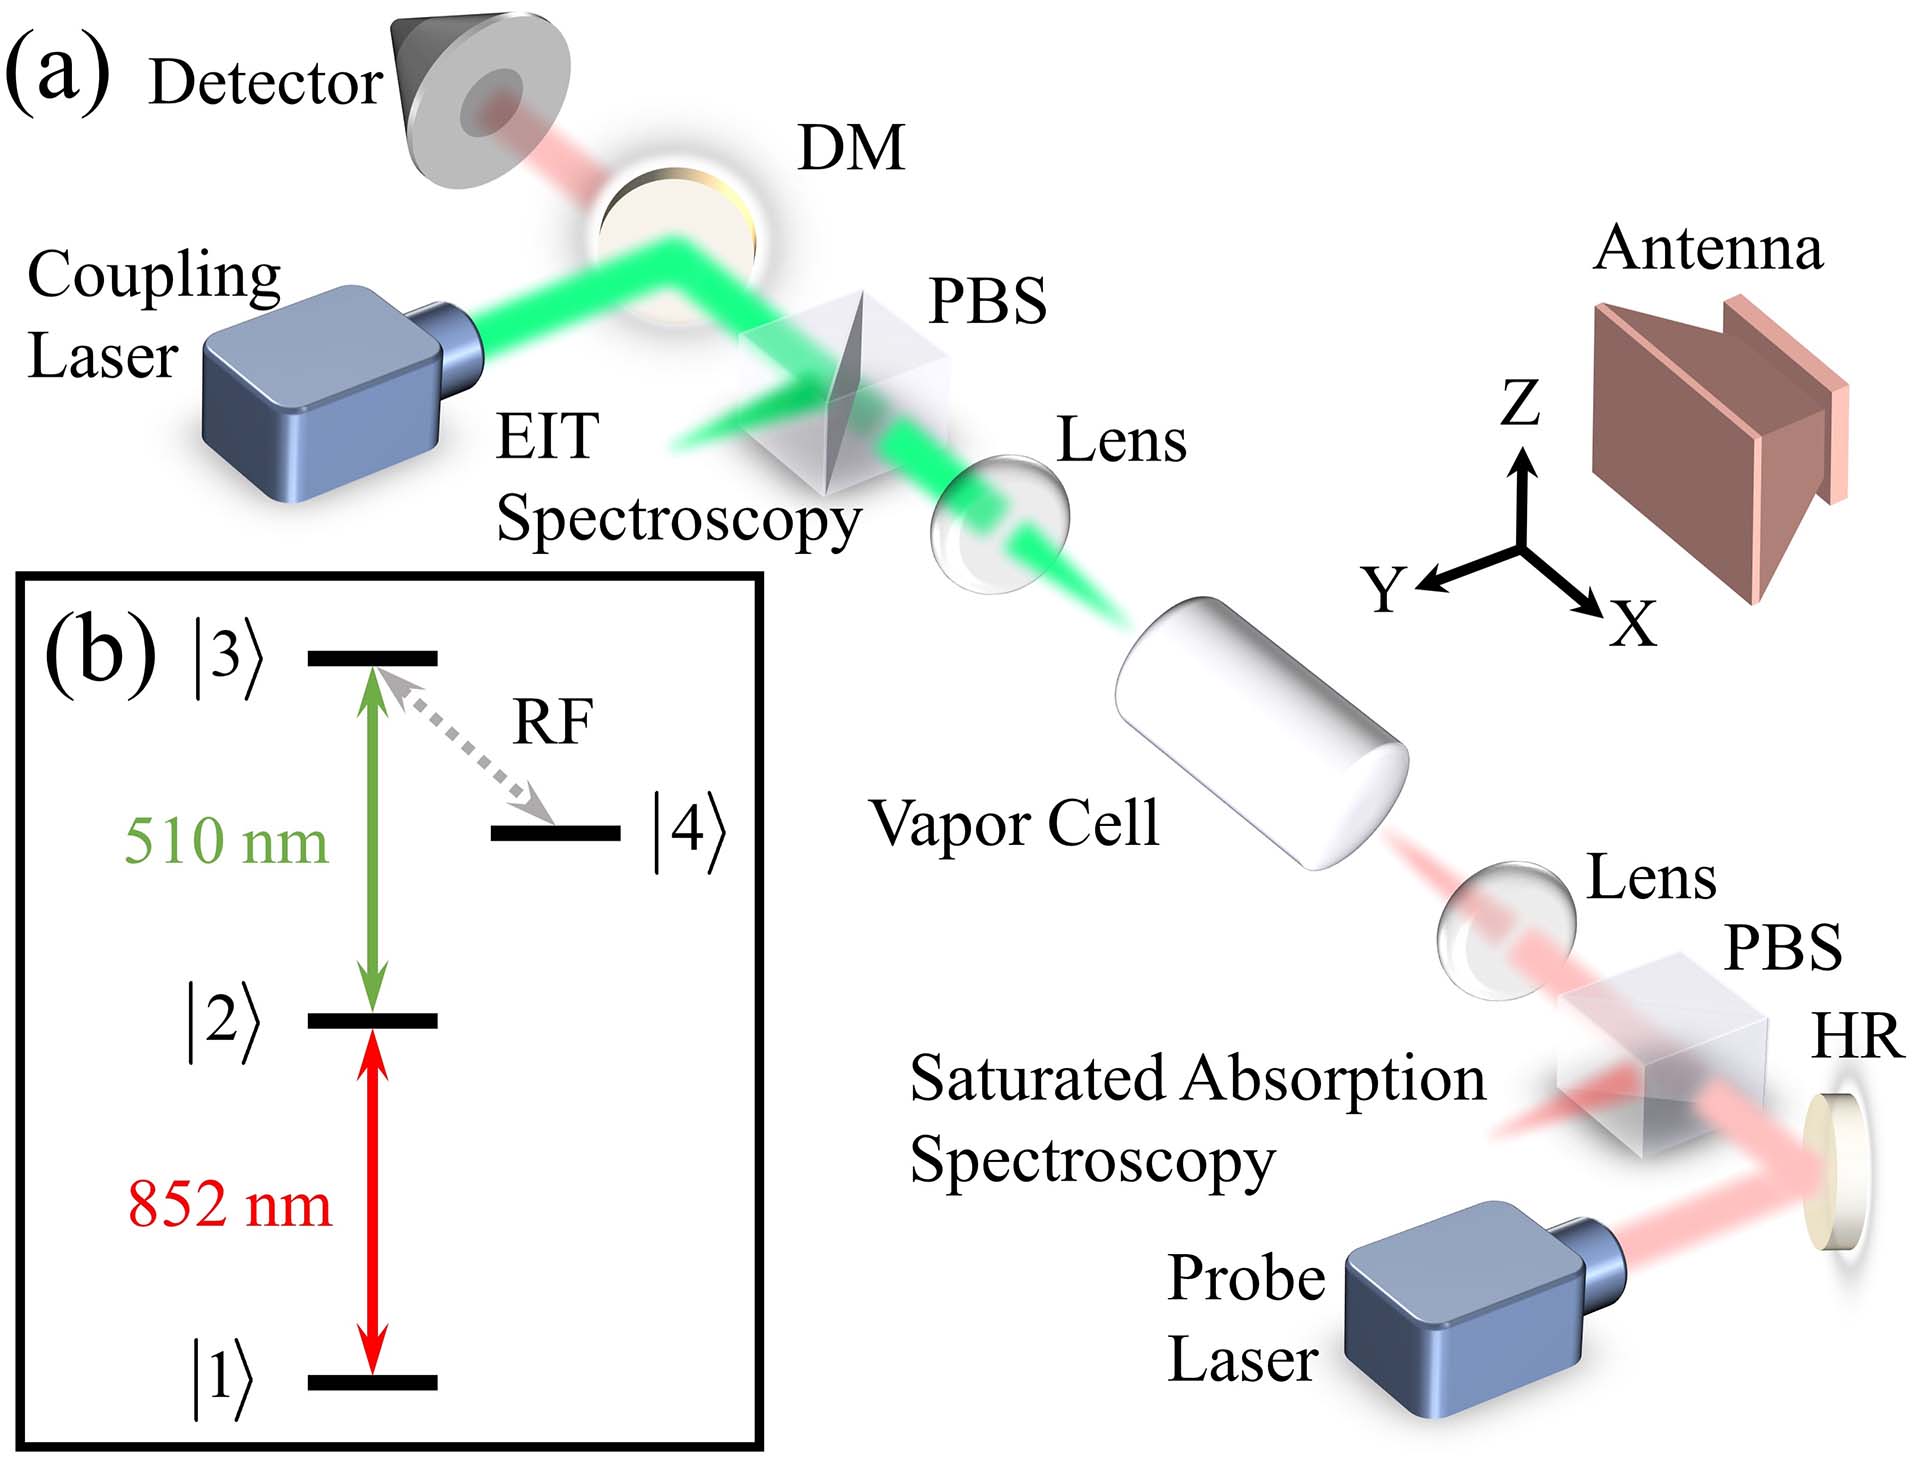
The experimental setup and the Rydberg EIT ladder scheme as well as the resonant two-photon microwave transitions used in the measurements are illustrated in Fig. 1. The cesium (
Sign up for Chinese Optics Letters TOC. Get the latest issue of Chinese Optics Letters delivered right to you!Sign up now
![]()
Figure 1.Illustration of experimental scenarios and energy-level diagram. (a) Diagram of the experimental setup. DM, dichroic mirror; PBS, polarizing beam splitter; HR, dielectric mirror. (b) Energy-level diagram of the Rydberg EIT ladder scheme and resonant two-photon microwave transition.
3. AT Splitting and AC Stark Shift
The Rydberg atom-based RF receivers can detect and measure broadband RF signals by using two related optical phenomena, the Autler–Townes (AT) splitting and the AC Stark shift. When a weak probe laser beam passes through a vapor cell filled with alkali metal gas, the probe laser is typically absorbed by the atoms, which may excite the atoms from the ground state to the intermediate state. Meanwhile, a relatively strong coupling laser causes the atoms to resonate between the intermediate and Rydberg states, inversely reducing the absorption of the probe laser and creating a transparent window of the probe laser, i.e., EIT. As an RF field is irradiated into the vapor cell, the EIT spectrum will be shifted, which is known as the AC Stark shift. In particular, when the frequency of the RF field allows atomic transition from one Rydberg state to another, the EIT spectrum will split into a pair of AT lines.
We calibrate the coupling laser detuning by taking advantage of the hyperfine structure, and typical EIT and AT splitting spectra are shown in Fig. 2(a). When the RF carrier frequency is tuned to 9.94 GHz, it resonates with the Rydberg state
![]()
Figure 2.Illustration of the normalized probe transmission signal as a function of coupling laser detuning. (a) On-resonance EIT spectra with (red curve) and without (black curve) RF field. The RF field frequency is 9.94 GHz. (b) Off-resonance EIT spectra with (red and blue curves) and without (black curve) RF field. The RF field frequencies are 3.4 GHz (red curve) and 15.4 GHz (blue curve).
The overall sign of
4. Experimental Results
For communication system applications, baseband bandwidth and signal-to-noise ratio (SNR) are critical metrics. Based on AT splitting, we characterize the response at different modulation depths for a carrier frequency of 9.94 GHz with an AM frequency of 10 kHz, as shown in Fig. 3. By setting the coupling laser frequency that corresponds to the peak of the EIT spectrum (Fig. 2), the changes of the RF field amplitude can be detected through the relative variations of the probe transmission on the photodetector, so the demodulated time domain signal waveform can be obtained using an oscilloscope, as shown in Fig. 3(a). It is obvious that the sinusoidal demodulated signal is amplified with the increase of the modulation depth from 10% to 60%. Figure 3(b) shows the frequency domain spectrum of the demodulated signal through a spectrum analyzer, determining an accurate 10 kHz AM frequency. The resolution bandwidth (RBW) of the spectrum analyzer was set to 1 Hz and was similarly set in the subsequent experiments.
![]()
Figure 3.Optical response measured at 9.94 GHz carrier frequency with an AM frequency of 10 kHz. AM depths are set to be 10% (black curve), 30% (red curve), and 60% (blue curve), respectively, and the EIRP is 26.3 dBm. (a) Oscilloscope output. (b) Spectrum analyzer output.
According to Eqs. (1) and (2), the spectral variation is directly subjected to EIRP (
Sign up for Chinese Optics Letters TOC. Get the latest issue of Chinese Optics Letters delivered right to you!Sign up now
![]()
Figure 4.Measured SNR of the demodulated signal as a function of the EIRP at the RF carrier frequency of 9.94 GHz with an AM frequency of 10 kHz and a modulation depth of 60%. Inset: typical EIT-AT spectra, when the EIRP is large enough to cause the splitting width to be larger than the EIT linewidth at an RF carrier frequency of 9.94 GHz.
The data capacity, which can be described in bits per second, is also one of the most important characteristics in communication systems. Based on the Shannon–Hartley theorem[
![]()
Figure 5.Illumination of the SNR and data capacity as a function of AM frequency with a modulation depth of 60%. The RF carrier frequencies are 9.94 GHz (black, square) with an EIRP of 26.3 dBm, 3.4 GHz (red, circle) with an EIRP of 26 dBm, and 15.4 GHz (blue, triangle) with an EIRP of 29.8 dBm, respectively. The hollow symbols represent the experimental data of the SNR, and the solid symbols represent the data capacity calculated by Eq. (
To verify the broadband characteristics of our atomic receiver, we measured the SNR and its corresponding EIRP throughout an ultra-wideband ranging from 2 GHz to 18 GHz, which is restricted by the limited operating band of the antenna used in the experiment. The AM frequency is fixed at 10 kHz with the modulation depth of 60%. The measured SNR and its corresponding EIRP are illustrated in Fig. 6. For the overall trend, it is worth noting that the SNR reaches a maximum near the on-resonance region (10 GHz) and decreases in off-resonance regions, which corresponds to the sensitivity of the atoms to the external RF field in different regions. According to Eq. (2), the Rydberg EIT spectrum is governed by the atomic polarizability
![]()
Figure 6.Illumination of the measured SNR (black) and corresponding EIRP (red) as a function of the RF carrier frequency with an AM frequency of 10 kHz and a modulation depth of 60%.
5. Conclusion
This paper demonstrated a Rydberg atom-based RF sensor for proof-of-concept AM communications, operating at an ultra-wideband carrier frequency from 2 GHz to 18 GHz, without changing the laser wavelength or applying other auxiliary RF fields, which makes the quantum receiver more robust and more maintainable in practical applications. The measured bandwidth, which is mainly restricted by the antenna working band and related instruments, can be easily extended to a broader frequency range by optimizing the experimental conditions. Through locking the coupling laser frequency at the peak of the EIT spectrum, the atomic receiver can demodulate the amplitude variation of the scattered RF field based on off-resonance AC Stark shift and on-resonance AT splitting effects. We characterized the SNR and its corresponding data capacity from 2 GHz to 18 GHz, exhibiting the distinguished sensing ability spanning the prime microwave communication bands. The quantum sensor proposed in our study will be a complimentary candidate for future communication domains.
References
[1] L. J. Chu. Physical limitations of omni-directional antennas. J. Appl. Phys., 19, 1163(1948).
[2] J. A. Sedlacek, A. Schwettmann, H. Kübler, R. Löw, T. Pfau, J. P. Shaffer. Microwave electrometry with Rydberg atoms in a vapour cell using bright atomic resonances. Nat. Phys., 8, 819(2012).
[3] C. L. Holloway, J. A. Gordon, S. Jefferts, A. Schwarzkopf, D. A. Anderson, S. A. Miller, N. Thaicharoen, G. Raithel. Broadband Rydberg atom-based electric-field probe: from self-calibrated measurements to sub-wavelength imaging. IEEE Trans. Antenna Propag., 62, 6169(2014).
[4] P. Böhi, M. F. Riedel, T. W. Hänsch, P. Treutlein. Imaging of microwave fields using ultracold atoms. Appl. Phys. Lett., 97, 051101(2010).
[5] P. Böhi, P. Treutlein. Simple microwave field imaging technique using hot atomic vapor cells. Appl. Phys. Lett., 101, 181107(2012).
[6] A. K. Mohapatra, T. R. Jackson, C. S. Adams. Coherent optical detection of highly excited Rydberg states using electromagnetically induced transparency. Phys. Rev. Lett., 98, 113003(2007).
[7] Y. Y. Jau, T. Carter. Vapor-cell-based atomic electrometry for detection frequencies below 1 kHz. Phys. Rev. Appl., 13, 054034(2020).
[8] D. A. Anderson, R. E. Sapiro, G. Raithel. An atomic receiver for AM and FM radio communication. IEEE Trans. Antenna Propag., 69, 2455(2021).
[9] D. A. Anderson, E. Paradis, G. Raithel, R. E. Sapiro, C. L. Holloway. High-resolution antenna near-field imaging and sub-THz measurements with a small atomic vapor-cell sensing element. 11th Global Symposium on Millimeter Waves (GSMM), 1(2018).
[10] M. Y. Jing, Y. Hu, J. Ma, H. Zhang, L. J. Zhang, L. T. Xiao, S. T. Jia. Atomic superheterodyne receiver based on microwave-dressed Rydberg spectroscopy. Nat. Phys., 16, 911(2020).
[11] C. L. Holloway, M. T. Simons, M. D. Kautz, A. H. Haddab, J. A. Gordon, T. P. Crowley. A quantum-based power standard: using Rydberg atoms for a SI-traceable radio-frequency power measurement technique in rectangular waveguides. Appl. Phys. Lett., 113, 094101(2018).
[12] M. T. Simons, J. A. Gordon, C. L. Holloway, D. A. Anderson, S. A. Miller, G. Raithel. Using frequency detuning to improve the sensitivity of electric field measurements via electromagnetically induced transparency and Autler-Townes splitting in Rydberg atoms. Appl. Phys. Lett., 108, 174101(2016).
[13] J. A. Sedlacek, A. Schwettmann, H. Kübler, J. P. Shaffer. Atom-based vector microwave electrometry using rubidium Rydberg atoms in a vapor cell. Phys. Rev. Lett., 111, 063001(2013).
[14] M. T. Simons, A. H. Haddab, J. A. Gordon, C. L. Holloway. A Rydberg atom-based mixer: measuring the phase of a radio frequency wave. Appl. Phys. Lett., 114, 114101(2019).
[15] D. A. Anderson, R. E. Sapiro, L. F. Gonçalves, R. Cardman, G. Raithel. Atom radio-frequency interferometry(2020).
[16] A. K. Robinson, N. Prajapati, D. Senic, M. T. Simons, C. L. Holloway. Determining the angle-of-arrival of a radio-frequency source with a Rydberg atom-based sensor. Appl. Phys. Lett., 118, 114001(2021).
[17] M. T. Simons, J. A. Gordon, C. L. Holloway. Fiber-coupled vapor cell for a portable Rydberg atom-based radio frequency electric field sensor. Appl. Opt., 57, 6456(2018).
[18] R. Cardman, L. F. Gonçalves, R. E. Sapiro, G. Raithel, D. A. Anderson. Atomic 2D electric field imaging of a Yagi–Uda antenna near-field using a portable Rydberg-atom probe and measurement instrument. Adv. Opt. Tech., 9, 305(2020).
[19] C. L. Holloway, M. T. Simons, A. H. Haddab, J. A. Gordon, S. D. Voran. A multiple-band Rydberg atom-based receiver: AM/FM stereo reception. IEEE Antennas Propag. Mag., 63, 63(2021).
[20] D. H. Meyer, Z. A. Castillo, K. C. Cox, P. D. Kunz. Assessment of Rydberg atoms for wideband electric field sensing. J. Phys. B: At. Mol. Opt. Phys., 53, 034001(2020).
[21] D. H. Meyer, P. D. Kunz, K. C. Cox. Waveguide-coupled Rydberg spectrum analyzer from 0 to 20 GHz. Phys. Rev. Appl., 15, 014053(2021).
[22] D. H. Meyer, K. C. Cox, F. K. Fatemi, P. D. Kunz. Digital communication with Rydberg atoms and amplitude-modulated microwave fields. Appl. Phys. Lett., 112, 211108(2018).
[23] K. C. Cox, D. H. Meyer, F. K. Fatemi, P. D. Kunz. Quantum-limited atomic receiver in the electrically small regime. Phys. Rev. Lett., 121, 110502(2018).
[24] J. S. Otto, M. K. Hunter, N. Kjærgaard, A. B. Deb. Data capacity scaling of a distributed Rydberg atomic receiver array. J. Appl. Phys., 129, 154503(2021).
[25] H. Y. Zou, Z. F. Song, H. H. Mu, Z. G. Feng, J. F. Qu, Q. L. Wang. Atomic receiver by utilizing multiple radio-frequency coupling at Rydberg states of rubidium. Appl. Sci., 10, 1346(2020).
[26] C. L. Holloway, M. T. Simons, J. A. Gordon, D. Novotny. Detecting and receiving phase-modulated signals with a Rydberg atom-based receiver. IEEE Antennas Wirel. Propag. Lett., 18, 1853(2019).
[27] M. T. Simons, A. B. Artusio-Glimpse, C. L. Holloway, E. Imhof, S. R. Jefferts, R. Wyllie, B. C. Sawyer, T. G. Walker. Continuous radio-frequency electric-field detection through adjacent Rydberg resonance tuning. Phys. Rev. A, 104, 032824(2021).
[28] Y. Sun, Y. Yao, Y. Q. Hao, H. F. Yu, Y. Y. Jiang, L. S. Ma. Laser stabilizing to ytterbium clock transition with Rabi and Ramsey spectroscopy. Chin. Opt. Lett., 18, 070201(2020).
[29] X. T. Chen, Y. Y. Jiang, B. Li, H. F. Yu, H. F. Jiang, T. Wang, Y. Yao, L. S. Ma. Laser frequency instability of 6 × 10⁻¹⁶ using 10-cm-long cavities on a cubic spacer. Chin. Opt. Lett., 18, 030201(2020).
[30] C. E. Shannon. Communication in the presence of noise. Proc. IRE, 37, 10(1949).


Set citation alerts for the article
Please enter your email address

© Copyright 2018-2021 | Chinese Laser Press. All Rights Reserved 沪ICP备15018463号-20