
Xu Wang, Feng Zhou, Dingshan Gao, Yanxian Wei, Xi Xiao, Shaohua Yu, Jianji Dong, Xinliang Zhang, "Wideband adaptive microwave frequency identification using an integrated silicon photonic scanning filter," Photonics Res. 7, 172 (2019)
- Photonics Research
- Vol. 7, Issue 2, 172 (2019)
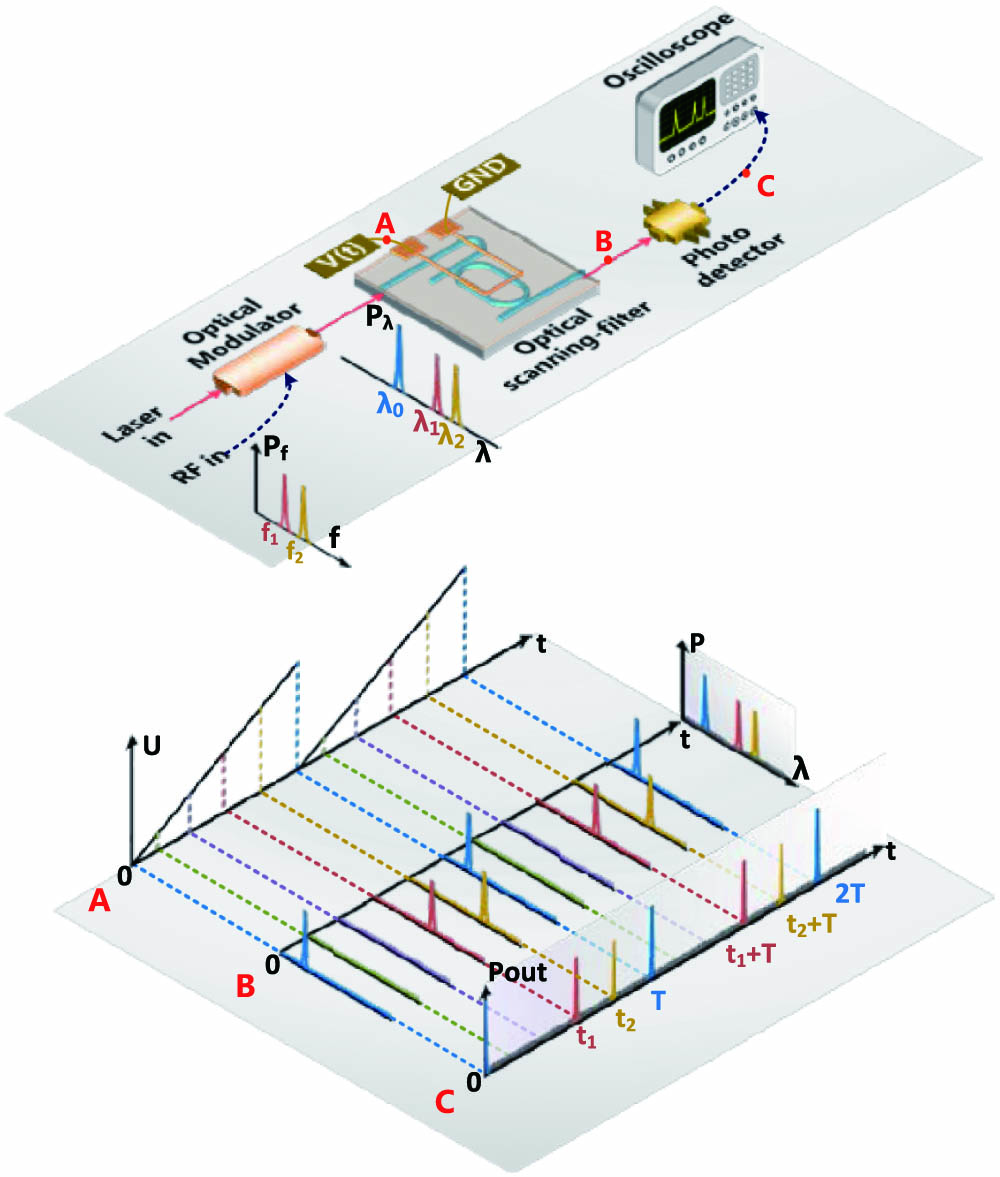
Fig. 1. Conceptual diagram of the wideband adaptive MFIS using an integrated silicon photonic scanning filter.
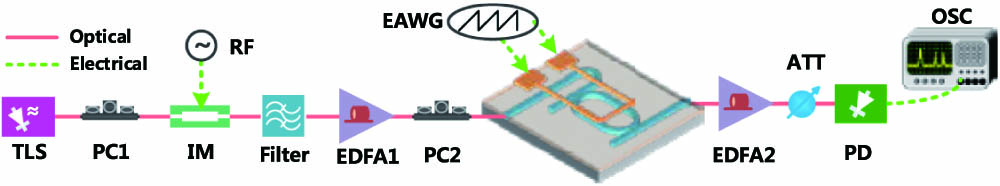
Fig. 2. Experiment setup of the MFIS. TLS, tunable laser source; PC, polarization controller; RF, radio frequency; IM, intensity modulator; EDFA, erbium-doped fiber amplifier; EAWG, electrical arbitrary waveform generator; ATT, attenuator; PD, photodetector; OSC, oscilloscope.
Fig. 3. Characteristics of the integrated silicon photonic scanning filter and measured results of the time-invariant SF signals. (a) Micrograph of the high-Q
Fig. 4. Measurement results of time-invariant MF identification. (a) 2, 10, and 12 GHz. (b) 2–30 GHz, stepped by 2 GHz. (c) 2–20 GHz, stepped by 0.5 GHz. (d) 2 and 2.375 GHz.
Fig. 5. RF response of the IM.
Fig. 6. Theoretical simulation model for FM signal identification. (a) Scanning frequency of the filter. (b) Chirped frequency. (c) Hopping frequency with respect to time in one scanning period.
Fig. 7. Simulated results for FM signal identification. CF at a center frequency of 20 GHz with different spans of (a) 16 GHz and (b) 1 GHz. FH from 2 to 18 GHz stepped by (c) 16 GHz and (d) 0.5 GHz.
Fig. 8. Measurement results of CF microwave signals. The red line is the ESA measured frequency; the blue line is the MFIS measured frequency. (a), (b), and (c) CF at a center frequency of 20 GHz with different spans of 16, 4, and 1 GHz, respectively. (e), (f), and (g) CF of different center frequencies at 4, 16, and 24 GHz, respectively, with the same span of 4 GHz. (d) and (h) are the measured frequency versus the input frequency.
Fig. 9. Measurement results of FH microwave signals from 2 to 18 GHz. (a) Stepped by 16 GHz. (b) Stepped by 4 GHz. (c) Stepped by 1 GHz. (d) Stepped by 0.5 GHz. The red line is the ESA measured frequency; the blue line is the MFIS measured frequency.
Fig. 10. Measurement results of simultaneous multitype microwave signals. (a) Simultaneous FH signal and CF signal. (b) Simultaneous SF signal and CF signal. (c) Simultaneous SF signal and FH signal. The input frequency parameters are labeled in each graph.
Fig. 11. Measured amplitude results of a 20 GHz microwave signal.
|
Table 1. Classification Criterion of Measured Microwave Signals
|
Table 2. Performance Comparison of Existing MFISs, where “S” Denotes Single Frequency Measurement and “M” Denotes Multiple Frequency Measurement


Set citation alerts for the article
Please enter your email address

© Copyright 2018-2021 | Chinese Laser Press. All Rights Reserved 沪ICP备15018463号-20