
Van Nang Lam, Thi Bich Vu, Quang Dat Do, Thi Thanh Xuan Le, Tien Dai Nguyen, T.-Thanh-Bao Nguyen, Hoang Tung Do, Thi Tu Oanh Nguyen. One-step hydrothermal synthesis of Sn-dopedα-Fe2O3 nanoparticles for enhanced photocatalytic degradation of Congo red[J]. Journal of Semiconductors, 2022, 43(12): 122001
- Journal of Semiconductors
- Vol. 43, Issue 12, 122001 (2022)
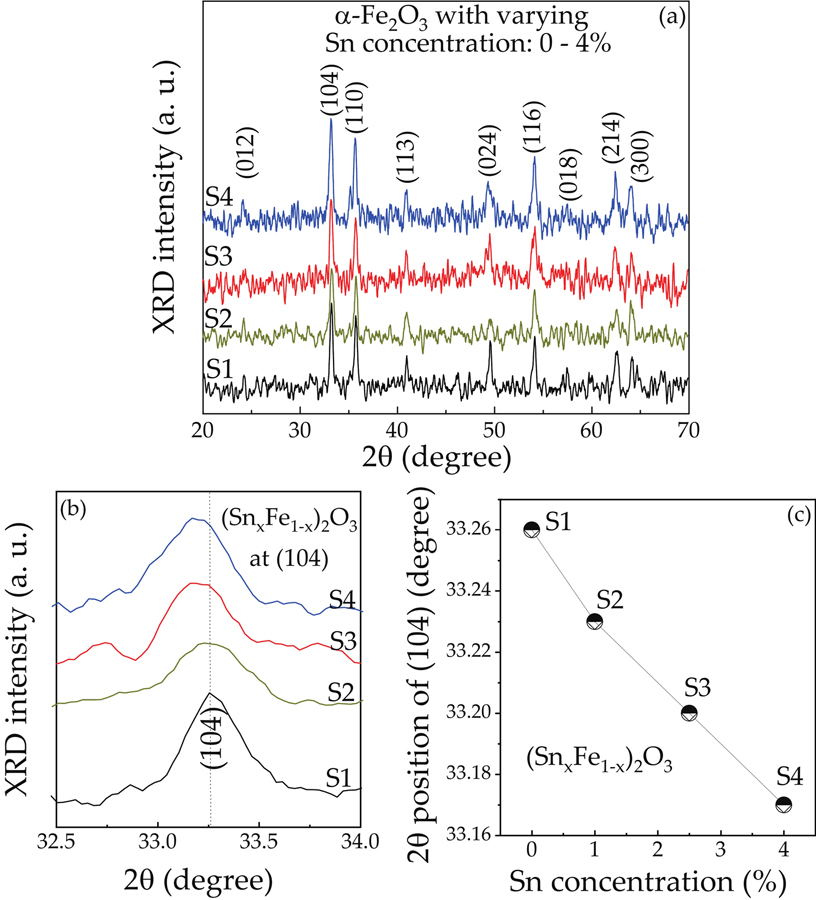
Fig. 1. (Color online) (a) XRD pattern ofα-Fe2O3 NPs samples. (b) Magnification of (104) planevs. Sn concentration. (c) 2θ position of (104) planevs. Sn concentration plot for changing Sn concentration.
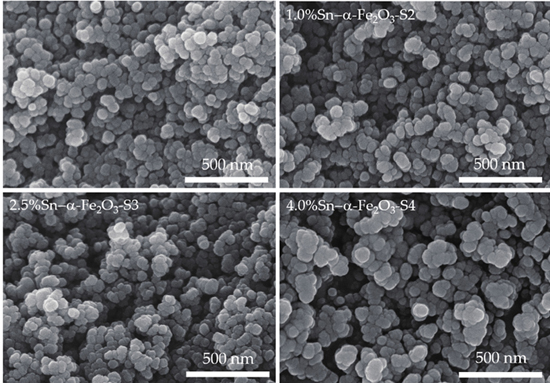
Fig. 2. SEM top–view images ofα-Fe2O3 NPs with varied Sn concentrations as 0% Sn (S1), 1.0% Sn (S2), 2.5% Sn (S3) and 4.0% Sn (S4) samples.
Fig. 3. (Color online) (a) TEM image and average diameter size, (b) EDS spectrum and (c) FTIR spectrum of the pureα-Fe2O3 NPs (S1) and 2.5% Sn-α-Fe2O3 NPs (S3) samples and (d) Raman spectrum of S1–S4 samples.
Fig. 4. (Color online) (a) The absorption spectra ofα-Fe2O3 NPs for varying Sn concentration (0%, 1.0%, 2.5% and 4.0%), and (αhν)2vs. energy plot for calculation of bandgap of different Sn–doping concentrationsα-Fe2O3 NPs for (b) 0% Sn (S1), (c) 1.0% Sn (S2), (d) 2.5% Sn (S3), (e) 4.0% Sn (S4) samples, respectively.
Fig. 5. (Color online) UV–Vis absorption spectra of Congo red during different stage (at 15, and 30 min interval) of photocatalytic reaction ofα-Fe2O3 NPs with varied Sn doping concentration as (a) 0% Sn (S1), (b) 1.0% Sn (S2), (c) 2.5% Sn (S3) and (d) 4.0% Sn (S4) samples.
Fig. 6. (Color online) (a) Effect of Sn-α-Fe2O3 NPs catalyst dosage on photodegradation efficiency of CR dye solution. (b) Plot of ln (Co/C) as a function of irradiation time for photocatalysis of Congo red solution containing:α-Fe2O3 and Sn-dopedα-Fe2O3 NPs.
| |||||||||||||||||||||||||||||||||||||||||||||||
Table 0. The parameters of Sn doped toα-Fe2O3 nanoparticles and their degradation characteristics.
|
Table 0. Compression of photocatalyst characteristics ofα-Fe2O3 and other materials to varying organic dyes.

Set citation alerts for the article
Please enter your email address
© Copyright 2018-2021 | Chinese Laser Press. All Rights Reserved 沪ICP备15018463号-20