Van Nang Lam1、*, Thi Bich Vu2、3, Quang Dat Do1, Thi Thanh Xuan Le1, Tien Dai Nguyen2、3、**, T.-Thanh-Bao Nguyen4, Hoang Tung Do4, and Thi Tu Oanh Nguyen5
Van Nang Lam, Thi Bich Vu, Quang Dat Do, Thi Thanh Xuan Le, Tien Dai Nguyen, T.-Thanh-Bao Nguyen, Hoang Tung Do, Thi Tu Oanh Nguyen. One-step hydrothermal synthesis of Sn-dopedα-Fe2O3 nanoparticles for enhanced photocatalytic degradation of Congo red[J]. Journal of Semiconductors, 2022, 43(12): 122001
Copy Citation Text
We report on the synthesis of Sn-doped hematite nanoparticles (Sn-α-Fe2O3 NPs) by the hydrothermal method. The prepared Sn-α-Fe2O3 NPs had a highly pure and well crystalline rhombohedral phase with an average particle size of 41.4 nm. The optical properties of as-synthesizedα-Fe2O3 NPs show a higher bandgap energy (2.40–2.57 eV) than that of pure bulkα-Fe2O3 (2.1 eV). By doping Sn intoα-Fe2O3 NPs, the Sn-doped hematite was observed a redshift toward a long wavelength with increasing Sn concentration from 0% to 4.0%. The photocatalytic activity of Sn-dopedα-Fe2O3 NPs was evaluated by Congo red (CR) dye degradation. The degradation efficiency of CR dye using Sn-α-Fe2O3 NPs catalyst is higher than that of pureα-Fe2O3 NPs. The highest degradation efficiency of CR dye was 97.8% using 2.5% Sn-dopedα-Fe2O3 NPs catalyst under visible-light irradiation. These results suggest that the synthesized Sn-dopedα-Fe2O3 nanoparticles might be a suitable approach to develop a photocatalytic degradation of toxic inorganic dye in wastewater.We report on the synthesis of Sn-doped hematite nanoparticles (Sn-α-Fe2O3 NPs) by the hydrothermal method. The prepared Sn-α-Fe2O3 NPs had a highly pure and well crystalline rhombohedral phase with an average particle size of 41.4 nm. The optical properties of as-synthesizedα-Fe2O3 NPs show a higher bandgap energy (2.40–2.57 eV) than that of pure bulkα-Fe2O3 (2.1 eV). By doping Sn intoα-Fe2O3 NPs, the Sn-doped hematite was observed a redshift toward a long wavelength with increasing Sn concentration from 0% to 4.0%. The photocatalytic activity of Sn-dopedα-Fe2O3 NPs was evaluated by Congo red (CR) dye degradation. The degradation efficiency of CR dye using Sn-α-Fe2O3 NPs catalyst is higher than that of pureα-Fe2O3 NPs. The highest degradation efficiency of CR dye was 97.8% using 2.5% Sn-dopedα-Fe2O3 NPs catalyst under visible-light irradiation. These results suggest that the synthesized Sn-dopedα-Fe2O3 nanoparticles might be a suitable approach to develop a photocatalytic degradation of toxic inorganic dye in wastewater.
Introduction
Congo red (CR) dye (1–Naphthalenesulfonic acid, 3,3'–((1,1'–biphenyl)–4,4'–diylbis-(azo))bis(4–amino–, disodium salt)) with formula as C32H22N6Na2O6S2, is a typical benzidine-based anionic diazo dye[1-3]. The CR dye belongs to industrial effluent groups, which have been widely used in textile dye and other chemical engineering industries. In wastewater, this anionic diazo dye dissolves and ionizes out an anion of sulfonate group (CR–SO3−) and sodium ion (Na+). Due to their carcinogenic activity, the CR dye has fallen into disuse, as have all benzidine-derived dyes. However, the CR dye has still been widely used for histology and microscopy applications, such as the outer membrane of Gram-negative bacteria, and staining in amyloidosis and the cell walls of plants and fungi issues. Therefore, the untreated discharge of the above CR dye, containing toxic organic groups, directly into water bodies is the leading cause of pollutant and carcinogenic factors for human health, animals. Several approaches have aimed to remove toxic CR dye in wastewater, including absorption[3,4], biodegradation[5], photodegradation[6-8] and membrane separation[9]. Among them, the photodegradation method using metal oxides is useful for degrading CR dye into environmentally friendly products. Electron–hole pairs of metal oxides, composites, and cellulose photogenerated under light irradiation react to water molecules to form hydroxyl radical (OH•). The OH• reacts to CR dye molecules to degrade them into nontoxic products[1,2,4,10]. However, the OH• density-dependent photodegradation efficiency is based on photogeneration process of electron–hole pairs in visible light region as well as the absorption of dye molecules on the surface area of metal oxide particles. To improve photodegradation efficiency, we need to improve electrical conductivity; to reduce dimensional size, energy bandgap and carrier recombination process; and to increase the lifetime of carriers of metal oxides nanoparticles.
Visible light-driven photocatalytic degradation of organic dyes in waste waters using inorganic semiconductors has been considered as one of the most promising approaches to solving environmental pollution problems[1,6,10-21]. It is well known that photogenerated carriers of semiconductors react with a water molecule to form hydroxyl radical for oxidation of the organic dyes. Significantly, metal oxide semiconductors have been demonstrated in photocatalytic application due to their potential characteristics, including high degradation efficiency, environment friendly, thermal stability, abundance, environment friendly, recyclable visible-light photocatalysis and low-cost products[1,7,13,22-27]. Among them, hematite (α-Fe2O3) has been investigated extensively because they possess many attractive features, such as ease in handling, chemical stability, nontoxicity, an environment-friendly product, high resistance to corrosion features and the most stable iron oxide under ambient conditions[1,7,12,13,24,28-30]. Theα-Fe2O3 can absorb visible light since it has a narrow bandgap (Eg ≈ 2.1 eV) compared to TiO2, ZnO, WO3 materials[14,16,19,31,32]. It has shown interesting morphology-dependent optical and electrical properties for desired applications. These characteristics make it attractive for photocatalytic degradation of organic dyes under visible light irradiation. However,α-Fe2O3 has some disadvantages for photocatalytic application such as rapid recombination rates of charge carriers, short hole diffusion length, short carrier lifetime and poor light absorption near the band edge and oxygen evolution reaction kinetics[13,15,33-36]. Therefore, the development of different nanostructures and the modification of their structure via elemental doping (as Si, Ti, Al, Mg, Cu, Zn, Mo, Cr, Se, and Sn) are effective approaches to overcome these limitations and enhance photocatalyst efficiency[7,13,15,20,23,29,34,37-39]. Significantly, Sn-doped hematite (Sn-α-Fe2O3) nanostructures for photocatalytic applications have shown enhanced photocatalytic activity[15,25]. Because the difference of ionic radius of Sn (158 pm) and Fe (126 pm) is not too large, Sn-doped hematite is an electron donor, which has reduced bandgap energy and increased the carrier density compared toα-Fe2O3 structure due to the substitution of Sn+4 for Fe+3. Sn-α-Fe2O3 nanostructure also has a higher surface area and improved electrical properties, which generates more hydroxyl radical (OH•) for enhancing photocatalyst properties. Thus, many approaches have been reported to successfully synthesizeα-Fe2O3, including co-precipitation[37] electrodeposition technique[24,40], solution combustion synthesis[25] hydrothermal[15,41,42], sol–gel[28], and solvothermal[43-45]. Herein, the hydrothermal synthesis has great advantages in synthesizing metal oxide crystals through low reaction temperature, low-cost production with high-quality crystals and simple equipment. Especially, this method may synthesis a larger amount of materials in semi-industry sections with different structures, a large area and complex (polymer, inorganic) substrates[42].
Recently, Popovet al.[46] reported photocatalytic activity of Sn-dopedα-Fe2O3 which synthesized by hydrothermal method with a high doping concentration (5%–15% of Sn). Their study showed that Sn-dopedα-Fe2O3 NPs containing a high Sn molar lead to a decreased photocatalytic activity by reduced surface area, as well as increased defect sites which resulted in a higher concentration of traps in defect sites and grain boundaries suitable for the recombination of the photogenerated charge carriers.
In this study, we report a facile one-step hydrothermal approach for the synthesis of Sn-doped hematite nanoparticles (Sn-α-Fe2O3 NPs) with dilute concentrations (from 0%–4.0% of Sn). The dopant concentration effect of hematite nanoparticles on the structural and optical properties has been examined. The photocatalytic activity of the samples was investigated through the degradation of CR under visible light irradiation. Furthermore, we suggest the potential application of Sn-α-Fe2O3 nanoparticles with high photodegradation efficiency in visible-light photocatalysis towards organic contaminants.
Experimental
Preparation of Sn-dopedα-Fe2O3 nanoparticles
All of the reagents were of analytical grade and used without further purification. In a typical experiment, Fe(NO3)3·9H2O (4.5 mM), (NH2)2CO (0.6 mM) and C6H12O6 (4.0 mM) were dissolved in 80 mL of deionized water (DI) under magnetic stirring for 15 min to form a brown solution. SnCl2·2H2O was dissolved completely in a minimal amount of distilled water, and then added to the above solution with different Sn concentrations of 0%, 1.0%, 2.5% and 4.0%. Magnetic stirring was maintained for a further 15 min at ambient temperature. After that, the mixture was transferred into the 100 mL Teflon-lined autoclave, which was heated and maintained at 180°C for 10 h. After the reaction, the autoclave was cooled to room temperature naturally. The resulting precipitates were collected by centrifugation then washed several times with deionized water and ethanol. Finally, the products were obtained by dried at 60 °C for 24 h in an oven. The samples fabricated with different molar ratios of Sn and Fe, including 0%, 1.0%, 2.5% and 4.0% were named as 0% Sn-α-Fe2O3 (pureα-Fe2O3), 1.0% Sn-α-Fe2O3, 2.5% Sn-α-Fe2O3 and 4.0% Sn-α-Fe2O3, respectively, as shown inTable 1.
Sample
Sn concentration(%)
Averagecrystallitesize (nm)
BETsurface area (m2/g)
Eg(eV)
Unit cell parameter (Å)
Congo red (mg/L)
Degradation efficiency (%)
a
c
Sn-α-Fe2O3−S1
0.0
20.35
26.4656
2.57
5.0237
13.6904
10
84.6
Sn-α-Fe2O3−S2
1.0
19.82
27.0181
2.48
5.0271
13.7046
10
69.2
Sn-α-Fe2O3−S3
2.5
15.89
31.1234
2.46
5.0237
13.7346
10
97.8
Sn-α-Fe2O3−S4
4.0
21.74
25.9516
2.40
5.0351
13.7411
10
81.8
Table 0. The parameters of Sn doped toα-Fe2O3 nanoparticles and their degradation characteristics.
Powder X-ray diffraction (XRD) analysis of the sample was carried out on a diffractometer (D8 advanced, Bruker AXS, Germany) with λCu_Kα = 1.54 Å at a scanning rate of 0.2o s–1 in the 2θ range from 20o–70o. The morphology of the samples was observed with a field emission scanning electron microscopy (FE–SEM, S–4800, Hitachi, Japan), equipped with energy-dispersive X-ray spectroscopy (EDS, Horiba). The optical properties of samples were investigated by UV–Vis absorbance spectrum on a spectrophotometer (UV-730, Jasco, Japan). The particle sizes and surface area of the samples were characterized by the transmission electron microscopy (TEM, JEM 1010, JEOL) and Brunauer, Emmett and Teller (BET, Micromeritics, TriStar II 3030, version 3.02) techniques.
Photocatalytic experiments
The photocatalytic activity of the synthesized materials was measured by degradation of CR dye. The photocatalytic experiments were carried out in a beaker containing 100 mL aqueous solution of CR dye (10 mg/L) and 30 mg catalyst under constant stirring. The light source was a compact fluorescent lamp (105 W, 6500 K), which was placed vertically above the beaker at a distance of 15 cm. Before irradiation, the suspensions were magnetically stirred in the dark for over 30 min to ensure the adsorption equilibrium of Congo red with the photocatalyst. At specific time intervals, about 7 mL of the aliquot solution was withdrawn from the solution mixture and centrifuged to remove the catalyst particles and then analyzed by spectrophotometer (UV-730, Jasco). The concentration of CR dye in each aqueous solution was measured at maximum absorbance of CR dye (at λmax = 500 nm). The degradation ratio was defined asC/Co, whereCo represents the concentration at the adsorption–desorption equilibrium of the photocatalyst before illumination andCo is the original concentration of CR andC is the concentration of CR at timet. The photocatalytic degradation efficiency (in %) was estimated by below Eq. (1)[3,6].
Results and discussion
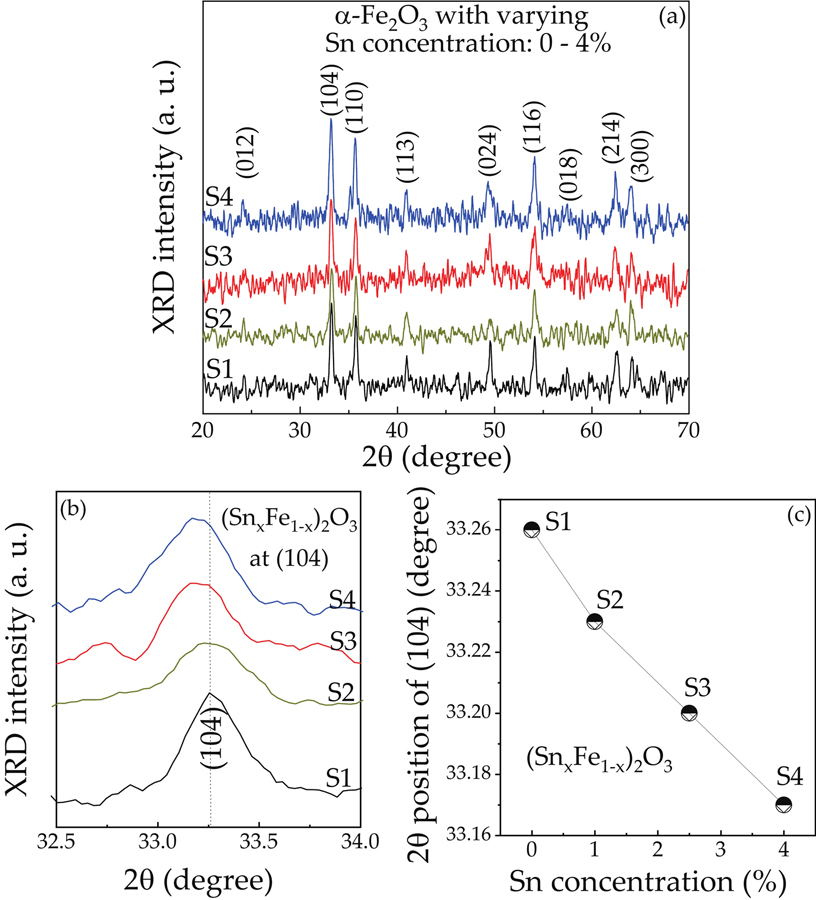
Fig. 1 shows XRD patterns of the samples with varying Sn contents, indicating the crystallinity of theα-Fe2O3 phase. The XRD peaks at 2θ = 24.16°, 33.17°, 35.64°, 40.9°, 49.48°, 54.09°, 57.45°, 62.43°, and 63.96° correspond to the atomic planes of (012), (104), (110), (113), (024), (116), (018), (214) and (030), respectively, of the rhombohedral phase ofα-Fe2O3 matching well to JCPDS cardNo 033–0664. There are non-other impurity peaks, which demonstrated that the synthesized materials exhibit high phase purity. As seen in the Sn-α-Fe2O3 samples, a non-other crystalline phase corresponding to tin oxide was observed, indicating that the Sn could be incorporated into the lattice ofα-Fe2O3 and the substitution of Sn did not affect the rhombohedral structure of iron oxide. However, the atomic plane of (104) position showed a shift towards a lower diffraction angle, while increasing Sn concentration, as shown inFigs. 1(b) and1(c). Noted that it looks like a compressive strain phenomenon to single crystal growth. Evidently, the ionic radius of Sn4+ (0.69 Å) is larger than that of Fe3+ (0.65 Å). Thus, the incorporation of Sn ions led to the larger lattice constant ofα-Fe2O3, resulting in lattice deformation due to the difference between the ionic radius of Sn and Fe. The average crystallite sizes of pureα-Fe2O3 and Sn-dopedα-Fe2O3 are calculated based on the (104) diffraction peak using Debye–Scherrer’s below Eq. (2)
Figure 1.(Color online) (a) XRD pattern ofα-Fe2O3 NPs samples. (b) Magnification of (104) planevs. Sn concentration. (c) 2θ position of (104) planevs. Sn concentration plot for changing Sn concentration.
whereD is the crystallite size (diameter),λ is the wavelength of X-ray (1.5406 Å), β is the value of full width of half-maximum (FWHM), which is expressed in radians, andθ is the Bragg’s angle. The average crystallite sizes are estimated as 20.35, 19.82, 15.89 and 21.74 nm for the S1, S2, S3 and S4 samples, respectively.Fig. 2 shows surface morphologies of the pureα-Fe2O3 NPs and Sn dopedα-Fe2O3 NPs, which are uniform and homogeneously distributed. The as-synthesizedα-Fe2O3 samples exhibit nanoparticles like spherical structures. The average diameter of spheres is around 20–70 nm, as shown in TEM image inFig. 3(a). The average particle size is found to be 41.4 nm using image of the J software package to estimate, as shown in insertedFig. 3(a). The elemental compositions of the Sn-dopedα-Fe2O3 NPs were analyzed through the energy dispersive X–ray spectroscopy (EDS) technique. As shown inFig. 3(b), the EDS spectrum of 2.5% Sn-α-Fe2O3 (sample S3) shows that iron, oxygen, and tin make up 56.2%, 38.51%, and 1.73% in weight, respectively. The weight ratio of Fe to O is approximately 2 : 3. There is a variation of a small amount of O element, which comes from both the sample and absorbed oxygen in air. Besides that, the EDS indicates 3.57% in weight of carbon element, which comes from the residue of the synthesis process of theα-Fe2O3 compound and carbon tape of the holder to mount EDS sample. The carbon element will affect the carrier mobility and crystalline of theα-Fe2O3 compound. To reduce the residual carbon, and oxygen, the sample needs to be pre-treated (degassing at high temperature, storage at high vacuum), pure water (~18 MΩ) and using another tape without any carbon material.
Figure 2.SEM top–view images ofα-Fe2O3 NPs with varied Sn concentrations as 0% Sn (S1), 1.0% Sn (S2), 2.5% Sn (S3) and 4.0% Sn (S4) samples.
Figure 3.(Color online) (a) TEM image and average diameter size, (b) EDS spectrum and (c) FTIR spectrum of the pureα-Fe2O3 NPs (S1) and 2.5% Sn-α-Fe2O3 NPs (S3) samples and (d) Raman spectrum of S1–S4 samples.
We confirm that the organic groups could play a key role in the formation of the crystalline hematite nanoparticles.Fig. 3(c) shows the FTIR spectra ofα-Fe2O3 (S1) and Sn-dopedα-Fe2O3 (S3) samples in the range from 350–4000 cm–1. The spectrum is strong absorption bands at 1092, 1387 and 1637 cm–1 forνs(C–O),δs(C–H), νas(COO), respectively[22,47,48]. One weak band at 2930 cm–1 is considered to come from asymmetric methylene (–CH3) stretching mode[48]. The existence of these peaks are characteristics of organic groups during synthesizedα-Fe2O3 NPs, indicating the absence of residual groups. Significantly, the other strong absorption band between (542–522 cm–1 and 484–434 cm–1) is attributed to stretching vibration ofνs (Fe–O) bond[43,44]. The effect of Sn onα-Fe2O3 shows the light shifting absorption Fe–O bands to low frequency region. However, the strong absorption bands in the range of 400–650 cm–1 are still from the inherent lattice vibration ofα-Fe2O3 material.
Fig. 3(d) presents the Raman spectra for both the undoped and Sn-dopedα-Fe2O3 NPs, which confirm the Fe–O bonds in symmetric and asymmetric direction, bending of Fe–O–Fe bond paths, bending of stretching movement of FeO6 units, as well as Sn-doped hematite NPs, respectively. For hematite crystal, Raman active modes are indicated phonon vibrational modes at the first Brillouin zone center as in Eq. (3)
whereA1u modes are acoustic,A2u modes are optically silent, symmetricalA1g andEg modes are Raman active, and the antisymmetricEu mode is infrared active. The result shows two peaks at 219.3 and 513.4 cm–1 corresponding toA1g modes, while three peaks at 282.2, 414.5, and 609.2 cm–1 were assigned toEg modes in crystal hematite[49-53]. One of the longitudinal optical lines located at 656.6 cm–1 (Eu) was infrared active due to the resonance enhancement mechanism[53]. As can be seen, the relative intensity of 609.2 and 656.6 cm–1 peak with Sn-doped increased while Sn concentration increased.
The increase in intensity of these peaks was attributed to Fe3+ substituted by Sn4+ in hematite. Because of the incorporation of Sn4+ dopants of high atomic weight concentration, the symmetry of hematite lattice can break or phase was in disorder. Meanwhile, using intensity ratio (609 cm–1/656 cm–1) with various Sn concentration (0–4%) also indicates the Sn-doping in hematite structure.
Fig. 4 shows the absorption property of the as-synthesizedα-Fe2O3 NPs with varying Sn concentrations at room temperature. The bandgap of hematite can be calculated via the Tauc’s plot (
vs. band energy), using the Kubellka–Munk model, and following by Eq. (4):
Figure 4.(Color online) (a) The absorption spectra ofα-Fe2O3 NPs for varying Sn concentration (0%, 1.0%, 2.5% and 4.0%), and (αhν)2vs. energy plot for calculation of bandgap of different Sn–doping concentrationsα-Fe2O3 NPs for (b) 0% Sn (S1), (c) 1.0% Sn (S2), (d) 2.5% Sn (S3), (e) 4.0% Sn (S4) samples, respectively.
whereC,α,Eg andhν are proportional constant, absorption coefficient, bandgap and photon energy, respectively. The bandgap can be obtained by extrapolating the linear portion of the plot of (αhν)2vs.hν toα = 0. The value ofEg forα-Fe2O3 compounds are evaluated as 2.57, 2.48, 2.46 eV and 2.40 eV for S1, S2, S3 and S4 samples, respectively, which is larger than that of bulkα-Fe2O3 (1.9 to 2.2 eV), as shown inFigs. 4(b)–4(e). These values are an argument to previous reports on hematite nanostructures[10,12,23,25,29,31]. The larger bandgap energy of theα-Fe2O3 NPs was attributed to the decreasing particle size due to the confinement quantum effect of a low dimensional system[28,41]. The absorption spectrum of all of the samples indicated the direct transition bandgaps. The Sn-concentration dependent absorption edge of as-preparedα-Fe2O3 NPs exhibited a slight redshift toward the long wavelength, which is in an agreement with the photocatalytic activity ofα-Fe2O3 under light illumination. This phenomenon was attributed to the effect of modified energy level of electron density of states (EDS) on the bottom of the conduction band leading to lower energy level of EDS, which exhibits a shifting absorption edge to a long wavelength.
The photocatalytic activity of the as-preparedα-Fe2O3 NPs was examined by the photodegradation of the CR dye in an aqueous solution (10 mg/L).Fig. 5 displays the adsorption spectra of the CR dye aqueous solution with 0.03 mg of catalyst (hematite nanoparticles) under visible light irradiation. The absorption spectrum of CR dye exhibits two peaks at 500 and 344 nm for azo bonds and benzene and naphthalene rings, respectively[1].
Figure 5.(Color online) UV–Vis absorption spectra of Congo red during different stage (at 15, and 30 min interval) of photocatalytic reaction ofα-Fe2O3 NPs with varied Sn doping concentration as (a) 0% Sn (S1), (b) 1.0% Sn (S2), (c) 2.5% Sn (S3) and (d) 4.0% Sn (S4) samples.
From S1 to S4 sample, the absorption intensity of the CR dye at 500 nm was rapidly decreased, while the irradiation time increased, as shown inFigs. 5(a)–5(d). At 500 nm, the absorption intensity reduced from 0.403 (att = 0 min) to 0.022 (att = 120 min) under light illumination. The degradations of CR dye byα-Fe2O3 NPs were 72.9%, 69.2%, 97.8%, and 82.9% at120 min of irradiation time for S1, S2, S3, and S4 as a catalyst, respectively. This peak disappeared almost completely after 120 min of irradiation. This result confirms that the degradation of CR dye improves with an increase in the visible light exposure time under the presence ofα-Fe2O3 NPs (catalyst). As can be seen, the CR dye was decomposed almost completely in the presence of 2.5% Sn-α-Fe2O3 NPs (S3 sample) catalyst compared to other catalysts after 120 min light exposure time. This phenomenon was attributed to the increase in the number of active sites on the surface ofα-Fe2O3 NPs. Evidently, the catalyst with a high surface area enhances the possibility of interaction of the active sites ofα-Fe2O3 NPs with the dye molecules, leading to improved degradation efficiency[29]. Also, the semiconductor with a higher bandgap (Eg = 2.4–2.6 eV) might keep the separation of electrons and holes for longer time under absorbing light, therefore reducing the probability of their recombination[54].
Fig. 6(a) shows the investigated photocatalytic performance of the Sn-α-Fe2O3 NPs catalysts via the CR dye, using a calibration curve of the CR dye (absorbance vs. concentration) to determine the concentration of unknown samples. To gain quantitative insight into the reaction kinetics of CR degradation, a first-order model was applied to fit the experimental data ofFig. 6(a) and the fitted plots of all the samples, namely the plot of the irradiation time (t) against ln(Co/C), have shown a shape of a straight line. Accordingly, the reaction constantk values can help evaluate the degradation rates as well as degradation efficiency of CR dye, as seen inFig. 6(b). This result indicates the highest performance during the degradation of CR of the S3 sample with ak value of 0.02831 min−1, which is 2.6-fold higher than that of the S1 sample (0.01107 min−1). Therefore, the presence of Sn in the synthesizedα-Fe2O3 NPs sample can be confirmed to enhance performance in photocatalytic degradation over CR. There is no degradation of CR dye after 90 min irradiation without the photocatalyst in the CR dye solution, indicating the CR dye has long–term stability. Note that the CR dye cannot be easily degraded by light irradiation. In contrast, when theα-Fe2O3 NPs photocatalysts were added to the CR dye solution, the degradation of the CR dye could be accelerated obviously. At low Sn concentration, the degradation efficiency of S2 sample was not much different from that of S1 sample (pureα-Fe2O3 NPs) since there is no effect of Sn on carrier mobility and conductivity of hematite. It was clearly observed that with increasing the amount of Sn-doped toα-Fe2O3 NPs, the degradation efficiency of CR dye also increased. The degradation efficiency of the CR dye reached 82.9%–97.8% after 120 min of irradiation, suggesting thatα-Fe2O3 NPs are effective and promising photocatalysts in visible-light. Especially, Sn-α-Fe2O3 NPs catalyst (with 2.5% of concentration, S3) showed the highest degradation efficiency of 97.8% compared to other variants due to more effectively active sites. The Sn-α-Fe2O3 NPs based CR dye degradation efficiency was 5–8 times higher than that of other reports[3,6,55] under radiation. This result confirms that significantly enhanced degradation efficiency of CR dye at the same illumination time, while the amount of catalyst as well as structure of theα-Fe2O3 are equal, as shown inTable 2. The highest photocatalytic degradation rate for the S3 catalyst sample was probably ascribed to the fact that the S3 sample had the lowest absorption intensity at 344 nm in the near infrared region inFig. 5(c), and crystallite size of 15.89 nm is suitable to enhance absorption ability of CR dye molecules on the surface for photocatalytic degradation compared to other crystallite sizes. Meanwhile, the 2.5% Sn-α-Fe2O3 NPs sample was considered as the optimal amount of Sn-doped into the lattice ofα-Fe2O3 NPs catalyst, enhancing the ability to absorb light in the visible-light region and reducing the recombination process of electron–hole pairs[15,56,57]. This result can be attributed to the incorporation of Sn4+ at Fe3+ sites ofα-Fe2O3 NPs, causing ann-fold enhancement in the optical absorption coefficient of hematite due to the energy level below the conduction band and reduced energy bandgap (from 2.57 to 2.40 eV) of hematite[25,46,56-60]. The reduced charge carrier trapping and recombination rate of e–/h+ pairs, as well as improved carrier transfer rate inα-Fe2O3 NPs resulted in a longer lifetime of photogenerated electrons from hematite[61], thus enhancing degradation efficiency of CR dye using Sn-α-Fe2O3 NPs catalyst.
Figure 6.(Color online) (a) Effect of Sn-α-Fe2O3 NPs catalyst dosage on photodegradation efficiency of CR dye solution. (b) Plot of ln (Co/C) as a function of irradiation time for photocatalysis of Congo red solution containing:α-Fe2O3 and Sn-dopedα-Fe2O3 NPs.
The Sn-doped hematite structures have shown the improvement in the electrical conductivity via a polaron hopping mechanism[15,62,63]. When dopant Sn concentration was high, the Sn-doped hematite NPs’ conductivity reduced and its recombination rate of e–/h+ pairs increased due to the high defect density and the presence of disorder phase (possible presence of FeO)[50], forming trapping sites to charge carrier[52,58,60,64]. This leads to decrease in photodegradation efficiency of CR dye using high concentration of Sn dopant (S4 catalyst) compared to S3 sample. The Sn-dopedα-Fe2O3 NPs generates higher concentration of hydroxyl radical (OH•) and O2•– at the surface of hematite nanoparticles[12], and then CR dye is oxidized by OH• to degradation products, as seen in Eqs. (6)–(14)[1,10]. The degradation process of CR dye could be described as inFig. 6(b) and following equations[1,6,10,17,18,25]:
According to Eq. (6), the anionic diazo of CR dye is dissolved and ionized out an anion of sulfonate group (CR–SO3–) in the aqueous solution. Under light illumination, the schematic shows that an electron is acquired the energy of a photon to move from the valance band (VB) to the conduction band (CB) of theα-Fe2O3 NPs semiconductor, and a hole is simultaneously left behind in the VB, as seen in Eq. (7). At the VB, this hole migrates to the surface ofα-Fe2O3 NPs and reacts with H2O molecule, to generate hydroxyl radical (OH•) for oxidation of dye, as seen in Eqs. (9) and (10). In addition, the absorbed O2 molecules react with electrons (e–) and H+ ions to form hydroxyl radical (OH•) at the CB, as in Eq. (11)–(13). The anion sulfonate groups (CR–
) are absorbed on the surface ofα-Fe2O3 NP and oxidized by OH• to form the degradation products, as in Eqs. (10) and (14). Note that the higher density of OH· causes many successive reactions of the photocatalyst degradation process, leading to decompose CRdye molecules with high degradation efficiency. This kinetic mechanism has been clearly understood and explained, elsewhere[1,6,10,17,18].
Conclusion
In summary, Sn-dopedα-Fe2O3 nanoparticles (Sn-α-Fe2O3 NPs) were prepared using one–step hydrothermal method. The morphological and structural characterizations revealed that theα-Fe2O3 NPs composed of spherical-like shape with homogenous distribution and processed hematite crystal phase. Dopant–concentration–dependent bandgap of hematite nanoparticle exhibited redshift from 2.57 to 2.40 eV while Sn concentration was varied from 0%–4.0%, respectively. The Sn-α-Fe2O3 NPs performance showed higher photocatalytic activity than that of pureα-Fe2O3 NPs, under visible–light irradiation. The Sn-α-Fe2O3 NPs catalyst with 2.5% concentration gave the highest degradation efficiency of 97.8 % for CR dye after 120 min of visible-light irradiation. These results suggest that the Sn-α-Fe2O3 NPs based catalyst is a potential photocatalyst in dye wastewater treatment.
[42] R R Piticescu, A M Motoc, A I Tudor et al. Hydrothermal synthesis of nanostructured materials for energy harvesting applications. Int J Mater Chem Phys, 1, 31(2015).
Van Nang Lam, Thi Bich Vu, Quang Dat Do, Thi Thanh Xuan Le, Tien Dai Nguyen, T.-Thanh-Bao Nguyen, Hoang Tung Do, Thi Tu Oanh Nguyen. One-step hydrothermal synthesis of Sn-dopedα-Fe2O3 nanoparticles for enhanced photocatalytic degradation of Congo red[J]. Journal of Semiconductors, 2022, 43(12): 122001