Author Affiliations
1SZU-NUS Collaborative Innovation Center for Optoelectronic Science & Technology, International Collaborative Laboratory of 2D Materials for Optoelectronic Science & Technology of Ministry of Education, Institute of Microscale Optoelectronics (IMO), Shenzhen University, Shenzhen 518060, China2Department of Physics, National University of Singapore, Singapore 117542, Singapore3e-mail: shunbin_lu@szu.edu.cn4e-mail: phyjiwei@nus.edu.sgshow less
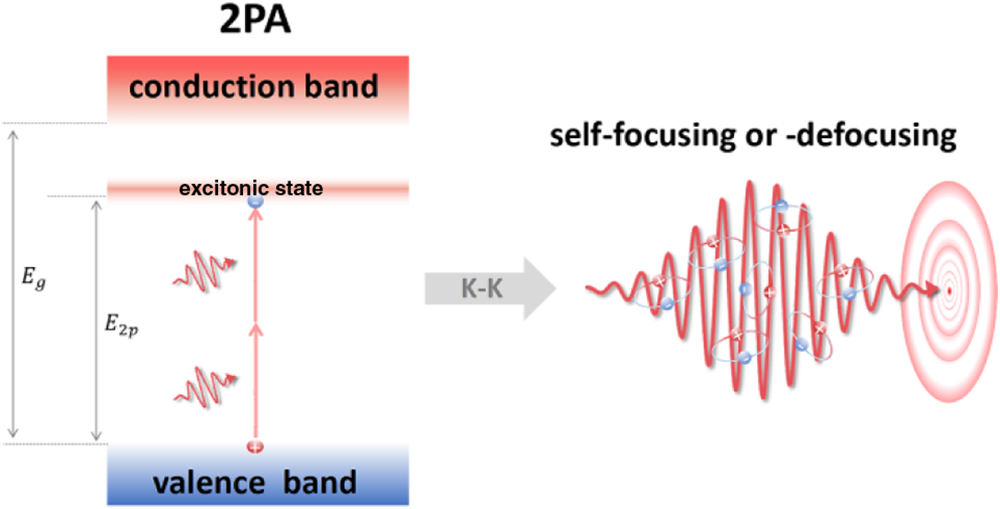
Fig. 1. Schematic of the optical Kerr effect (self-focusing or -defocusing) induced by 2PA resonant with the exciton energy (E2p). Eg is the bandgap.
Fig. 2. Comparison of the normalized
n2 between the prediction (pink area) by Eq. (
5) and the measured values (symbols) of monolayer (or few-layer) TMDs,
RPP(In=1), and h-BN [
25,
30–
34" target="_self" style="display: inline;">–34]. The envelopes of the pink area are calculated with hγ/E2p=0.05 and 0.15. Fig. 3. Normalized
n2 dispersion of monolayer
MoS2,
MoSe2,
WS2, and
WSe2 calculated by the two excitons (purple), A exciton (red), and B exciton (blue) with
hγ/E2p=0.075 eV. The symbols are the experimental data from Refs. [
3032" target="_self" style="display: inline;">–32] and scaled with
Z2′=1×10⁻¹⁴.
Fig. 4. Calculated
n2 dispersions of (a) monolayer RPP (
In=1,2,3,4) and (b) TMDs by Eq. (
4) and Eq. (
6). Calculated
n2 dispersions of (c) monolayer RPP (
In=1,2,3,4) and (d) TMDs by the two-parabolic-band model [
12]. Parameters used in the calculation are displayed in Table
3 in Appendix
A.
Fig. 5. (a) Calculated n2 values as a function of photon energy (x axis) and temperature (y axis) for monolayer RPP (In=1). (b) A log-log plot of the scaled n2 in the off-resonance region versus E2p. The experimental n2 values are scaled by Z2′(n02+2)4G(x) with n0 and Z2′ listed in Table 3 in Appendix A. The solid line is the theoretical result of Eq. (4) with no adjustable parameters and a slope of −2.
Fig. 6. Nonlinear refractive index, n2, as a function of photon energy (x axis) and temperature (y axis) for monolayer RPP: (a) In=2, (b) In=3, and (c) In=4. These n2 values are calculated with the averaged Z2′=1×10⁻¹⁴.
Fig. 7. Nonlinear refractive index, n2, as a function of photon energy (x axis) and temperature (y axis) for TMD monolayers: (a) MoS2, (b) MoSe2, (c) WS2, and (d) WSe2. These n2 values are calculated with the averaged Z2′=1×10⁻¹⁴.
Fig. 8. (a) WFOM of monolayer TMDs, (b) WFOM of monolayer RPPs, (c) TFOM of monolayer TMDs, and (d) TFOM of monolayer RPPs. The gray area corresponds to the wavelength range for optical communications.
Material | [] | [cm/GW] | | | Ref. |
---|
2D RPP () | 105.5 | 96.3 | 1.02 | 0.14 | This work | 2D RPP () | 22.9 | 9.9 | 0.27 | 0.07 | This work | 2D RPP () | 7.2 | 1.6 | 0.12 | 0.03 | This work | 2D RPP () | 1.3 | 0.3 | 0.03 | 0.04 | This work | 2D | 1.5 | 5.6 | 0.008 | 0.56 | This work | 2D | 19.1 | 212.5 | 0.07 | 1.72 | This work | 2D | 2.7 | 7.7 | 0.02 | 0.45 | This work | 2D | 15.8 | 79.1 | 0.06 | 0.78 | This work | Multilayer graphene | −800 | 900 | 0.20 | 1.40 | [37] | | 0.045 | 0.79 | – | 0.37 | [45] | GaAs | 0.16 | 10.2 | – | 0.10 | [45] | GaAs/AlAs superlattice | 0.15 | 1.5 | – | 0.87 | [46] | Conjugated 3,3’-bipyridine derivative | 0.0046 | | | | [43] |
|
Table 1. Nonlinear Coefficients and FOMs of Materials at 1550 nm
| [] | | [nm] | | Ref. |
---|
RPP () | 0.41 | 0.16 | 2700 | 2.11 | [25] | RPP () | 0.45 | 0.11 | 2700 | 2.21 | [25] | RPP () | 0.39 | 0.048 | 2700 | 2.41 | [25] | RPP () | 0.40 | 0.053 | 2700 | 2.32 | [25] | | −1.96 | −1.45 | 800 | 1.84 | [30] | 350 | 260.02 | 800 | 1.84 | [38] | 1.88 | 1.40 | 1064 | 1.84 | [38] | −0.21 | −0.15 | 1064 | 1.84 | [31] | | −0.12 | −0.034 | 1064 | 2.10 | [31] | 0.20 | 0.058 | 1000 | 2.10 | [39] | | −1.10 | −1.02 | 800 | 1.82. | [30] | 0.81 | 0.76 | 800 | 1.82 | [32] | 58.30 | 54.55 | 1064 | 1.82 | [40] | 128 | 119.77 | 1040 | 1.82 | [41] | | −18.70 | −12.27 | 1040 | 1.84 | [41] | h-BN | 0.12 | 0.30 | 1064 | 2.0 | [33] | BP | 860 | 26.73 | 800 | 2.5 | [34] |
|
Table 4. Extracted n2 Values from Experimental Data