• Photonics Research
  • Vol. 7, Issue 4, 464 (2019)
Chang-Hwan Yi1, Julius Kullig1、2, Martina Hentschel2, and Jan Wiersig1、*
Author Affiliations
  • 1Institut für Physik, Otto-von-Guericke-Universit?t Magdeburg, Postfach 4120, D-39016 Magdeburg, Germany
  • 2Institut für Physik, Technische Universit?t Ilmenau, D-98693 Ilmenau, Germany
  • show less
    DOI: 10.1364/PRJ.7.000464 Cite this Article Set citation alerts
    Chang-Hwan Yi, Julius Kullig, Martina Hentschel, Jan Wiersig. Non-Hermitian degeneracies of internal–external mode pairs in dielectric microdisks[J]. Photonics Research, 2019, 7(4): 464 Copy Citation Text show less
    (a) Real and (b) imaginary part of scaled frequency kR of the modes in the microdisk obtained by Eq. (1) for TE polarization with n=3.14, as a function of azimuthal mode number m. Dots (·), crosses (+), and open circles (∘) mark internal modes, external modes, and kmBR corresponding to the Brewster angle, respectively.
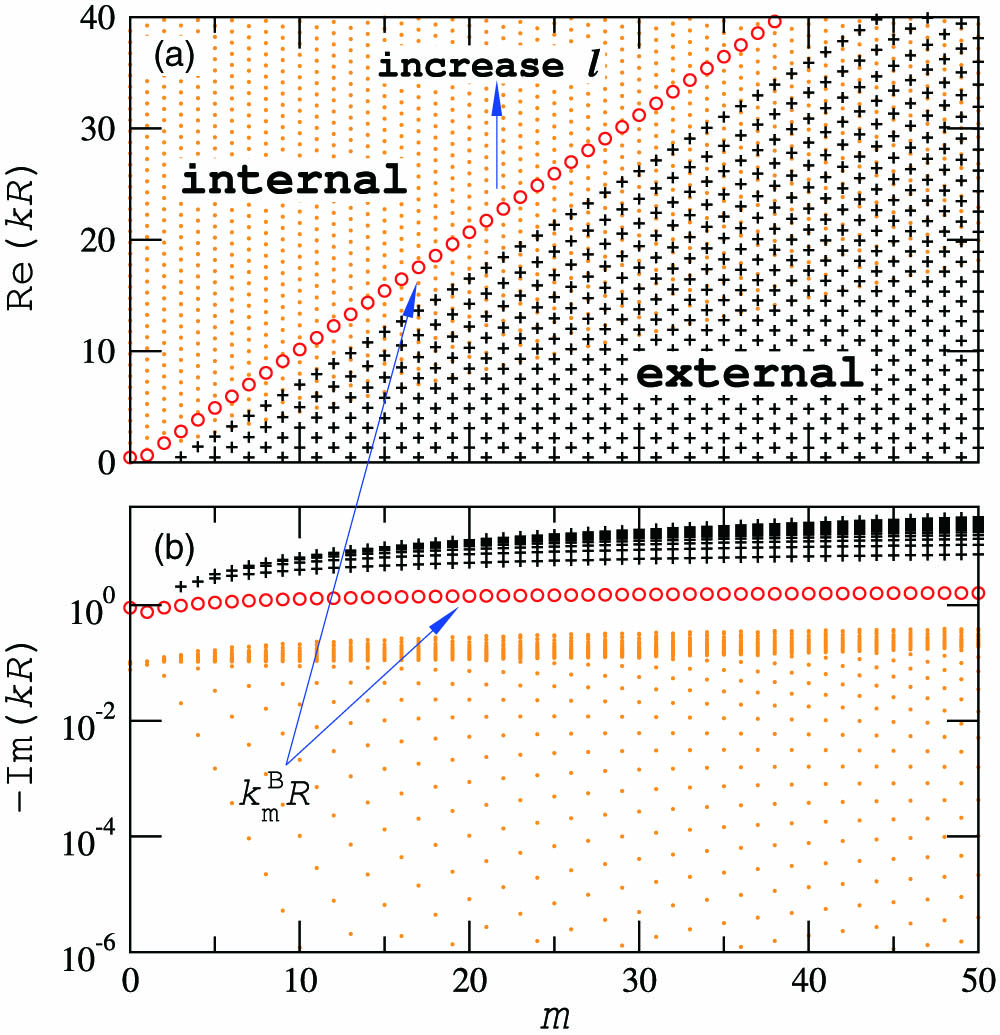
    Fig. 1. (a) Real and (b) imaginary part of scaled frequency kR of the modes in the microdisk obtained by Eq. (1) for TE polarization with n=3.14, as a function of azimuthal mode number m. Dots (·), crosses (+), and open circles (∘) mark internal modes, external modes, and kmBR corresponding to the Brewster angle, respectively.
    Degree of degeneracy of mode pairs Re(kmBR) and Re(kmIR) given by Eq. (3) as a function of azimuthal mode number m and refractive index n in the circular cavity. The arrowed curve separates the weak and strong coupling regimes. Δ−1 and the color code are in log scale from (black) min=10−1 to (white) max=105. The refractive index is sampled with 500 points from n=1.5 to n=4.
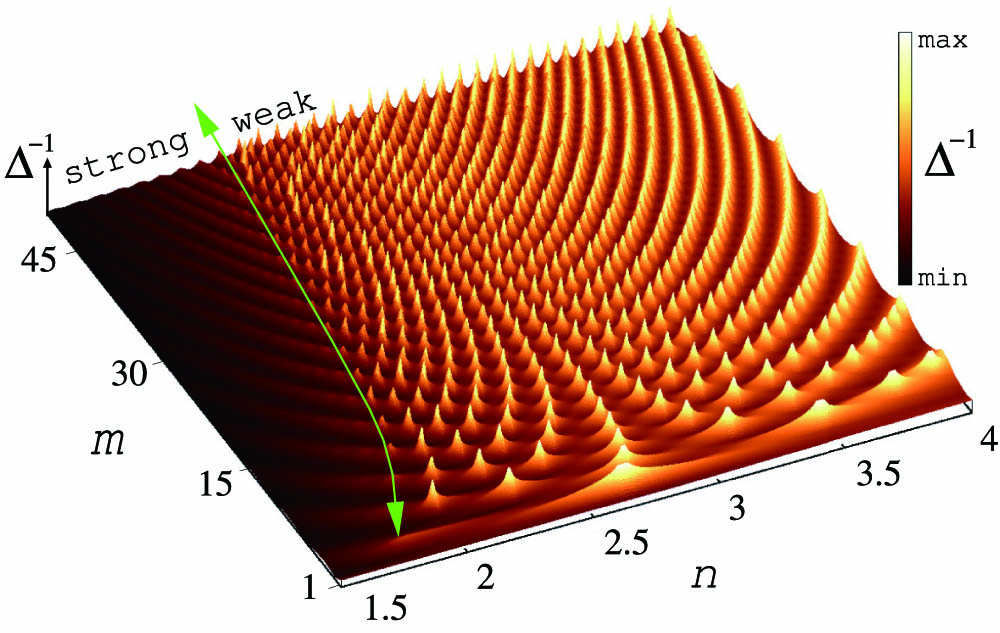
    Fig. 2. Degree of degeneracy of mode pairs Re(kmBR) and Re(kmIR) given by Eq. (3) as a function of azimuthal mode number m and refractive index n in the circular cavity. The arrowed curve separates the weak and strong coupling regimes. Δ1 and the color code are in log scale from (black) min=101 to (white) max=105. The refractive index is sampled with 500 points from n=1.5 to n=4.
    (a) Real and (b) imaginary part of kR in the circular cavity as a function of refractive index n with a fixed azimuthal mode number m=10 undergoing strong (i, ii) and weak [(iii, iv) and (v, vi)] coupling between k10BR and k10IR with different radial mode numbers l=3, 4, and 5. Solid-black and dashed-orange curves are k10BR and k10IR, respectively. Solid-blue arrows in (a) and (b) guide the trajectory of kmIR for increasing n. Dotted-blue vertical arrows indicate the change of a radial mode number l of kmIR (frequency of the nearest internal mode to the Brewster mode) from 3 to 4. The right panels show intensities |ψ(x,y)|2 of the modes marked by the same labels as in (a) and (b). The white-quarter circular and sky-blue oscillating curves superimposed on the right panels are the cavity boundaries and |ψ(x,0)|2, respectively.
    Fig. 3. (a) Real and (b) imaginary part of kR in the circular cavity as a function of refractive index n with a fixed azimuthal mode number m=10 undergoing strong (i, ii) and weak [(iii, iv) and (v, vi)] coupling between k10BR and k10IR with different radial mode numbers l=3, 4, and 5. Solid-black and dashed-orange curves are k10BR and k10IR, respectively. Solid-blue arrows in (a) and (b) guide the trajectory of kmIR for increasing n. Dotted-blue vertical arrows indicate the change of a radial mode number l of kmIR (frequency of the nearest internal mode to the Brewster mode) from 3 to 4. The right panels show intensities |ψ(x,y)|2 of the modes marked by the same labels as in (a) and (b). The white-quarter circular and sky-blue oscillating curves superimposed on the right panels are the cavity boundaries and |ψ(x,0)|2, respectively.
    (a) Real and (b) imaginary part of kmBR and kmIR as a function of refractive index n with a fixed azimuthal mode number m=50. The short segmented orange curves with a steeper slope in (a) and upper fluctuating orange curves in (b) belong to k50IR with different radial mode number l. The mode number l increases from left to right. The black curves with the more gentle slope in (a) and the lower fluctuating black curves in (b) belong to k50BR. Two examples l=17 and 18 of the internal mode with frequency k50IR are indicated in (a). Thin solid-green and dashed-red curves connect the values of k50IR and k50BR at which the real or the imaginary part of them crosses. The vertical-blue arrow separates the regions of strong and weak coupling at n≈2.22.
    Fig. 4. (a) Real and (b) imaginary part of kmBR and kmIR as a function of refractive index n with a fixed azimuthal mode number m=50. The short segmented orange curves with a steeper slope in (a) and upper fluctuating orange curves in (b) belong to k50IR with different radial mode number l. The mode number l increases from left to right. The black curves with the more gentle slope in (a) and the lower fluctuating black curves in (b) belong to k50BR. Two examples l=17 and 18 of the internal mode with frequency k50IR are indicated in (a). Thin solid-green and dashed-red curves connect the values of k50IR and k50BR at which the real or the imaginary part of them crosses. The vertical-blue arrow separates the regions of strong and weak coupling at n2.22.
    Illustration of the cavity boundary in Eq. (6) with ε=0.1 and N=20. The gray shaded region bounded by the corrugated black curve depicts the deformed cavity, while the region bounded by the dashed red curve is the undeformed circle (ε=0). n1 and n2 are the refractive indices of the interior and exterior of the cavity, respectively.
    Fig. 5. Illustration of the cavity boundary in Eq. (6) with ε=0.1 and N=20. The gray shaded region bounded by the corrugated black curve depicts the deformed cavity, while the region bounded by the dashed red curve is the undeformed circle (ε=0). n1 and n2 are the refractive indices of the interior and exterior of the cavity, respectively.
    (a) Real and (b) imaginary part of the frequencies kR of the modes in the microflower cavity as a function of deformation parameter ε and refractive index n with fixed (l,m)=(4,10). Note that ε decreases from left to right. Labels iii and iv are the same as in Fig. 3. Orange curves connecting the points marked by numbers from 1 to 12 show the Riemann surface topology around the EP. Blue curves are the branch-cut in Eq. (7).
    Fig. 6. (a) Real and (b) imaginary part of the frequencies kR of the modes in the microflower cavity as a function of deformation parameter ε and refractive index n with fixed (l,m)=(4,10). Note that ε decreases from left to right. Labels iii and iv are the same as in Fig. 3. Orange curves connecting the points marked by numbers from 1 to 12 show the Riemann surface topology around the EP. Blue curves are the branch-cut in Eq. (7).
    Intensity mode pattern |ψ(x,y)|2 in the microflower cavity corresponding to the marked points in Fig. 6 with the same labels. The white circular and corrugated curves are the cavity boundaries.
    Fig. 7. Intensity mode pattern |ψ(x,y)|2 in the microflower cavity corresponding to the marked points in Fig. 6 with the same labels. The white circular and corrugated curves are the cavity boundaries.
    Intensity mode pattern |ψ(x,y)|2 in the microflower cavity corresponding to the marked points in Fig. 6 with the same labels. The white corrugated circular and sky-blue oscillating curves, superimposed on the figures, are the cavity boundaries and |ψ(x,0)|2, respectively. The red dashed horizontal line in the middle panel is the x axis.
    Fig. 8. Intensity mode pattern |ψ(x,y)|2 in the microflower cavity corresponding to the marked points in Fig. 6 with the same labels. The white corrugated circular and sky-blue oscillating curves, superimposed on the figures, are the cavity boundaries and |ψ(x,0)|2, respectively. The red dashed horizontal line in the middle panel is the x axis.
    (a) Real and (b) imaginary part of the frequency relative to kR¯=(kmBR+kmIR)/2 of the selected internal and external modes’ frequencies kR as a function of deformation parameter ε. The EPs marked by vertical arrows are at εl,mEP=−0.00127, −0.00582, and −0.0136 for the modes (l,m)=(4,12), (4,10), and (3,7), respectively.
    Fig. 9. (a) Real and (b) imaginary part of the frequency relative to kR¯=(kmBR+kmIR)/2 of the selected internal and external modes’ frequencies kR as a function of deformation parameter ε. The EPs marked by vertical arrows are at εl,mEP=0.00127, 0.00582, and 0.0136 for the modes (l,m)=(4,12), (4,10), and (3,7), respectively.
    (a),(c) and (b),(d) show the real and the imaginary parts of kR in the complex n plane, respectively. The (blue and gray) dashed curves belong to kR of the external mode and the (orange and gray) solid curves correspond to the internal mode. In (a) and (b), the cross (empty circle) marks the initial frequency of the internal (external) mode. The EP is marked by a black dot. In (c) and (d), the vicinity of the EP is shown via Δn=n−nEP. The outer thick red curve corresponds to a two-fold encircling of the EP. Thin gray dots represent the Riemann sheets of kR.
    Fig. 10. (a),(c) and (b),(d) show the real and the imaginary parts of kR in the complex n plane, respectively. The (blue and gray) dashed curves belong to kR of the external mode and the (orange and gray) solid curves correspond to the internal mode. In (a) and (b), the cross (empty circle) marks the initial frequency of the internal (external) mode. The EP is marked by a black dot. In (c) and (d), the vicinity of the EP is shown via Δn=nnEP. The outer thick red curve corresponds to a two-fold encircling of the EP. Thin gray dots represent the Riemann sheets of kR.
    (a) Real (left/red axis/dashed curves) and imaginary (right/blue axis/solid curves) parts of the wave number kR relative to kR¯=(kIR+kEXR)/2 along the parameter curve in the complex n plane. The parameter curve is shown in (b), where the EP is marked as a thick black dot. τ parameterizes this curve starting at τ=0 for real n. τ=3 is marked as a black cross. The corresponding mode patterns at τ=0 (i), τ=τEP≈1.411 (EP), and τ=3 (f) are shown. The color map of the intensities ranging from black to red is truncated outside the cavity at twice the maximum value inside the cavity.
    Fig. 11. (a) Real (left/red axis/dashed curves) and imaginary (right/blue axis/solid curves) parts of the wave number kR relative to kR¯=(kIR+kEXR)/2 along the parameter curve in the complex n plane. The parameter curve is shown in (b), where the EP is marked as a thick black dot. τ parameterizes this curve starting at τ=0 for real n. τ=3 is marked as a black cross. The corresponding mode patterns at τ=0 (i), τ=τEP1.411 (EP), and τ=3 (f) are shown. The color map of the intensities ranging from black to red is truncated outside the cavity at twice the maximum value inside the cavity.
    In (a), Re(kR) is shown for varying real refractive index n for internal (black thick curves) and external (magenta thin curves) modes with m=12 in a circular cavity. In (b)–(e), the paths in the complex n plane are shown for which two modes (one internal and one external) with m=12 have the same Re(kR). The end point of each curve marks an EP. Colored dots in (a) mark the intersections as starting points for the parameter curves in (b)–(e).
    Fig. 12. In (a), Re(kR) is shown for varying real refractive index n for internal (black thick curves) and external (magenta thin curves) modes with m=12 in a circular cavity. In (b)–(e), the paths in the complex n plane are shown for which two modes (one internal and one external) with m=12 have the same Re(kR). The end point of each curve marks an EP. Colored dots in (a) mark the intersections as starting points for the parameter curves in (b)–(e).
    Chang-Hwan Yi, Julius Kullig, Martina Hentschel, Jan Wiersig. Non-Hermitian degeneracies of internal–external mode pairs in dielectric microdisks[J]. Photonics Research, 2019, 7(4): 464
    Download Citation