• Advanced Photonics Nexus
  • Vol. 2, Issue 4, 046002 (2023)
Zheng Ge1、2, Zhi-Yuan Zhou1、2、*, Jing-Xin Ceng3, Li Chen1、2, Yin-Hai Li1、2, Yan Li1、2, Su-Jian Niu1、2, and Bao-Sen Shi1、2、*
Author Affiliations
  • 1University of Science and Technology of China, CAS Key Laboratory of Quantum Information, Hefei, China
  • 2University of Science and Technology of China, CAS Center for Excellence in Quantum Information and Quantum Physics, Hefei, China
  • 3Science and Technology on Electro-Optical Information Security Control Laboratory, Tianjin, China
  • show less
    DOI: 10.1117/1.APN.2.4.046002 Cite this Article Set citation alerts
    Zheng Ge, Zhi-Yuan Zhou, Jing-Xin Ceng, Li Chen, Yin-Hai Li, Yan Li, Su-Jian Niu, Bao-Sen Shi. Thermal camera based on frequency upconversion and its noise-equivalent temperature difference characterization[J]. Advanced Photonics Nexus, 2023, 2(4): 046002 Copy Citation Text show less
    (a) Schematic diagram of the experimental setup. L, lens; DM, dichromatic mirror; BP, bandpass filter; and PPLN, periodically poled lithium niobate crystal. (b) Theoretical calculation of phase mismatch within the crystal (co-linear case) in which MgO-PPLN crystal length is 30 mm, polarization period is 23.7 μm, and temperature is controlled at 39°C. The pump light wavelength is 1080 nm. (c) Normalized upper conversion efficiency. The conversion bandwidth is 220 nm near 4.14 μm.
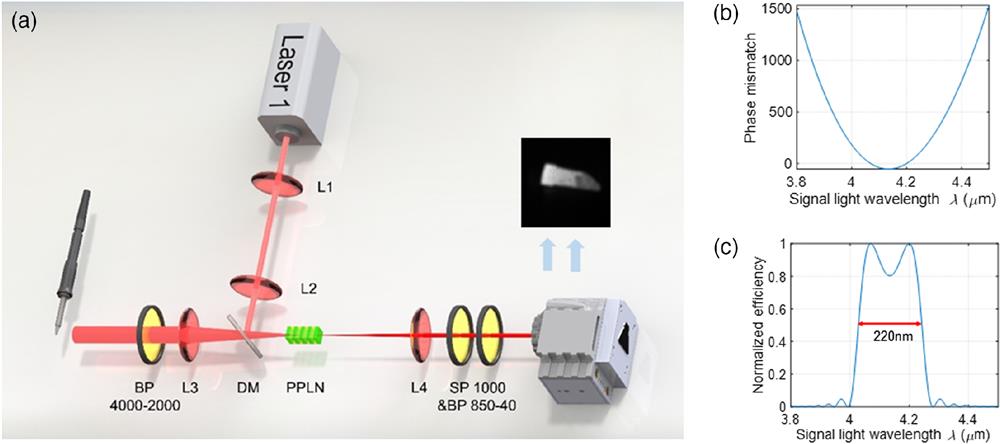
    Fig. 1. (a) Schematic diagram of the experimental setup. L, lens; DM, dichromatic mirror; BP, bandpass filter; and PPLN, periodically poled lithium niobate crystal. (b) Theoretical calculation of phase mismatch within the crystal (co-linear case) in which MgO-PPLN crystal length is 30 mm, polarization period is 23.7  μm, and temperature is controlled at 39°C. The pump light wavelength is 1080 nm. (c) Normalized upper conversion efficiency. The conversion bandwidth is 220 nm near 4.14  μm.
    (a) Results of the images taken in the NETD test. (b) NETD matrix given by calculation based on Eq. (11). (c) NETD matrix obtained based on the conventional measurement method.
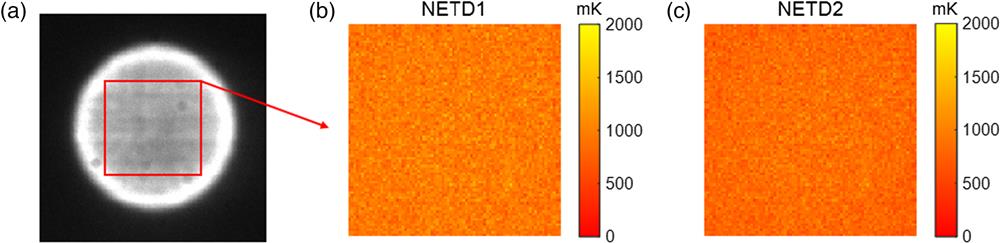
    Fig. 2. (a) Results of the images taken in the NETD test. (b) NETD matrix given by calculation based on Eq. (11). (c) NETD matrix obtained based on the conventional measurement method.
    (a) Comparison of measured and calculated NETDs as a function of QCE with different exposure time. (b) Central wavelengths of blackbody radiation at different temperatures (solid line) and corresponding NETD predictions (dashed line).
    Fig. 3. (a) Comparison of measured and calculated NETDs as a function of QCE with different exposure time. (b) Central wavelengths of blackbody radiation at different temperatures (solid line) and corresponding NETD predictions (dashed line).
    (a) PCB used for the experimental tests. (b) Photographic results of the UCD (part of the area). The PCB is preheated.
    Fig. 4. (a) PCB used for the experimental tests. (b) Photographic results of the UCD (part of the area). The PCB is preheated.
    Zheng Ge, Zhi-Yuan Zhou, Jing-Xin Ceng, Li Chen, Yin-Hai Li, Yan Li, Su-Jian Niu, Bao-Sen Shi. Thermal camera based on frequency upconversion and its noise-equivalent temperature difference characterization[J]. Advanced Photonics Nexus, 2023, 2(4): 046002
    Download Citation