
Zheng Ge, Zhi-Yuan Zhou, Jing-Xin Ceng, Li Chen, Yin-Hai Li, Yan Li, Su-Jian Niu, Bao-Sen Shi. Thermal camera based on frequency upconversion and its noise-equivalent temperature difference characterization[J]. Advanced Photonics Nexus, 2023, 2(4): 046002
- Advanced Photonics Nexus
- Vol. 2, Issue 4, 046002 (2023)
Abstract
1 Introduction
Spectroscopy in the mid-infrared (MIR) band has long been of great value in fields such as environmental monitoring,1
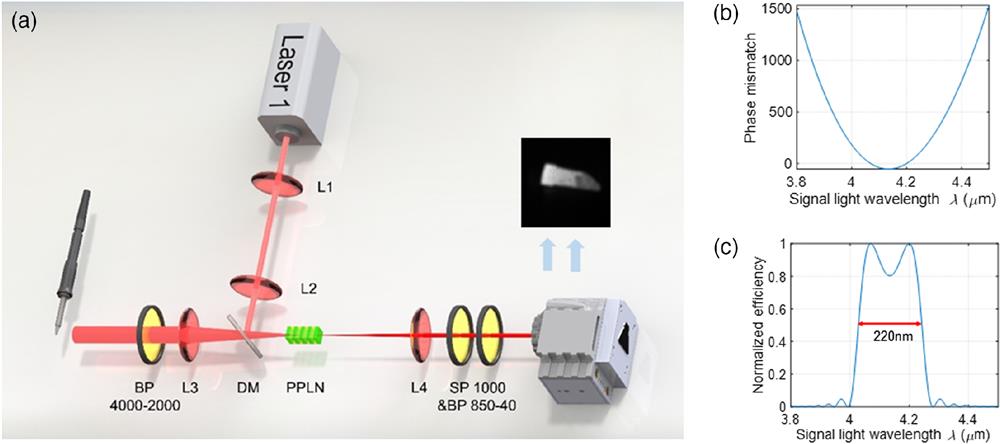
Upconversion imaging is based on sum frequency generation in nonlinear crystals, where MIR signal light with frequency is upconverted to by pump light with frequency . This process satisfies the law of energy conservation, i.e., , where is Planck’s constant. In order to achieve the highest frequency conversion efficiency, quasiphase-matching (QPM) techniques are often used to compensate for the phase mismatch, and the polarization period is designed such that , satisfying the momentum conservation condition. Currently, periodically poled lithium niobate (PPLN) crystals have been more widely used to achieve infrared upconversion imaging,25 but single-period crystals usually suffer from a narrow conversion bandwidth. In thermal imaging case, the target temperature radiation covers a wide range of wavelengths. If the conversion bandwidth can be widened while maintaining a good conversion efficiency, there will be a significant improvement in the detection of the semaphore and be beneficial to the increase in the signal-to-noise ratio. Tuning the temperature,26 scanning the pump wavelength,27 and rotating the crystal angle can extend the conversion wavelength range but significantly increases system and measurement complexity. Another solution is the use of chirped crystals, which have been used to achieve adiabatic nonlinear conversions with large phase-matching bandwidths.15,28,29 However, this solution also has stringent requirements for crystal design processing and pumped optical power. In this work, a broad spectral conversion of the MIR beam can be achieved using only single-period PPLN crystals in a specific wavelength band, using a similar approach to previous work.30 The variation of the phase mismatch within the crystal with the wavelength of the signal light is calculated in Fig. 1(b) for fixed experimental parameters. The line shape in this figure has an inflection point at , where the rate of change of is small within a certain bandwidth in the vicinity, and thus frequency conversion can be achieved for bandwidths above 200 nm, as shown in Fig. 1(c).
![]()
Figure 1.(a) Schematic diagram of the experimental setup. L, lens; DM, dichromatic mirror; BP, bandpass filter; and PPLN, periodically poled lithium niobate crystal. (b) Theoretical calculation of phase mismatch within the crystal (co-linear case) in which MgO-PPLN crystal length is 30 mm, polarization period is
2 Methods
In our experimental setup, an industrial laser was used as the pump source with a central wavelength of 1080 nm. After passing through the lenses L1 () and L2 (), the pump light was scaled down to pass through the crystal. The MIR source is a temperature-controlled soldering iron or a standard blackbody oven that emits broadband blackbody radiation, which was collected by lens L3 (). The BP 4000-2000 allows only MIR light centered at 4000 nm to pass within a bandwidth of 2000 nm; the later BP 850-40 is similar. The type-0 (ZZZ) PPLN crystal has a dimension of , mounted in a homemade temperature-controlled furnace. After passing through the frequency conversion process, the upconverted image of an MIR target with a center wavelength of 856 nm is captured by an sCMOS camera (Dhyana95 V2, Tucsen). The camera has a sensor area of and a total pixel count of . The lenses L3 and L4 () formed a 4-f imaging system, with the center of the crystal corresponding to the focal plane position. The shortpass 1000-nm and bandpass 850- to 40-nm filters at the output filtered out the pump light and its resulting second harmonics, while shielding the ambient light as much as possible. The imaging results of the soldering iron tip at 430°C are also shown in Fig. 1(a), where the curved contour of the edge corresponds to the limit of the imaging field of view.
Sign up for Advanced Photonics Nexus TOC. Get the latest issue of Advanced Photonics Nexus delivered right to you!Sign up now
For the UCD introduced above, we further explored its NETD, which is an important parameter characterizing its imaging capability. The thermal radiation target is considered as an ideal blackbody, and the incident flux received by the detector can be described as31
The responsiveness of the system concerning the incident flux is defined as , where is the detector signal reading and is the incident flux. The value of the responsivity varies in different systems, which is an important factor causing the difference in NETD. Here we consider a special case when the signal is exactly equal to the noise. According to the definition of the equivalent noise power, we have , where is the detector noise reading, and NEP is the acronym for noise equivalent power. Applying this to Eq. (3), the amount of noise can be introduced for discussion,
The NEP remains an important factor of inquiry in the discussion of system NETD. For an MIR detector based on frequency upconversion, the NEP expression can be written as follows based on previous research work:22
Then,
By definition, NETD is equal to the change when is satisfied, which gives
3 Discussion
Based on Eqs. (8) and (11), the NETD of the upconverted detector can be directly estimated when its NEP is known, while for a newly built device, the NETD value can also be easily calculated based on experimental measurements. To test our calculations, we used a standard blackbody source instead of the soldering iron as the infrared target, which has better temperature stability. The heat source was placed 200 mm in front of the UCD. The imaging result is shown in Fig. 2(a) with a field-of-view size of , and the test area is the part of this figure inside the red box. The mean and standard deviation of the readings for each pixel were determined by taking several video frames at a constant temperature. We bring the results obtained in the experiment into Eq. (11) to obtain the first NETD matrix, shown in Fig. 2(b). In the experiment, the temperature of the blackbody was set to 95°C, the pump laser power was adjusted to 60 W to achieve a quantum conversion efficiency (QCE) of , and the single-exposure time was 1 s.
![]()
Figure 2.(a) Results of the images taken in the NETD test. (b) NETD matrix given by calculation based on Eq. (11). (c) NETD matrix obtained based on the conventional measurement method.
To verify the accuracy of our evaluation method, the device was next tested using a conventional NETD test means. The target temperature was first set to 90°C, and 32 frames of the test image were obtained. The average of the gray-scale values of each pixel in these frames was calculated to obtain the detector responsiveness matrix at this temperature. In the second step, the target temperature was set to 100°C, and the above operation was repeated, obtaining a second set of responsivity matrices. The two were subtracted and divided by the temperature difference to calculate the gradient value of the responsivity concerning temperature. Finally, setting the target temperature to 95°C, 32 consecutive frames of data were acquired and the standard deviation of each pixel was calculated separately, which constituted the noise matrix. Using the obtained results divided by the previous gradient matrix, the NETD matrix was obtained, as shown in Fig. 2(c). The average values of the two NETD matrices in Figs. 2(b) and 2(c) are 951 and 829 mK. Although the feasibility of our evaluation scheme is initially demonstrated, the measured values of NETD are not satisfactory. This is because the UCD does not operate in the optimal band due to the limitation of the operating temperature range of the blackbody source; a detailed discussion on this point will be given later. In addition, the standard deviation of each pixel point in the experiment is not entirely due to noise. Any perturbation in the experiment may cause ups and downs in the pixel gray-scale values. Therefore, adjacent are combined into a group, known in photographic terms as a bin4, and their total number is used as a new sample for the experiment. This increases the area of the new “pixel” by a factor of 16, effectively improving the signal-to-noise ratio, but at the cost of reducing the effective pixel count of the camera from to . This is a means of compromise, which works well in many practical measuring scenarios where the target is an area and the resolution required is not overly stringent. The final results obtained are 56 and 48 mK at an exposure time of 1 s, respectively, which is an order of magnitude improvement compared to the case of a single-pixel point.
According to the theoretical analysis above, the NETD of the UCD depends on various factors. In Fig. 3(a), the measured NETDs at different upconversion efficiencies, and exposure times are shown separately and compared with the results calculated theoretically. The time in Fig. 3(a) legend is the single-frame exposure time, and completion of a set of tests requires completion of all 32 frames of image acquisition. The conversion efficiency is adjusted during the experiment by variation of the pump light intensity, and the relationship between them has been measured in advance. The measured NETDs are overall higher than the theoretical predictions but are largely consistent with the trend shown by the latter. The additional deviation comes from two main sources, namely, the power jitter of the pump laser and the temperature drift of the blackbody source. We measured a root-mean-square (RMS) stability of the output power of 2.62‰, resulting in a temperature measurement deviation calculated as . The temperature drift of the blackbody source as an infrared target was , as specified by the manufacturer. As these two perturbations are random and independent of each other, they introduce additional noise into the experiment, and the total deviation of the temperature measurements is approximately . This estimate explains the deviation from theory and measurement quite well, but it is worth noting that at higher QCEs, the experimental results start to show some outliers. This is probably due to the fact that the corresponding pumped optical power exceeds 80 W at this point and the higher power density affects the thermal stability of the crystal. The theoretical prediction of the effect of the target center temperature on the detector NETD is given in Fig. 3(b), and this result is calculated based on the same conversion bandwidth. The first set of results in this figure at 368.15 K (95°C) is given experimentally, and this is combined with Eq. (11) to obtain the entire predicted curve. As can be seen from the blackbody radiation-temperature curve given by the solid line in this figure, the central conversion wavelength of the detector in this experiment is , and the best matching temperature is . As mentioned above, the UCD does not operate in the optimal temperature interval. For our experimental setup, the NETD using a target center temperature of 700 K is only about one-twentieth of that at 368 K. Borrowing the results given in Figs. 2(b) and 2(c), the predicted mean value of NETD for each pixel is about 37 mK under the same experimental conditions using a 700-K target. Meanwhile, for the case where the target area occupies multiple pixels, the NETD prediction drops from 48 to about 2 mK.
![]()
Figure 3.(a) Comparison of measured and calculated NETDs as a function of QCE with different exposure time. (b) Central wavelengths of blackbody radiation at different temperatures (solid line) and corresponding NETD predictions (dashed line).
In Fig. 4, we show the results of the UCD for a general temperature object. An ordinary printed circuit board (PCB) was laminated to the electric heating platform for 10 s. Due to the different thermal conductivities of the substrate, the internal copper conductive layer, and the metal part of the surface, a clear temperature distribution is presented. With the help of the precalibrated results, we can give the specific temperature distribution of the target, as shown in Fig. 4(b). The internal structure of the PCB board is simply presented through heat conduction. In addition, the angular resolution of the UCD in the experiment is 0.0035, which is currently limited by the transverse dimensions of the crystal. This technique could have potential applications in engineering fields, such as nondestructive testing of objects. For example, impurities, internal damage, and cavities can cause changes in thermal conductivity so that the target presents a distinguishable temperature distribution after uniform heating.
![]()
Figure 4.(a) PCB used for the experimental tests. (b) Photographic results of the UCD (part of the area). The PCB is preheated.
4 Conclusion
The best NETD test result obtained in the experiment was , while in the ideal case the theoretical prediction of the NETD for our device is about 2 mK, which is significantly lower than the NETD (25 mK) of the current thermal imager used for the study (FLIR SC7000). The inability of the blackbody furnace used in the tests to operate at higher temperatures has become a major factor limiting the NETD optimization of the system at this time. Without considering the objective experimental constraints, the theoretical analysis above provides a viable option to further reduce the NETD. Equations (5) and (8) show that the NEP and NETD of the system can be optimized by increasing the QCE and the measurement time. And the conversion bandwidth of the system and NETD are approximately inversely related while the NEP is kept constant. Within the operating window of our UCD, the phase-matching condition is always satisfied, and therefore a broadband conversion will result in a higher overall conversion efficiency compared to a narrowband UCD. In this case, because of the thermal noise of the pump, the readout noise of the detector is constant, and a larger converted signal strength in broadband conditions will lead to an increase in the signal-to-noise ratio, i.e., a decrease in NETD.
In summary, we investigated an MIR detector based on a frequency upconversion process and its NETD characterization. The conversion of MIR radiation with bandwidth was achieved using a single QPM crystal, with an imaging field of view of and a QCE of . We theoretically analyzed the factors influencing the NETD of the system, gave a calculation equation to estimate this metric, and experimentally compared the results with conventional NETD tests. We also studied the test results of the device for general temperature targets. The optimal detection temperature of our detector is around 700 K. The choice of different upconversion crystals allows the migration of the detection window. This work provides a reliable NETD evaluation scheme for such frequency-based upconversion infrared imaging systems. At the same time, our device demonstrates good temperature detection performance, which has potential applications in remote sensing, material structure detection, etc.
Biographies of the authors are not available.
References
[12] S. Baldelli. Infrared image upconversion. Nat. Photonics, 5, 75-76(2011).
[23] S. Leclercq. Discussion about noise equivalent power and its use for photon noise calculation.
[31] A. Redjimi et al. Noise equivalent temperature difference model for thermal imagers, calculation and analysis. Sci. Tech. Rev., 64, 42-49(2014).

Set citation alerts for the article
Please enter your email address
© Copyright 2018-2021 | Chinese Laser Press. All Rights Reserved 沪ICP备15018463号-20