
Yi Zhang, Zhiyu Xiang, Shuya Chen, Shuxia Gu. Optimization on Visual Odometry under Weak Texture Environment[J]. Acta Optica Sinica, 2018, 38(6): 0615001
- Acta Optica Sinica
- Vol. 38, Issue 6, 0615001 (2018)
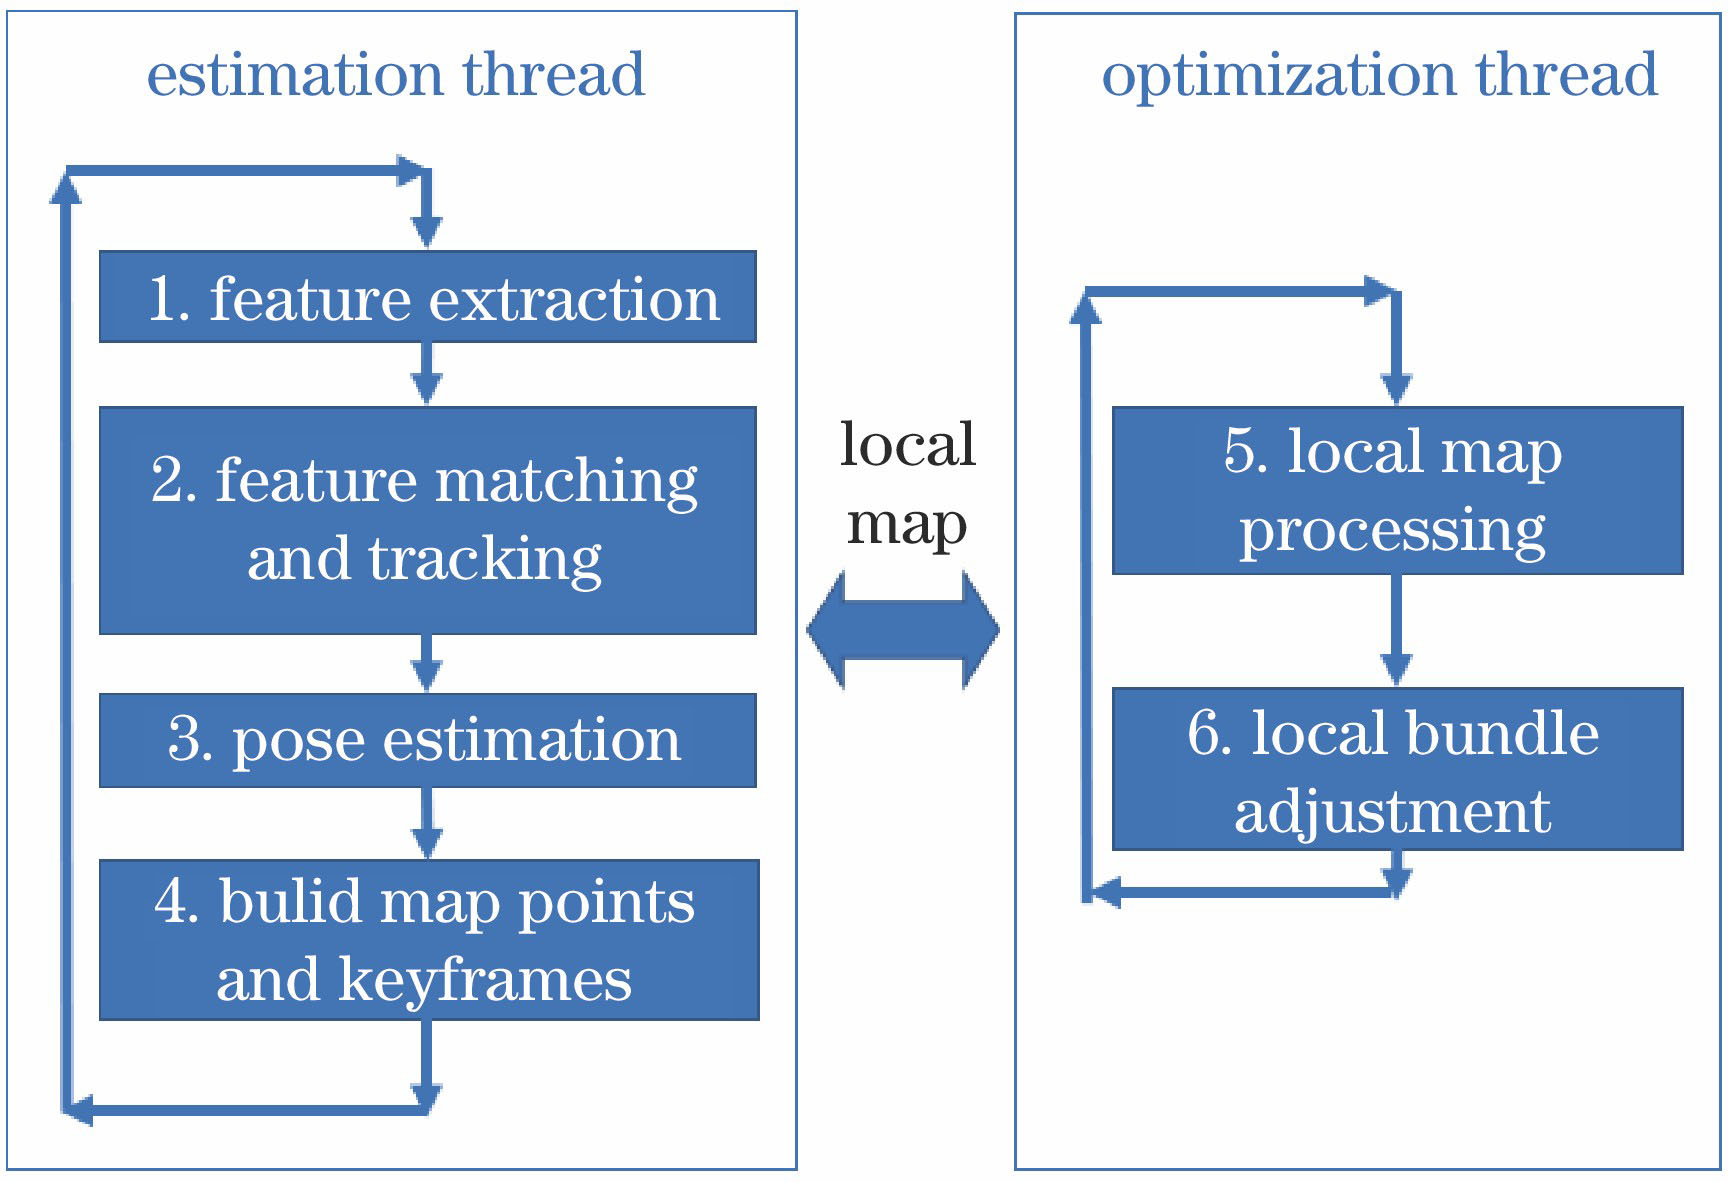
Fig. 1. Framework of system
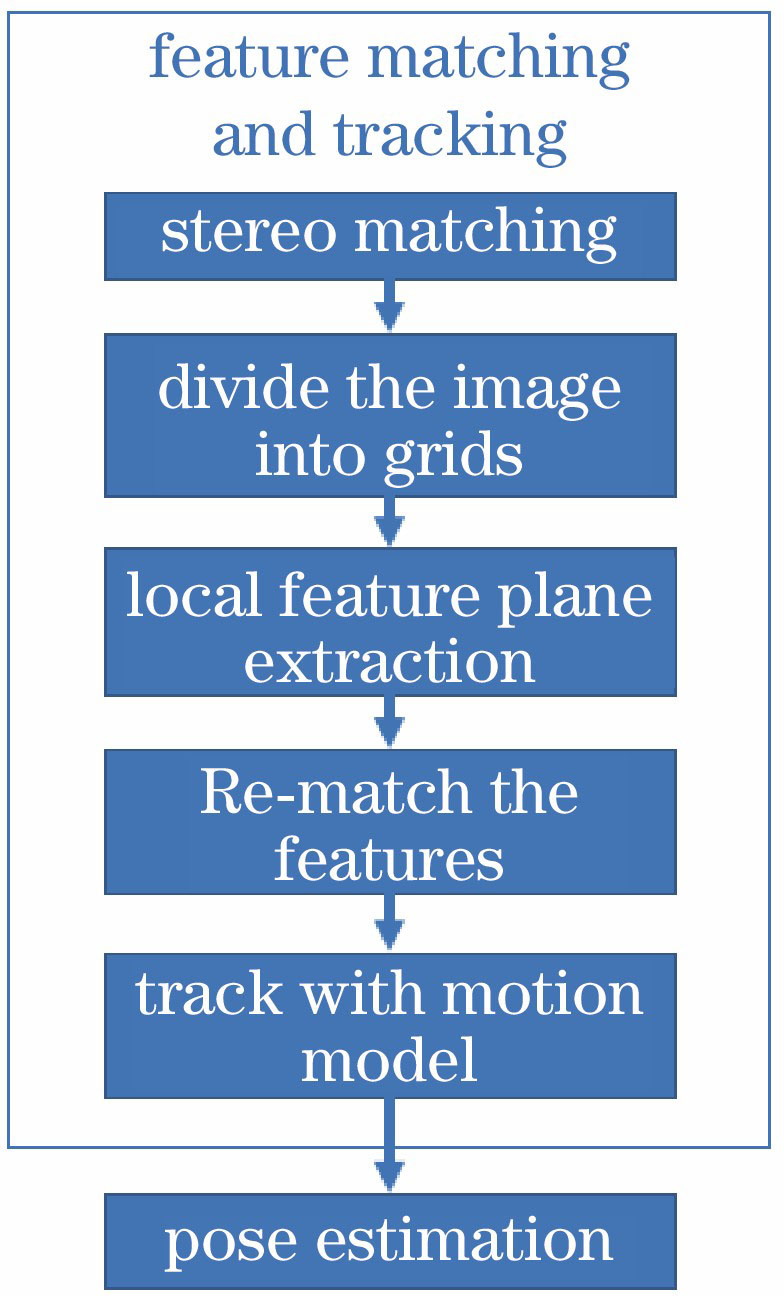
Fig. 2. Flowchart of optimization algorithm
Fig. 3. Example of stereo matching in KITTI01 sequence. (a) Features in left image; (b) features in right image
Fig. 4. Example of image segmentation in KITTI01 sequence
Fig. 5. Feature plane extracted in an image block
Fig. 6. Example of feature re-matching
Fig. 7. Binocular stereoscopic imaging model
Fig. 8. Scenes of KITTI 01 sequence
Fig. 9. Comparison of the number of local stereo match points in left and right images (a) before and (b) after optimization
Fig. 10. Number of stereo matching points in KITTI 01 sequence
Fig. 11. Comparison of error of KITTI 01 sequence
Fig. 12. Accuracy comparison of different algorithms in KITTI 11 sequence
Fig. 13. (a) Electric hunting cart; (b) BumbleBee2 binocular camera
Fig. 14. Part of the experimental scene. (a) Weak texture environment; (b) moving pedestrians and vehicles; (c) shadow, exposure and other light changes
Fig. 15. Results of actual scene experiment
|
Table 1. Precision comparison of different algorithms in KITTI benchmark
|
Table 2. System runtime statistics

Set citation alerts for the article
Please enter your email address
© Copyright 2018-2021 | Chinese Laser Press. All Rights Reserved 沪ICP备15018463号-20