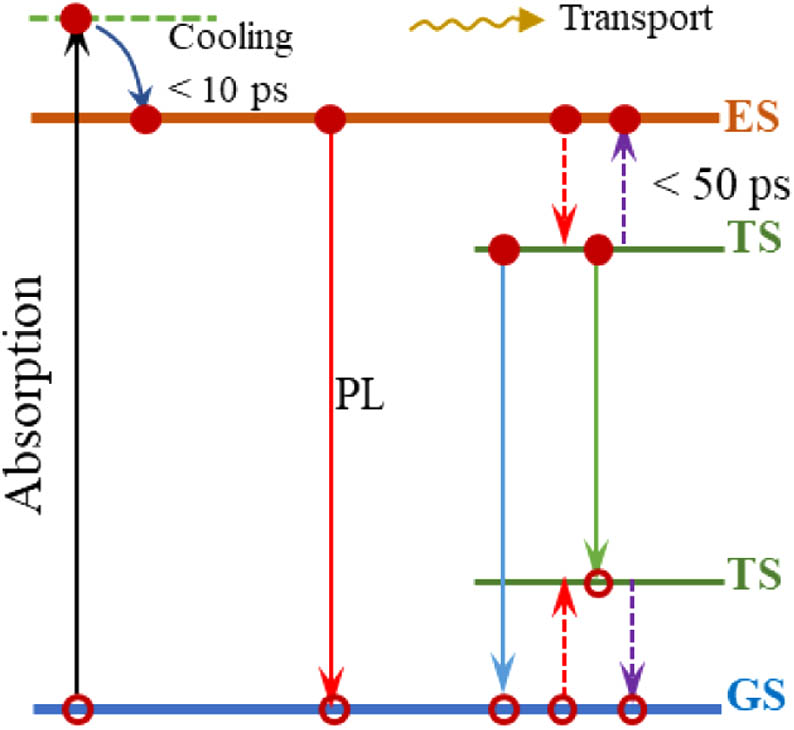
Fig. 1. Carrier dynamic model.
Fig. 2. (a) Integrated PL intensity linearly increasing with excitation power in
CsPbBr3 NCs. Reprinted with permission [
27]. (b) Fitting results of excitation density dependent PL spectra of the pristine and TOPO-treated
CsPbBr3 perovskite films. Reprinted with permission [
46]. (c) Power-dependent emission spectra indicating lasing of
CsPbBr3 nanowires. Inset: a two-dimensional pseudo-color plot of emission spectra at different pump fluences. (d) The power dependence of the integrated emission intensity and the FWHM of the dominant emitted lasing peak. Reprinted with permission [
47].
Fig. 3. Simulated TRPL curves. Solid lines were calculated by single exponential function using different lifetimes of 1 ns (red), 2 ns (blue), and 10 ns (green). Dashed curves were calculated using the double exponential formula by fixing two lifetimes of τ1=2 ns and τ2=10 ns, with a change of their weighted amplitude A.
Fig. 4. (a)
CsPbBr3 perovskite films with and without pre-coating of PVP on the substrate and (b) pristine, TOPO-treated, and TOPO/PMMA-treated perovskite films. Reprinted with permission [
46].
Fig. 5. (a) TRPL plots of the
CsPbI2Br films fabricated on a glass substrate, treated by the GTA, GTA-ATS-Tol, and GTA-ATS-IPA processes. Inset: SSPL spectra of the corresponding
CsPbI2Br films. Reprinted with permission [
55]. (b) PL and (c) TRPL spectra of 0 and 0.5% Nb-doped
CsPbI2Br films. Reprinted with permission [
60]. (d) TRPL decay curves obtained for
CsPbX3 NCs with halogen ions varying from Cl to I. Reprinted with permission [
67]. (e) TRPL decay profile and (f) temperature-dependent average lifetime of
CsPbBr3 NCs. Reprinted with permission [
27].
Fig. 6. (a) PL intensity just after photoexcitation as a function of carrier density of
Cs2AgBiBr6 double halide perovskite film. Reprinted with permission [
71]. (b) Initial PL intensity after laser excitation as a function of injected carrier density with the quadratic dependence at lower injected carrier density in the range of
∼1015–1017 cm−3 (solid red line) of
CsPbI3 halide perovskite film. Reprinted with permission [
87]. (c) Lifetime and
IPL|t=0 versus pump fluence in
CsPbBr3 nanowires. Reprinted with permission [
96].
Fig. 7. (a) Temperature-dependent PL spectra for
CsPbBr3 nanowires within the range of 80–295 K. The emission peak shows an evident blue shift (black arrow) and broadening with increasing temperature. (b) Temperature dependence of the FWHM extracted out from (a). Reprinted with permission [
96]. (c) FWHM as a function of temperature of
CsPbBr3 sphere. Reprinted with permission [
100]. (d) Temperature-dependent PL decay curves of colloidal
CsPbBr3 QDs with the temperature ranging from 80 to 380 K. (e) Average PL lifetimes of
CsPbBr3 NCs for NC493, NC512, and NC516 samples at various temperatures. Reprinted with permission [
104].
Fig. 8. (a) SSPL and (b) TRPL spectra of the
CsPbBr3 films deposited on FTO,
TiO2, and
TiO2/SnO2 ETLs. Reprinted with permission [
63]. (c) SSPL and (d) TRPL spectra of the
CsPbBr3 perovskite films with and without MnS HTL. Reprinted with permission [
121]. (e) SSPL and (f) TRPL spectra of
FTO/c−TiO2/m−TiO2/CsPbBr3 covered with and without
CsPbBrxI3−x NCs. Reprinted with permission [
122]. (g) SSPL and (h) TRPL spectra of the neat
CsPbI3 (black curve),
CsPbI3/PC61BM (blue curve), and
CsPbI3/Spiro−OMeTAD (red curve) films. Reprinted with permission [
87].
Fig. 9. (a) TRPL spectra of
CsPbI2Br thin films based on different ETLs. Reprinted with permission [
123]. (b) TRPL spectra of
CsPbI2Br thin films with and without
SnO2 ETL. Reprinted with permission [
124]. (c) TRPL decay profiles for
CsPbI2Br,
SnO2/CsPbI2Br, and
SnO2/ZnO/CsPbI2Br. Reprinted with permission [
51]. (d) SSPL and (e) TRPL spectra of
CsPbI2Br perovskite and
CsPbI2Br perovskite covered with different HTLs. Reprinted with permission [
117]. (f) TRPL and SSPL (inset) spectra of the
Bi2Te3/CsPbI2Br films. Reprinted with permission [
125]. (g) PL spectra of
CsPbBr3 microplatelet single crystals on GaN/mica. Power-dependent TRPL spectra of
CsPbBr3 on (h) mica and (i) GaN. Reprinted with permission [
131].
Fig. 10. (a) Decay associated spectra for three fitting components from TA spectra and (b) proposed excited dynamic model of
Cs2PdBr6 NCs. Reprinted with permission [
29]. (c) Charge carrier dynamic model of
Cs2AgBiBr6 NCs. Reprinted with permission [
28]. (d) Kinetics of XB (reduced by a factor of 24 and inverted), PA, and PL decay of
CsPbBr3 QDs. The black solid lines are multi-exponential fits to these kinetics. Reprinted with permission [
140].
Fig. 11. (a) TPC and (b) TPV studies for
SnO2- and
SnO2/ZnO-based
CsPbI2Br PSCs. Reprinted with permission [
51]. (c) TPC and (d) TPV studies for
CsPbI2Br film with or without
MnO3 layer. Reprinted with permission [
124]. (e) TPC and (f) TPV studies for
CsPbI2Br film with or without
(CsPbI2Br)1−x(CsPbI3)x layer. Reprinted with permission [
49].
Perovskite Material | Year | Model | (ns) | (ns) | | (ns) | | (ns) | | Reference |
---|
orthorhombic | 2017 | Single | 6.7 | | | | | | | [50] | cubic | 12.3 | | | | | | | film | 2018 | Single | 8.6 | | | | | | | [51] | QDs | 2018 | Single | 3.57–10 | | | | | | | [52] | | 2019 | Single | 4.6 | | | | | | | [49] | | 3.2 | | | | | | | with PEG | 2020 | Single | 32.1 | | | | | | | [53] | without PEG | 11.8 | | | | | | | | 2020 | Single | 0.553 | | | | | | | [54] | PEAI- | 15.358 | | | | | | | (GTA) | 2019 | Double | 4.3 | 1.964 | 0.12 | 4.478 | 0.88 | | | [55] | (GTA-AST-Tol) | 6.9 | 1.950 | 0.056 | 7.032 | 0.94 | | | (GTA-AST-IPA) | 14.1 | 4.806 | 0.12 | 14.516 | 0.88 | | | | 2019 | Double | 11.27 | 6.57 | 0.372 | 14.31 | 0.617 | | | [56] | | 2017 | Double | 14 | 4.6 | 0.28 | 18 | 0.72 | | | [57] | | 11 | 4 | 0.3 | 14 | 0.7 | | | | 2017 | Double | | 2.2 | | 11.1 | | | | [58] | | 2.1 | | 17.1 | | | | | 2018 | Double | 6.6 | 2.3 | | 8.1 | | | | [59] | | 2019 | Double | 0.453 | 0.453 | | 0.438 | | | | [60] | | 2.287 | 2.125 | | 3.875 | | | | 2019 | Double | 2.01 | 2.67 | 0.64 | 1.08 | 0.36 | | | [61] | | 16.0 | 11.8 | 0.59 | 22.1 | 0.41 | | | 2020 | Double | 20.57 | 12.95 | 0.25 | 23.0 | 0.75 | | | [62] | | 48.73 | 10.01 | 0.0652 | 851.43 | 0.935 | | cubic | 2018 | Double | 35.67 | 56.03 | 0.49 | 16.14 | 0.51 | | | [63] | | 2019 | Double | 6.07 | 2.93 | 0.76 | 16.05 | 0.24 | | | [64] | | 2020 | Double | 13.65 | 3.38 | 0.92 | 27.33 | 0.08 | | | [65] | with IPA treatment | 43.21 | 9.97 | 0.77 | 61.39 | 0.23 | | | NCs | 2018 | Triple | 6.91 | 2.09 | 0.079 | 5.19 | 0.604 | 11.41 | 0.317 | [66] | NCs | 2018 | Triple | 0.9 | 0.3 | 0.56 | 0.8 | 0.43 | 4.5 | 0.01 | [29] | | 2018 | Triple | | 0.05 | | 1 | | 100 | | [28] | NCs | 2019 | Triple | 1.34–7.9 | | | | | | | [67] | NCs | 2019 | Triple | | 0.294 | | 1.261 | | 6.054 | | [27] |
|
Table 1. Summary of the Reported Lifetime by Single Exponential Fitting, Average Lifetime, Its Individual Lifetime and Amplitude by Double and Triple Exponential Fitting in All-Inorganic Halide Perovskites
Perovskite Material | Year | Exciton Binding Energy (meV) | Reference |
---|
15 nm thick nanowires | 2018 | 93 | [111] | 250 nm thick nanowires | 65 | QDs with 5.5 nm size | 2017 | 50 | [106] | QDs with 7.3 nm size | 48 | QDs with 10.1 nm size | 34 | QDs | 2017 | 15.6 | [103] | QDs | 28.2 | QDs | 45.1 | NCs | 2018 | 68.1 | [108] | NCs | 62.7 | NCs | 54.6 | NCs | 2016 | 35 | [104] | NCs annealed at 300, 320, 340, 360, 380, 400 K | 2017 | 63.9, 61.4, 53.6, 51.8, 49.4, 44.1 correspondingly | [109] |
|
Table 2. Summary of the Exciton Binding Energy by Arrhenius Equation in Low-Dimensional Materials
Perovskite Material | Year | Lifetime without TL (ns) | Quencher Layer (Type) | Lifetime with TL (ns) | Efficiency (%) | Reference |
---|
orthorhombic | 2017 | 6.7 | (ETL) | 3.9 | 41.79 | [50] | cubic | 12.3 | (ETL) | 1.8 | 85.37 | (Cl) cubic | 14.3 | (ETL) | 1.5 | 89.51 | | 2018 | 35.67 | (ETL) | 5.47 | 84.66 | [63] | (ETL) | 2.2 | 93.83 | | 2019 | 17.16 | MnS (HTL) | 7.58 | 55.83 | [121] | | 2019 | 0.88 | NCs (HTL) | 0.45 | 48.86 | [122] | I NCs (HTL) | 0.3 | 65.91 | NCs (HTL) | 0.51 | 41.05 | NCs (HTL) | 0.16 | 81.82 | | 2017 | 50 | (HTL) | 7.2 | 85.60 | [87] | Spiro-OMeTAD (ETL) | 0.8 | 98.40 | | 2018 | 1.45 | (ETL) | 1.04 | 28.28 | [123] | ZnO (ETL) | 1.43 | 1.38 | (ETL) | 0.73 | 49.66 | | 2018 | 8.6 | (ETL) | 2.9 | 66.28 | [51] | (ETL) | 1.2 | 86.05 | | 2019 | 2.12 | (ETL) | 1.27 | 42.53 | [124] | | 2019 | 22.65 | Spiro-OMeTAD (HTL) | 9.59 | 56.92 | [117] | 2mF-X59 (HTL) | 6.63 | 70.22 | 2mF-X59 + F4-TCNQ (HTL) | 4.71 | 79.21 | | 2019 | 4.5 | interlayer (HTL) | 2.21 | 50.89 | [125] | | 2020 | 1.45 | N749 interlayer (HTL) | 0.75 | 48.28 | [118] | | 2018 | 13.7 | (ETL) | 2.4 | 82.48 | [71] | Spiro-OMeTAD (HTL) | 2.6 | 81.02 |
|
Table 3. Summary of the Reported Lifetime with and without Quencher Layer in All-Inorganic Halide Perovskites, Together with the Calculated Transfer Efficiency