• Laser & Optoelectronics Progress
  • Vol. 56, Issue 15, 153001 (2019)
Ran An1, Quanhong Ou1, Gang Liu1、*, Weimei Yang1, Zhiqiu Fu1, Jianmei Li1, and Youming Shi2
Author Affiliations
  • 1 School of Physics and Electronic Information, Yunnan Normal University, Kunming, Yunnan 650500, China
  • 2 College of Physics and Electronic Engineering, Qujing Normal University, Qujing, Yunnan 650011, China
  • show less
    DOI: 10.3788/LOP56.153001 Cite this Article Set citation alerts
    Ran An, Quanhong Ou, Gang Liu, Weimei Yang, Zhiqiu Fu, Jianmei Li, Youming Shi. Surface-Enhanced Raman Spectroscopy of Mushroom Spores[J]. Laser & Optoelectronics Progress, 2019, 56(15): 153001 Copy Citation Text show less
    SEM images of silver nanoparticles with different particle diameters. (a) P1 silver nanoparticles; (b) P2 silver nanoparticles; (c) P3 silver nanoparticles; (d) P4 silver nanoparticles
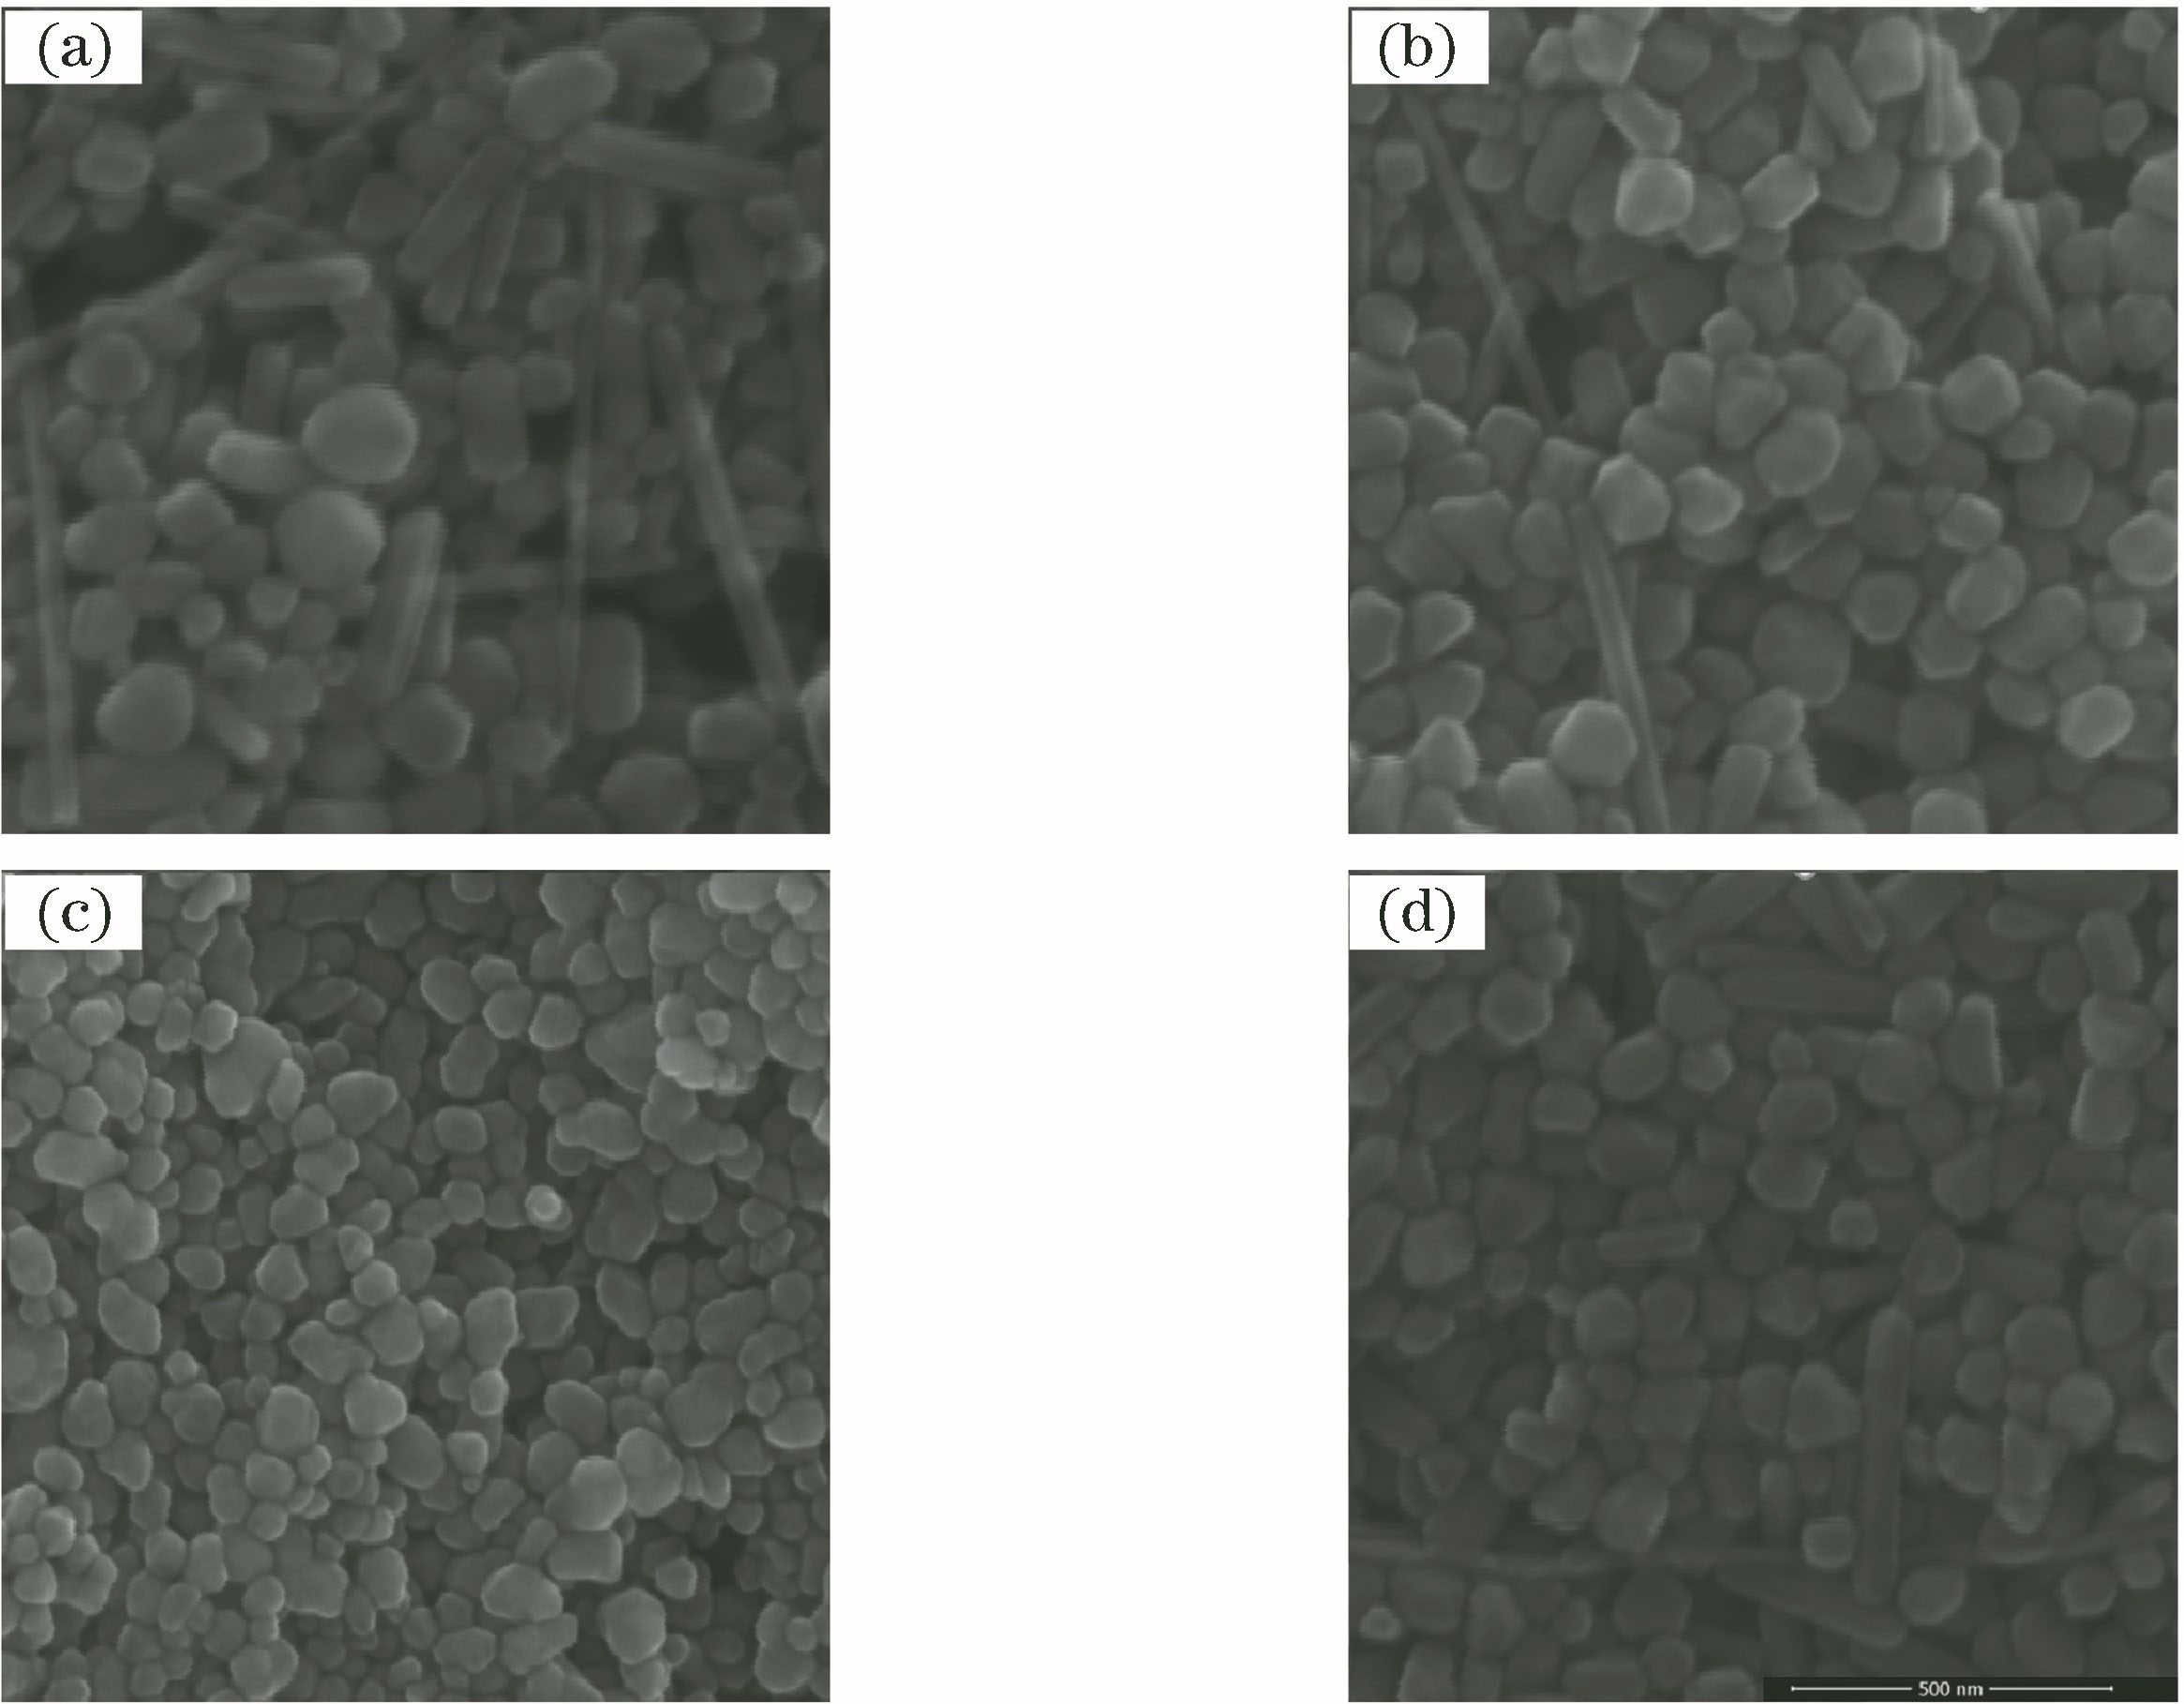
    Fig. 1. SEM images of silver nanoparticles with different particle diameters. (a) P1 silver nanoparticles; (b) P2 silver nanoparticles; (c) P3 silver nanoparticles; (d) P4 silver nanoparticles
    UV-VIS absorption spectrum and size distribution of silver nanoparticles. (a) UV-VIS spectrum of silver nanoparticles; (b) size distribution of silver nanoparticles
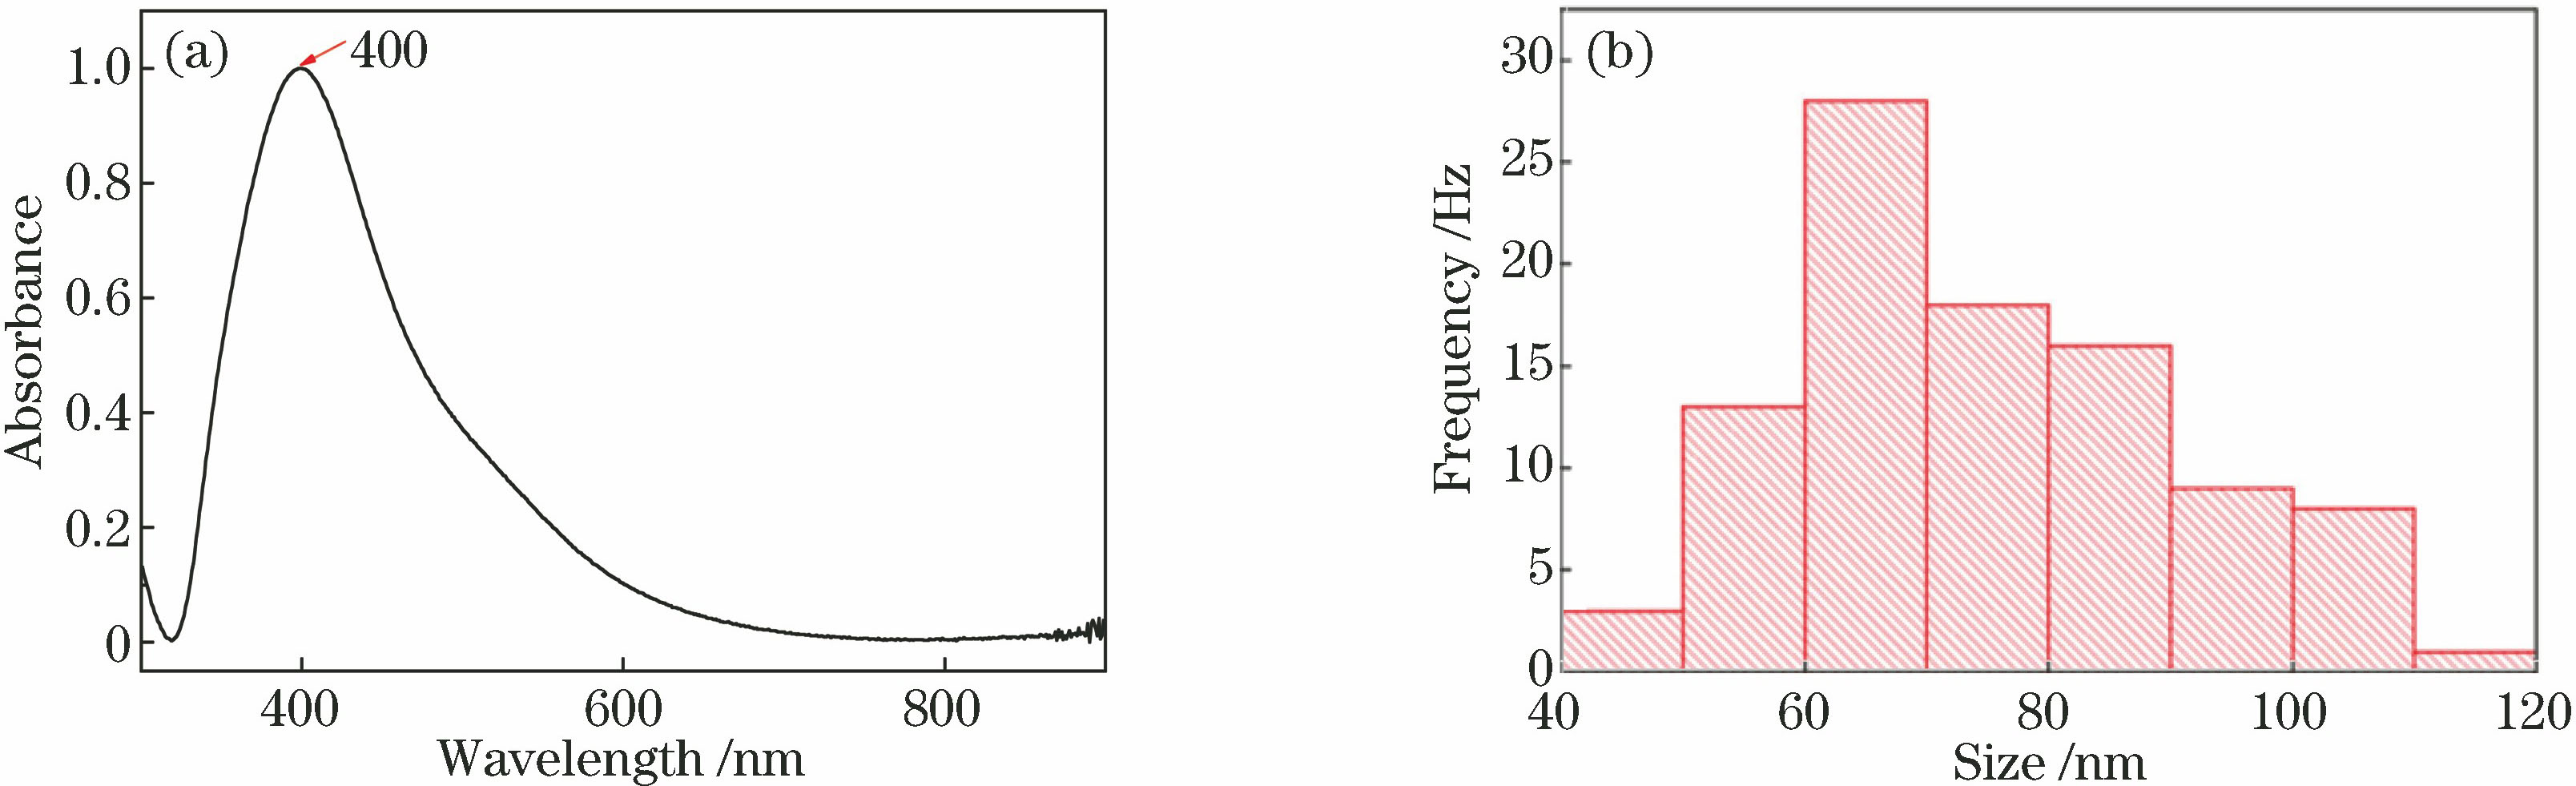
    Fig. 2. UV-VIS absorption spectrum and size distribution of silver nanoparticles. (a) UV-VIS spectrum of silver nanoparticles; (b) size distribution of silver nanoparticles
    Enhancement of silver nanoparticles. (a) SERS of silver nanoparticles with different particle diameters on same concentration of crystal violet; (b) Raman spectra of crystal violet
    Fig. 3. Enhancement of silver nanoparticles. (a) SERS of silver nanoparticles with different particle diameters on same concentration of crystal violet; (b) Raman spectra of crystal violet
    SEM images of PML: (a) PML; (b) surface-enhanced PML; (c) surface silver nanoparticles
    Fig. 4. SEM images of PML: (a) PML; (b) surface-enhanced PML; (c) surface silver nanoparticles
    SEM images of clustered boletus spores with silver colloid. (a) BBP spores; (b) BSF spores; (c) TPS
    Fig. 5. SEM images of clustered boletus spores with silver colloid. (a) BBP spores; (b) BSF spores; (c) TPS
    Raman spectra in range of 1800-450 cm-1. (a) PML; (b) TPS
    Fig. 6. Raman spectra in range of 1800-450 cm-1. (a) PML; (b) TPS
    SERS diagrams of PML and three boletus spores in range of 1800-450 cm-1
    Fig. 7. SERS diagrams of PML and three boletus spores in range of 1800-450 cm-1
    Ran An, Quanhong Ou, Gang Liu, Weimei Yang, Zhiqiu Fu, Jianmei Li, Youming Shi. Surface-Enhanced Raman Spectroscopy of Mushroom Spores[J]. Laser & Optoelectronics Progress, 2019, 56(15): 153001
    Download Citation