• Photonics Research
  • Vol. 10, Issue 1, 21 (2022)
Dewen Cheng1, Jiaxi Duan1、2, Hailong Chen1, He Wang2, Danyang Li1, Qiwei Wang1、2, Qichao Hou1, Tong Yang1, Weihong Hou2, Donghua Wang2, Xiaoyu Chi3, Bin Jiang3, and Yongtian Wang1、*
Author Affiliations
  • 1Beijing Engineering Research Center of Mixed Reality and Advanced Display, School of Optics and Photonics, Beijing Institute of Technology, Beijing 100081, China
  • 2Ned Co., Ltd., Beijing 100081, China
  • 3Goertek Co., Ltd., Weifang 261031, China
  • show less
    DOI: 10.1364/PRJ.440018 Cite this Article Set citation alerts
    Dewen Cheng, Jiaxi Duan, Hailong Chen, He Wang, Danyang Li, Qiwei Wang, Qichao Hou, Tong Yang, Weihong Hou, Donghua Wang, Xiaoyu Chi, Bin Jiang, Yongtian Wang. Freeform OST-HMD system with large exit pupil diameter and vision correction capability[J]. Photonics Research, 2022, 10(1): 21 Copy Citation Text show less
    Layout of the final OST-HMD system. S1 and S2 denote optical surfaces of the 1st auxiliary freeform element E1, S3−S5 denote optical surfaces of the main wedge-shaped prism E2, S6−S10 denote the optical surfaces of two rotationally symmetric lenses E4 and E5, S4′ and S10 denote optical surfaces of the 2nd auxiliary freeform element E5.
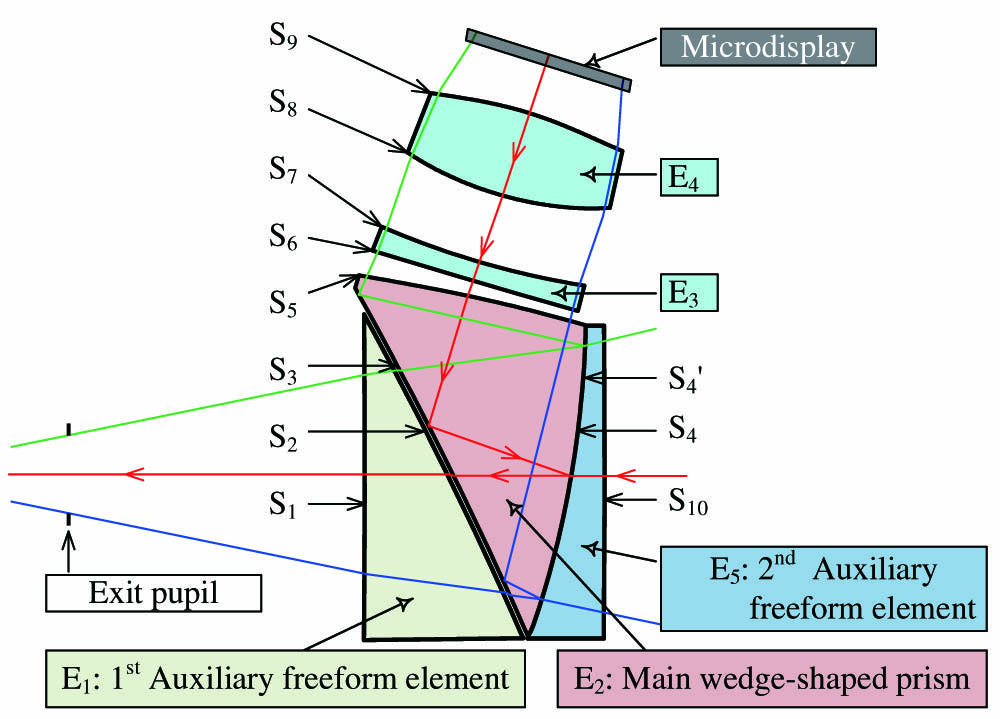
    Fig. 1. Layout of the final OST-HMD system. S1 and S2 denote optical surfaces of the 1st auxiliary freeform element E1, S3S5 denote optical surfaces of the main wedge-shaped prism E2, S6S10 denote the optical surfaces of two rotationally symmetric lenses E4 and E5, S4 and S10 denote optical surfaces of the 2nd auxiliary freeform element E5.
    Optical paths of the rays of different object fields. R1 is the upper marginal ray of the maximum Y-direction field, and R2′ is the lower marginal ray of the minimum Y-direction field. Pa0−Pa3 are the intersection points of ray R2′ and surfaces. Pb0−Pb2 are the intersection points of ray R2′ and surfaces. Y1 and Y2 are straight lines coinciding with marginal rays.
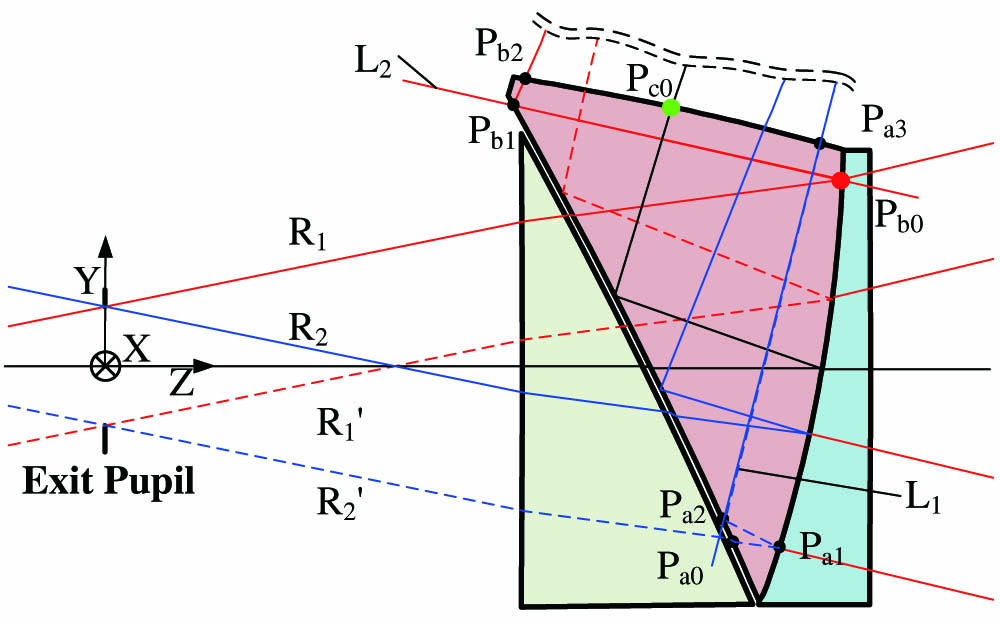
    Fig. 2. Optical paths of the rays of different object fields. R1 is the upper marginal ray of the maximum Y-direction field, and R2 is the lower marginal ray of the minimum Y-direction field. Pa0Pa3 are the intersection points of ray R2 and surfaces. Pb0Pb2 are the intersection points of ray R2 and surfaces. Y1 and Y2 are straight lines coinciding with marginal rays.
    Schematic diagram of JMRCC basic principle, wherein L is a line defined by point A of a reference ray intersected on specified surface and its direction of propagation after the surface, and P is another point formed by another specified reference ray and surface.
    Fig. 3. Schematic diagram of JMRCC basic principle, wherein L is a line defined by point A of a reference ray intersected on specified surface and its direction of propagation after the surface, and P is another point formed by another specified reference ray and surface.
    Diopter adjustment diagram of freeform prism OST-HMD. (a) Traditional diopter adjustment scheme, where additional lens was added between human eye and prism. (b) Correct hyperopia through auxiliary prism with convex S1. (c) Correct myopia through auxiliary prism with concave S1.
    Fig. 4. Diopter adjustment diagram of freeform prism OST-HMD. (a) Traditional diopter adjustment scheme, where additional lens was added between human eye and prism. (b) Correct hyperopia through auxiliary prism with convex S1. (c) Correct myopia through auxiliary prism with concave S1.
    Schematic diagram of distortion control. (a) For rotational symmetry system, radial distance of hreal and hideal affects the distortion ratio. (b) For the off-axis system, radial and tangential distances of Preal and Pideal affect the distortion ratio.
    Fig. 5. Schematic diagram of distortion control. (a) For rotational symmetry system, radial distance of hreal and hideal affects the distortion ratio. (b) For the off-axis system, radial and tangential distances of Preal and Pideal affect the distortion ratio.
    Distortion grids of the previous system and present system. (a) Distortion grid of the previous virtual image light path, maximum ratio is 12% [26]. (b) Distortion grid of the previous see-through path, maximum ratio is 1.4%. [26]. (c) Distortion grid of the present virtual image light path, maximum ratio is 0.6% without anamorphosis. (d) Distortion grid of the present see-through path, the maximum ratio is 0.4% without anamorphosis.
    Fig. 6. Distortion grids of the previous system and present system. (a) Distortion grid of the previous virtual image light path, maximum ratio is 12% [26]. (b) Distortion grid of the previous see-through path, maximum ratio is 1.4%. [26]. (c) Distortion grid of the present virtual image light path, maximum ratio is 0.6% without anamorphosis. (d) Distortion grid of the present see-through path, the maximum ratio is 0.4% without anamorphosis.
    See-through MTF plot of the previous and present systems. (a) MTF plot of previous design in Ref. [26], the value is higher than 0.4 for most fields at 50 lp/mm. (b) MTF plot of present design, the value is higher than 0.9 for all fields at 50 lp/mm.
    Fig. 7. See-through MTF plot of the previous and present systems. (a) MTF plot of previous design in Ref. [26], the value is higher than 0.4 for most fields at 50 lp/mm. (b) MTF plot of present design, the value is higher than 0.9 for all fields at 50 lp/mm.
    (a) Error function variation curve. (b) Final optical layout of the OST-HMD.
    Fig. 8. (a) Error function variation curve. (b) Final optical layout of the OST-HMD.
    MTF plot of the optical system. (a) The MTF plot before automatic balancing, MTF value is higher than 0.18 at 50 lp/mm for all fields. (b) The MTF plot after automatic balancing, MTF value is higher than 0.4 at 50 lp/mm for all fields.
    Fig. 9. MTF plot of the optical system. (a) The MTF plot before automatic balancing, MTF value is higher than 0.18 at 50 lp/mm for all fields. (b) The MTF plot after automatic balancing, MTF value is higher than 0.4 at 50 lp/mm for all fields.
    MTF plots for different eye positions. (a) MTF plot when eye locates in center of eyebox. (b) MTF plot when human eye moves 2.5 mm to the right. (c) MTF plot when human eye moves up 2.5 mm.
    Fig. 10. MTF plots for different eye positions. (a) MTF plot when eye locates in center of eyebox. (b) MTF plot when human eye moves 2.5 mm to the right. (c) MTF plot when human eye moves up 2.5 mm.
    Probable change of MTF value with four different cumulative probabilities for overall tolerance analysis using tolerances values listed in Table 4. F1–F25 denote the sampled fields the same as in Fig. 9.
    Fig. 11. Probable change of MTF value with four different cumulative probabilities for overall tolerance analysis using tolerances values listed in Table 4. F1–F25 denote the sampled fields the same as in Fig. 9.
    Components and prototype of the optical system. (a) Exploded view showing all elements of the system. (b) Overall appearance of the prototype.
    Fig. 12. Components and prototype of the optical system. (a) Exploded view showing all elements of the system. (b) Overall appearance of the prototype.
    Testing results of the optical prototype. (a) The input image displayed in microdisplay when testing the performance of the system. (b) Output image captured by camera at exit pupil of the system. (c) The result of fusion of virtual cup and real cup.
    Fig. 13. Testing results of the optical prototype. (a) The input image displayed in microdisplay when testing the performance of the system. (b) Output image captured by camera at exit pupil of the system. (c) The result of fusion of virtual cup and real cup.
    Table 1. Comparison of Four OST-HMD Optical Solutions
    Table 2. Specifications of Different Freeform Prisms
    ParameterSpecification
    Active display area15.8mm×9.0mm
    Resolution1920×1080  pixels
    Effective focal length (EFL)21.6 mm
    Exit pupil diameter (EPD)12mm×8mm
    Eye relief (ERF)18 mm
    F/#1.8
    Lens typeFreeform prisms+lenses
    Wavelength486.1–656.3 nm
    Field of view (FOV)45.3° (diagonal)
    Virtual image distortiona0.6%
    See-through distortionb0.4%
    Modulation transfer function (MTF)40% at 50 lp/mm for all fields
    Table 3. Overall Parameter Requirements of the System
    Tolerance TypeLocationValueUnit
    DLT–thickness deltaS1, S3500μm
    DLT–thickness deltaS240μm
    DLT–thickness deltaS4S920μm
    DLN–refractive index deltaE1E40.001
    DLV–V-number deltaE1E40.005
    DLX–surface X-displacementS3, S5, S95μm
    DLX–surface X-displacementS6, S1010μm
    DLX–surface X-displacementS1,S2, S4, S725μm
    DLY–surface Y-displacementS3, S5, S95μm
    DLY–surface Y-displacementS6, S1010μm
    DLY–surface Y-displacementS1,S2, S4, S725μm
    DLZ–surface Z-displacementS5, S6, S95μm
    DLZ–surface Z-displacementS2S4, S710μm
    DLZ–surface Z-displacementS1, S1020μm
    DLA–surface alpha tiltS2S60.3mrad
    DLA–surface alpha tiltS70.5mrad
    DLA–surface alpha tiltS1, S9, S101mrad
    DLB–surface beta tiltS2S60.3mrad
    DLB–surface beta tiltS70.5mrad
    DLB–surface beta tiltS1, S9, S101mrad
    DLG–surface gamma tiltS3, S50.5mrad
    DLG–surface gamma tiltS1,S2, S4, S6S105mrad
    DLS–delta sag at clear apertureS2S62μm
    DLS–delta sag at clear apertureS74μm
    DLS–delta sag at clear apertureS1, S9, S108μm
    DSR–surface roughness errorS1S105μm
    Table 4. Tolerance Items
    Dewen Cheng, Jiaxi Duan, Hailong Chen, He Wang, Danyang Li, Qiwei Wang, Qichao Hou, Tong Yang, Weihong Hou, Donghua Wang, Xiaoyu Chi, Bin Jiang, Yongtian Wang. Freeform OST-HMD system with large exit pupil diameter and vision correction capability[J]. Photonics Research, 2022, 10(1): 21
    Download Citation