Che XU, Lin MENG, Yong YIN, Liang-Jie BI, Zhi-Wei CHANG, Hai-Long LI, Bin WANG. Analysis of oscillation-starting characteristics in millimeter wave extended interaction oscillators[J]. Journal of Infrared and Millimeter Waves, 2021, 40(5): 627
Copy Citation Text
The investigations of the oscillation-starting characteristics of a ladder-type RF circuit are proposed to overcome the limitation of high ohmic loss for development of millimeter-wave extended interaction oscillators (EIOs). Based on PIC-simulations, quantitative calculations and theoretical analyses, the designed and fabricated W-band EIO is proved to have the possibility of greatly reducing the oscillation-starting current. By optimizing five aspects including the gap number, cavity dimension, field distribution, operation voltage, and surface loss, the oscillation-starting current of the EIO can be reduced to 0.43 A with a beam voltage of 17.5 kV. According to cold test experiment, the output power attenuation is analyzed and predicted.
Millimeter wave extended interaction devices(EIDs),including extended interaction oscillators(EIOs)and extended interaction klystron amplifiers(EIKAs),are attractive for many applications because of the requirement in the fields of plasma diagnosis,material science,spectroscopy and commerce [1-3]. EID uses the rectangular ladder-type resonant slow wave structure(SWS)as beam wave interaction,which has the characteristics of both slow wave structure and resonant cavity. Thus,EIDs have great advantages in miniaturization,high frequency and high-power generation [4-11]. At present,the products of EIOs manufactured by Communications & Power Industries can commercially reach several kilowatts to tens of kilowatts in the millimeter wave band,while the output power in the THz band is only several watts to tens of watts. [12,13].
The high power and high efficiency EIO is so attractive that it is widely studied because it can provide more efficient beam-wave interaction(this can be embodied by the relatively large value of R/Q)while ensuring the same current density as the conventional klystron oscillators. Since its electric field coupling form is similar to a TE10 wave which is transmitted to the coupling cavity through a rectangular gap [10],the frequency of EIO mainly depends on the gap structure parameters. In other words,the cutoff frequency of 2π mode is determined by gx,as shown in Fig. 1. At millimeter and sub-millimeter wave band,the achievable output power of the conventional O-type vacuum electronic devices(VEDs),including EIDs,is greatly limited by the beam current and voltage across the devices. At this stage,with the intensification of the research on high frequency up to THz band,the surface current loss of the device has increased significantly along with the sharp decline in skin depth. Under such circumstance,the threshold of EID oscillation starting condition is further raised. Therefore,based on a certain cathode current,a lower oscillation-starting threshold is required for developing higher frequency EIDs.
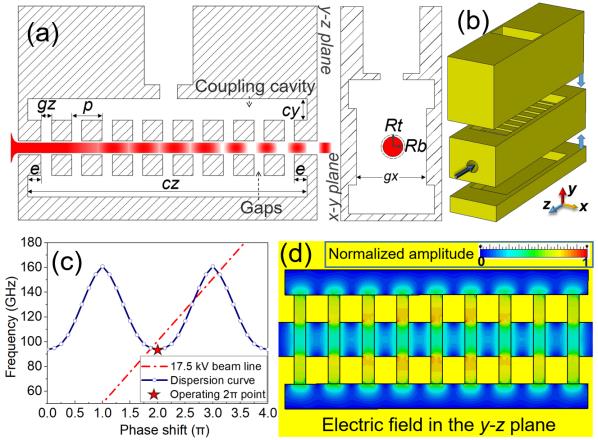
Figure 1.(a),(b)Layout of the EIO circuit.(c)Dispersion diagram of the EIO and(d)the electric distribution of the operation 2π mode.
With its inherent characteristics of high coupling impedance R/Q[4,14],high-frequency EIO provides favorable conditions for obtaining lower oscillation start-up conditions among VEDs. In this paper,we analyzed the oscillation start-up characteristics of a W-band EIO based on CST Microwave Studio [15] simulations and cold test experiments. Firstly,the structural composition,high-frequency and dispersion characteristics of the specific-designed W-band EIO are introduced. Secondly,based on the small signal theory,the quantitative study of starting current in a millimeter wave EIO is introduced. In this aspect,the accuracy of oscillation-starting current is validated by both PIC-simulation codes and the quantitative calculations(in Sec. III). Thirdly,based on the influences of five factors(Influences of gap number,cavity dimension,field distribution,operation voltage,and surface loss)related to the initial conditions of oscillation-starting directly,the circuit oscillation start-up principle is studied analytically and simulatively. Particularly,the oscillation start-up analyses of high-frequency characteristics provide a feasible method to directly overcome the limitations of high ohmic loss and high start-up standards in high-frequency band and even terahertz.
1 Description of the designed EIO circuit
The structure of the designed EIO circuit,as shown in Fig. 1(a),mainly consists of nine ladder-like interaction gaps,one 0.7 mm-diameter beam tunnel and two 2.20*0.50*6.74 mm coupling cavities distributed on both sides of the SWS. The period p of 0.76 mm determines the electron transit velocity,which is directly related to the operation voltage. The gap dimensions gx and gz are 1.8 mm and 0.26 mm respectively. For manufacturing requirements,the SWS can be split into three parts across the x-z plane on both sides of the coupling gaps(Fig. 1(b)). The UV-LIGA technique [16] or Nano-CNC machining technology [17] can be used to fabricate each part.
Among O-type devices,the operating mode of the rectangular resonator cavity is TM mode. In high frequency band,over-mode structures have received increasing attention,because they can reduce the machining difficulty and increase the power capacity. However,they also inevitably weaken the beam-wave interaction because of the smaller coupling coefficient M and the coupling impedance R/Q[18,19]. The R/Q can be expressed as
,
which is a measure of the Ez field acting on the electrons for a given total stored energy(Ws)and angular frequency(w).
Here,we choose the fundamental TM110-like mode scheme as the research object to take advantage of its superior high frequency characteristics in the aspect of oscillation starting. The dispersion curve and electric field distribution of the fundamental 2π mode are shown in Fig. 1(c)and Fig. 1(d),respectively. As shown in Fig. 1(c),the beam voltage should be slightly higher than the 2π operating point to meet the synchronization condition of EIO,which is that electron velocity ve is slightly greater than phase velocity vp. When the EIO works in the 2π mode,the electric field with periodic standing wave distribution(Fig. 1(d))can effectively modulate the electron beam.
2 Oscillation-starting condition and high frequency characteristics
A distinguishing and important feature of an oscillator is that there exists a definite minimum electron beam current value,below which the resonant cavity will not oscillate. When considering the beam loading in the circuit,the normalized beam-loading conductance ge(or the beam-loading conductance Ge)is the key factor to discuss the oscillation or amplification. The ge satisfies the resonance condition only when the value is negative. In this state,the energy exchange between the electron beam and the electric field makes the electron energy flow to the circuit,thus establishing the stable electric field. Based on the one-dimensional linear theory,the starting current(Ist)[20,21]of EID cavity can be derived from:
,
The parameter U is the operation voltage. The a of 0.5 is the empirical correction factor,which is related to the operation frequency and surface roughness. According to the small signal theory of klystron,the general derivation of small signal normalized beam-loading conductance ge with space-charge is given by [21]:
,
where the G0 stands for the DC beam conductance,I0/U0. The βe=ω/ve and βq= ωq/ve are the propagation constants of the DC beam and reduced plasma respectively. The ω is the RF radian frequency,the ωq is the reduced-plasma angular frequency and ve is the DC beam velocity. The coupling coefficient M can be obtained by:
.
the loaded quality factor Ql can be obtained from:
.
The Q0 and Qe are inherent quality factor and external quality factor,respectively. Where Qb is the beam-loaded quality factor [21],which can be determined by the equation:
.
Generally,the oscillation-starting condition of an EIO circuit is determined by many factors such as the structural parameters,beam voltage U,and the electromagnetic field distribution. These factors collectively affect the resonant starting condition and can be characterized by the Ist,which can be derived from Eq.(2).
2.1 Influences of the gap number Ng on the oscillation characteristics
Among the structural parameters,the number of gaps Ng in the EIO structure should be considered first. The Ng plays a direct effect on the interaction ability of EIDs. As shown in Fig. 2(a)and Fig. 2(b),in quantitative analysis,it affects the values of M2R/Q and normalized beam-loading conductance ge. Fig. 2(a)shows the curve of M2R/Q with voltage in the cases of 5-11 gaps. It can be concluded that the increase of Ng will enlarge the values of M2R/Q and negative-maximum ge. While the corresponding abscissa voltage value will change inevitably. The characteristic parameters of this EIO,such as inherent quality factor Q0,external quality factor Qe,R/Q,M2R/Q and frequency separation Δf,change with the number of gaps as shown in Table 1. Among these parameters,the increasement of Ng can most effectively raise the value of R/Q. The energy exchange of beam-wave interaction is proportional to R/Q. An EIO cavity possess the shorted slow-wave structure terminal,which has superior in enlarging the value of R/Q[14]. However,the upper limit of Ng does exist:Firstly,when the number of gaps increases,the length of the circuit will become longer,which may cause the over-bunching effect [20]. In this case,a part of electrons regain energy from the electric field at the end of the circuit,thus reducing the interaction efficiency. Secondly,in the condition of over-amount gap number,the sudden decrease of the frequency interval Δf between adjacent modes makes it easier for the competing modes to be excited. In conclusion,an extended interaction cavity should not have too small frequency separation nor undersized R/Q. As a result of the tradeoff between the interaction ability and mode-competition of the structure,the nine-gap EIO structure is the most appropriate. In addition,in order to obtain the minimum start-up current,the beam voltage of 17.5 kV corresponding to the maximum value of -ge was adopted(which derives from Fig. 2(b)and Eq.(3)).
Figure 2.The(a)M2R/Q and the(b)normalized beam-loading conductance variations with the beam voltage in the cases of 5-11gaps.
2.2 Influences of the cavity structure on the oscillation characteristics
An important feature of the extended interaction oscillator is the coupling cavity distributed on both sides of the periodic grating,which determines the frequency selection and affects various cavity characteristics. Among the parameters,the cavity height cy plays a decisive role in the circuit characteristics of the EIO. Fig. 3(a)shows the operating frequency,oscillation-starting time Ts and radiation power versus the vertical dimension of the coupling cavity cy. As an electron beam of 17.5 kV and 0.8 A is injected,the output power Pout of up to 908 W and a -3dB mechanical width of 0.40-0.53 mm was observed. There is a sharp decline of the Pout beyond the -3dB mechanical width,which is caused by the change of circuit characteristic parameters.
Figure 3.(a)Output radiation power,operating frequencies,and oscillation-starting time versus cy.(b)Three-dimensional PIC simulation results:the 2D variation of output power relative to cy and the emission current.
When studying the initial state of oscillation characteristics,the traditional one-dimensional parameter-sweep is not enough to fully reflect the influence of characteristic parameters on the output characteristics. In order to observe the influence of cavity structure on the oscillation-starting conditions,the 2D variation of output power relative to cy and the emission current was calculated more than 100 times,as shown in Fig. 3(b). It can be found from Fig. 3(b)that the Ist of the EIO(which is 0.42 A)is relatively low at a cy of 0.5 mm. When the value of cy deviates from 0.5 mm,the Ist shows a parabolic-like increase trend. Generally,when the simulated oscillation starting current(Ists)is relatively low,the beam-wave energy transfer efficiency is relatively high,but a low starting current does not equal to high efficiency absolutely. For comparing with the theoretical value,we take three typical cy models with different values of cy. According to simulation and calculation results,their corresponding R/Q,loaded quality factor Ql,-ge,and theoretical starting current(Istt)values are shown in Table 2. Compared with the Model 1 and 3 in Table 2,the Model 2 has higher Ql,which means it has stronger frequency selectivity and higher cavity energy storage,and also can provides favorable conditions to achieve the initial state of oscillation. In Table 2,the theoretical Istt obtained by Eq.(2) is basically consistent with the PIC-simulation value Ists. Besides,compared with the Model 1 and 3,the Model 2 has the lower theoretical Istt,which agrees well with the simulation trend in Fig. 3(b).
Model
cy(mm)
R/Q
Ql
-ge
Istt(A)
Ists(A)
1
0.4
548.58
230.51
0.077
0.90
0.70
2
0.5
541.86
407.87
0.096
0.41
0.43
3
0.6
512.15
273.78
0.087
0.72
0.80
Table 2. Circuit characteristic parameters versus cavity height
2.3 Influences of field distribution on the oscillation characteristics
The electric field distribution of the 2π mode in the EIO mainly depends on the length of the extended section e of the coupling cavity [22]. Fig. 4(a)shows the relationship between the output characteristics and e when a cylindrical electron beam with 17.5 kV and 0.8 A is injected. When e is less than 0.4 mm,the output power is maintained around 800W,as shown in the Fig. 4(a). However,when e is greater than 0.4 mm,there is a sharp decline in output power and frequency,which will negatively affect the output characteristics of the EIO. We found that in the aspects of the coupling strength and output characteristics,there is an associate relationship between the field structure and the output structure. As shown in Fig. 4(b),as e increases,the axial electric field of the structure has a suppressing effect from the middle to both sides. As shown in Fig. 1 previously,owing to the output structure of the EIO which is located above the middle of the coupling cavity,the mismatched electric field distribution will suppress the field coupling.
Figure 4.(a)Output radiation power,operating frequencies,and oscillation-starting time versus e.(b)The distributions of Ez field along the center line of the beam tunnel with the increase of e.
This mismatch is manifested in the decline of the values of R/Q and Q0,as shown in the Table. 3. Therefore,the distribution of electric field should accord with the coupling of output structure. Based on the previous analysis,the e of this EIO was determined to be 0.2 mm.
Model
e(mm)
cz (mm)
R/Q(Ω)
Q0
1
0.2
6.74
542.86
811.22
2
0.4
7.14
563.28
796.25
3
0.6
7.54
441.30
786.65
Table 3. Characteristics of the different cavity dimensions on z-zxis
2.4 Influences of operation voltage on the oscillation characteristics
According to Eq.(2),the operation voltage U has a linear correlation with the starting current. However,in the process of voltage variation,the -ge and R/Q will also change accordingly as shown in Fig. 2 previously. Therefore,the design selection of operating voltage will have a direct impact on determining the oscillation start-up conditions.
In this section,three emission models(in Table. 4)with different voltages are simulated and calculated. As the voltage increases,the voltage line in the dispersion curve in Fig. 2(c)will gradually deviate from the 2π mode point,which is conducive to the bunching effect of the electron beam,and the electron efficiency will increase accordingly. Fig. 5 shows the output characteristics of the EIO circuit at 17.5,18.0,18.4 kV. When the electron beam current is 0.8 A,their output power are 786 W,934 W and 1100 W,respectively. However,in addition to the increased electronic energy conversion efficiency,the increased U makes the Ist of the circuit have an increasing trend,and the parameters are shown in Table 4. This trend is mainly embodied in the variation of the -ge. When the ge is negative,the slow wave phase velocity is lower than the electron beam phase velocity,and the beam wave interaction causes the electron beam energy to flow into the electric field. For high frequency extended interaction structures,a relatively high absolute value of ge is beneficial to reduce the starting current. Accordingly,the Model 1 in Table. 4 has lower oscillation-starting threshold than the Model 2 and 3. In Table 4,the theoretical value Istt and the simulated value Ists show a consistent increasing trend. Therefore,in terms of voltage selection,the rules of high efficiency and low start-up current cannot be followed at the same time. The trade-off between them is essential. In order to facilitate the oscillation-starting of the circuit,the emission model with an operation voltage of 17.5 kV is adopted.
Model
U(kV)
-ge
Istt(A)
Ists(A)
1
17.5
0.096
0.41
0.42
2
18.0
0.087
0.47
0.52
3
18.4
0.077
0.54
0.70
Table 4. Characteristics of the different operating voltage
Figure 5.The circuit output characteristics versus operation current when U is(a)17.5,(b)18.0 and(c)18.4 kV respectively. The oscillation-starting condition is characterized by comparing the output power Pout,starting time Ts and operation frequency f of the EIO circuit.
Due to the influence of surface roughness and impurity doping,the S-parameters obtained in the cold measurement experiment usually do not fully conform to the simulation results. Among VEDs,this inconsistency can be represented by the decrease of conductivity [22,23]. Fig. 6 shows the fabricated EIO circuit and the cold measured reflection coefficient S11. The input-output waveguide and a vector network analyzer are connected by standard 3mm flange to obtain the S11. The amplitude and frequency of the S11 coefficient measured in the cold test experiment are -9.13 dB and 94.47 GHz,respectively,which are attenuated compared with -19.71 dB and 94.53GHz in the simulation(Model 1,Fig. 6(b)). When the conductivity decreases to 1.6×10⁷ S/m,the frequency and amplitude of S11 in experiments and simulations are basically consistent. It can be concluded from the Fig. 6(b)that there is an additional ohmic loss caused by the surface roughness in the fabricated EIO circuit,which can accordingly reduce the power capacity and radiation power of the circuit. From the experimental monitored S11,the measured value of Ql is 346.50,which can be derived from
.
Figure 6.(a)The fabricated copper EIO structure.(b)Measured values of reflection parameter S11 and simulated values at conductivities of 1.6e7 S/m and 5.8e7 S/m.
Compared with the simulated Ql of 407.87,this attenuation can be embodied in the increased correction factor a. Where the 2Δfb is the -3 dB bandwidth of the measured S11.
Correspondingly,the output characteristics of the circuit with the change of conductivity are simulated,as shown in Fig. 7. The reduction in S11 shown previously in Fig. 6(b)is essentially a reduction in power capacity. Therefore,the deviation between the cold-test result and the simulation result can be used to correct the simulation results and make predictions for the hot-test experiments. Then as shown in Fig. 7,the output power in the PIC simulation has also been reduced from 859 W to 471 W. From the above analysis,the accuracy of fabrication also has a significant impact on the oscillation start-up condition,and the weakened electric field may not be sufficient to achieve the condition.
Figure 7.Output radiation power,operating frequencies,and oscillation-starting time versus conductivity.
In summary,the oscillation-starting characteristics of a W-band EIO are analyzed theoretically and experimentally(cold test). Firstly,this paper expounds the starting characteristics of EIO circuit by analyzing the relationship between mode,dispersion,and high frequency characteristics. Secondly,the influences of structural parameters,field distribution,operation voltage,and ohmic loss on the oscillation-starting condition are analyzed through the high frequency characteristic parameters of the circuit. Thirdly,based on the small signal theory,the accuracy of oscillation-starting current is validated by both simulation and cold-test measurement.
This will provide an effective reference for the further research on the oscillation-starting condition of the high-power and high-efficiency EIKs at high frequency band and even terahertz. Further demonstration is ongoing and we plan to reduce the threshold of oscillation initiation by reducing losses to meet the low current hot test experiments.
[3] Z C WANG, X W SHANG, L L CAO et al. Investigation on a W-band high efficiency extended interaction oscillator based on phase re-synchronization technology. Journal of Infrared and Millimeter Waves, 39, 211-20(2020).
[9] D CHERNIN, A BURKE, I CHERNYAVSKIY et al. 12.3: Extended Interaction Klystrons for terahertz power amplifiers; proceedings of the In Proc IEEE International Vacuum Electronics Conference, F(2010).
Che XU, Lin MENG, Yong YIN, Liang-Jie BI, Zhi-Wei CHANG, Hai-Long LI, Bin WANG. Analysis of oscillation-starting characteristics in millimeter wave extended interaction oscillators[J]. Journal of Infrared and Millimeter Waves, 2021, 40(5): 627