• Chinese Optics Letters
  • Vol. 19, Issue 12, 121407 (2021)
Yeguang Yan1、2, Gang Liu1、2、3, Haixiao Lin2, Kaifeng Yin1、2, Kun Wang1、2, and Jixi Lu2、3、*
Author Affiliations
  • 1School of Instrumentation and Optoelectronic Engineering, Beihang University, Beijing 100191, China
  • 2Beihang Hangzhou Innovation Institute Yuhang, Hangzhou 310023, China
  • 3Research Institute for Frontier Science, Beihang University, Beijing 100191, China
  • show less
    DOI: 10.3788/COL202119.121407 Cite this Article Set citation alerts
    Yeguang Yan, Gang Liu, Haixiao Lin, Kaifeng Yin, Kun Wang, Jixi Lu. VCSEL frequency stabilization for optically pumped magnetometers[J]. Chinese Optics Letters, 2021, 19(12): 121407 Copy Citation Text show less
    Schematic of the experimental apparatus. CL, collimating lens; BS, beam splitter; λ/4, quarter wave plate; PD, photodetector; OPM, optically pumped magnetometer; PID, proportional-integral-differential module.
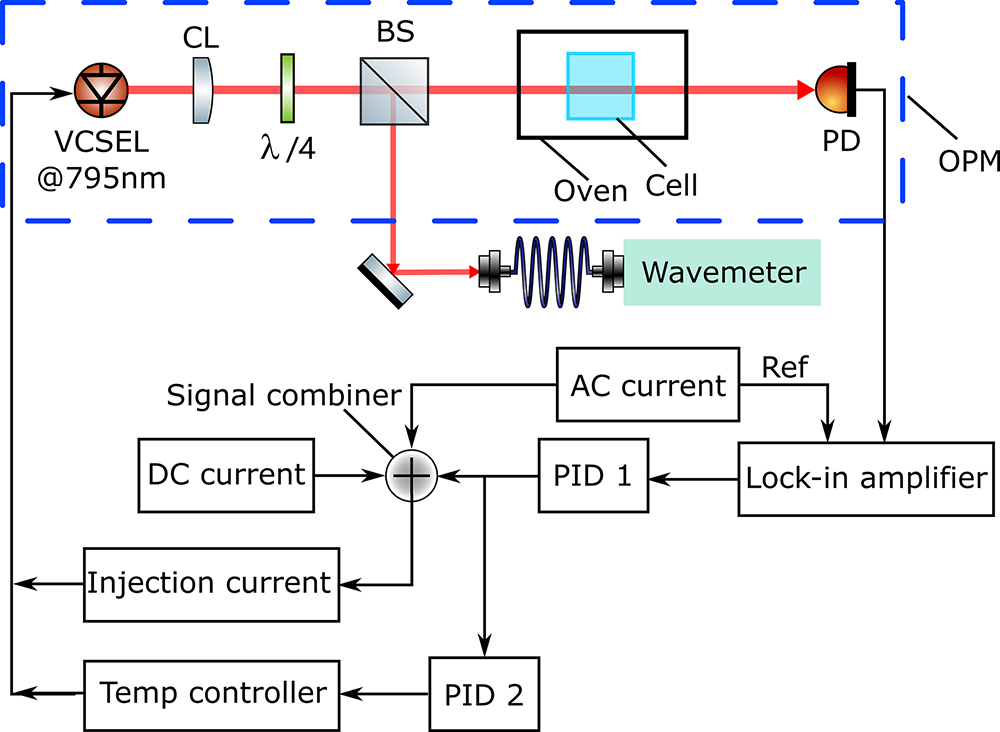
    Fig. 1. Schematic of the experimental apparatus. CL, collimating lens; BS, beam splitter; λ/4, quarter wave plate; PD, photodetector; OPM, optically pumped magnetometer; PID, proportional-integral-differential module.
    VCSEL properties. (a) Intensity tuning of the VCSEL can be obtained by changing the injection current. The injection current tuning coefficient is 391.9 µW/mA. (b) The tuning coefficient is 224 GHz/mA at 47.5°C and 29.4 GHz/K at 1.8 mA.
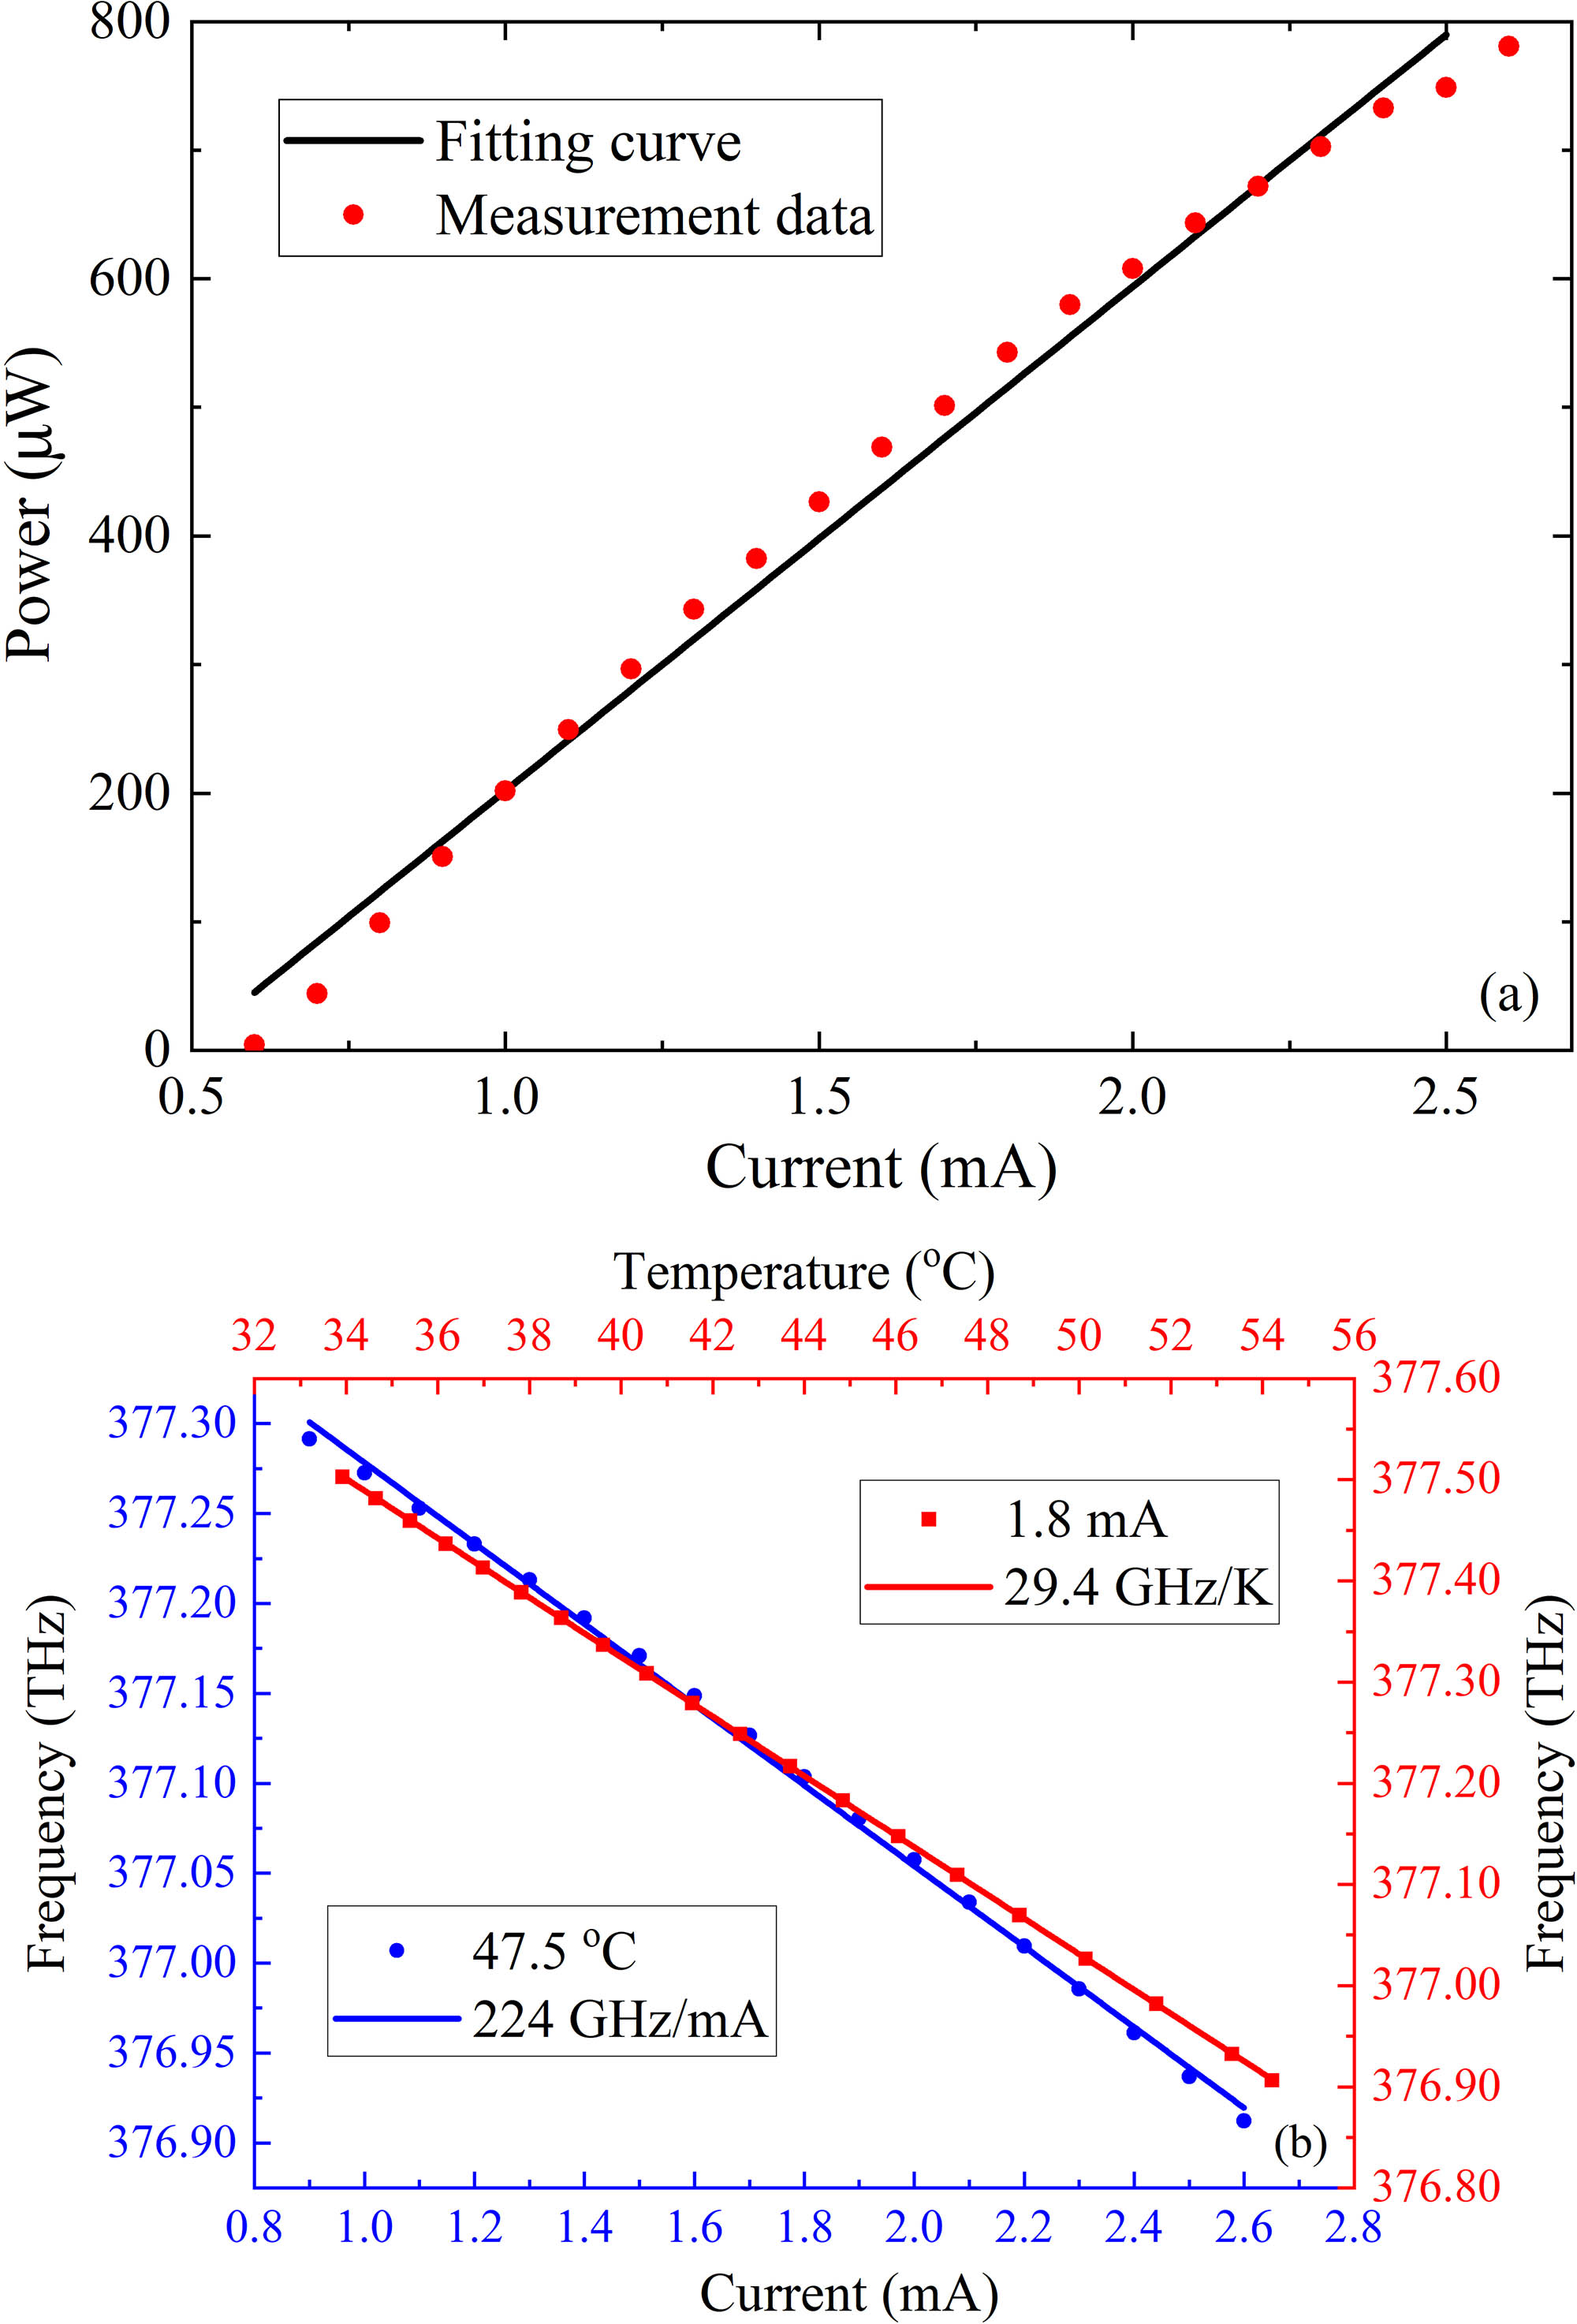
    Fig. 2. VCSEL properties. (a) Intensity tuning of the VCSEL can be obtained by changing the injection current. The injection current tuning coefficient is 391.9 µW/mA. (b) The tuning coefficient is 224 GHz/mA at 47.5°C and 29.4 GHz/K at 1.8 mA.
    Absorption and dispersion curves (black and red lines, respectively). The vertical axis indicates the detection signal strength, and the horizontal axis represents the laser frequency detuning.
    Fig. 3. Absorption and dispersion curves (black and red lines, respectively). The vertical axis indicates the detection signal strength, and the horizontal axis represents the laser frequency detuning.
    Frequency shift as estimated by the wavemeter. The frequency shift rates under the free-running (black line), single-closed-loop (blue line), and double-closed-loop (red line) modes are 328.7, 19.0, and 12.5 MHz/h, respectively.
    Fig. 4. Frequency shift as estimated by the wavemeter. The frequency shift rates under the free-running (black line), single-closed-loop (blue line), and double-closed-loop (red line) modes are 328.7, 19.0, and 12.5 MHz/h, respectively.
    Allan deviation calculated for three data sets under three running modes. The black, blue, and red lines represent the open-loop, single-closed-loop, and double-closed-loop modes, respectively.
    Fig. 5. Allan deviation calculated for three data sets under three running modes. The black, blue, and red lines represent the open-loop, single-closed-loop, and double-closed-loop modes, respectively.
    Light intensity noise in the time domain exposed to Gaussian white noise. The standard deviation is 1.5 and 0.24 mV under the free-running and single-closed-loop modes, respectively.
    Fig. 6. Light intensity noise in the time domain exposed to Gaussian white noise. The standard deviation is 1.5 and 0.24 mV under the free-running and single-closed-loop modes, respectively.
    NSD of the intensity exposed to Gaussian white noise. The black, blue, and red lines are the free-running, single-closed-loop, and double-closed-loop modes, respectively. The VCSEL intensity noises under the free-running, single-closed-loop, and double-closed-loop modes are approximately 1 × 10⁻⁴, 1 × 10⁻⁵, and 7 × 10⁻⁶ V/Hz1/2, respectively.
    Fig. 7. NSD of the intensity exposed to Gaussian white noise. The black, blue, and red lines are the free-running, single-closed-loop, and double-closed-loop modes, respectively. The VCSEL intensity noises under the free-running, single-closed-loop, and double-closed-loop modes are approximately 1 × 10⁻⁴, 1 × 10⁻⁵, and 7 × 10⁻⁶ V/Hz1/2, respectively.
    Intensity NSD under the three running modes. The black, blue, and red lines represent the free-running, single-closed-loop, and double-closed-loop modes, respectively.
    Fig. 8. Intensity NSD under the three running modes. The black, blue, and red lines represent the free-running, single-closed-loop, and double-closed-loop modes, respectively.
    Yeguang Yan, Gang Liu, Haixiao Lin, Kaifeng Yin, Kun Wang, Jixi Lu. VCSEL frequency stabilization for optically pumped magnetometers[J]. Chinese Optics Letters, 2021, 19(12): 121407
    Download Citation