
Yeguang Yan, Gang Liu, Haixiao Lin, Kaifeng Yin, Kun Wang, Jixi Lu, "VCSEL frequency stabilization for optically pumped magnetometers," Chin. Opt. Lett. 19, 121407 (2021)
- Chinese Optics Letters
- Vol. 19, Issue 12, 121407 (2021)
Abstract
Keywords
1. Introduction
Optically pumped magnetometers (OPMs) are some of the most sensitive magnetic field sensors; they are a promising alternative to conventional cumbersome and expensive superconducting quantum interference devices[
Laser performance directly affects OPM sensitivity. The frequency fluctuation and intensity noise can be coupled to sensor output, which is often the most prominent source of measurement noise. Furthermore, long-term laser fluctuation results in lower accuracy and decreases sensor stability[
Current frequency stabilization methods can be classified according to the presence or absence of frequency reference into two types: passive and active frequency stabilization[
Although the saturated abruption method exhibits better performance, the additional frequency stabilization setup increases the volume and power consumption of OPMs, which is unfavorable for their application in MEG and MCG[
In this study, we stabilized a VCSEL based on a broadened absorption spectrum whose linewidth is about 40 GHz due to pressure broadening. This method was operated through a 3-mm-inner-length cubic alkali vapor cell and does not need any additional setup for laser stabilization except to the OPMs’ parts. To simultaneously improve the long- and short-term stability of VCSELs, a closed-loop control system was developed utilizing two proportional-integral-differential (PID) modules that tune the injection current and temperature of the VCSEL. The experiment consisted of three parts. First, measurements were performed for the laser properties and a broadened absorption spectrum due to pressure broadening. The vapor cell was filled with a drop of Rb atom, 600 Torr
2. Methods and Experimental Setup
For OPMs, a pump beam, tuned on the alkali
The laser frequency drift is converted into a light intensity signal detected by a photodetector through a heated alkali vapor cell. The high-frequency modulation signal is added to the VCSEL injection current, which results in the scanning of the laser frequency. The signal demodulated by a lock-in amplifier (MFLI, Zurich Instrument) is the dispersion spectrum, which is distributed anti-symmetrically as
When the VCSEL frequency deviates from the center of the absorption curve, the dispersion signal is distributed on the negative or positive half-axis of the vertical coordinate. Therefore, the drift direction of the frequency can be determined according to the dispersion signal.
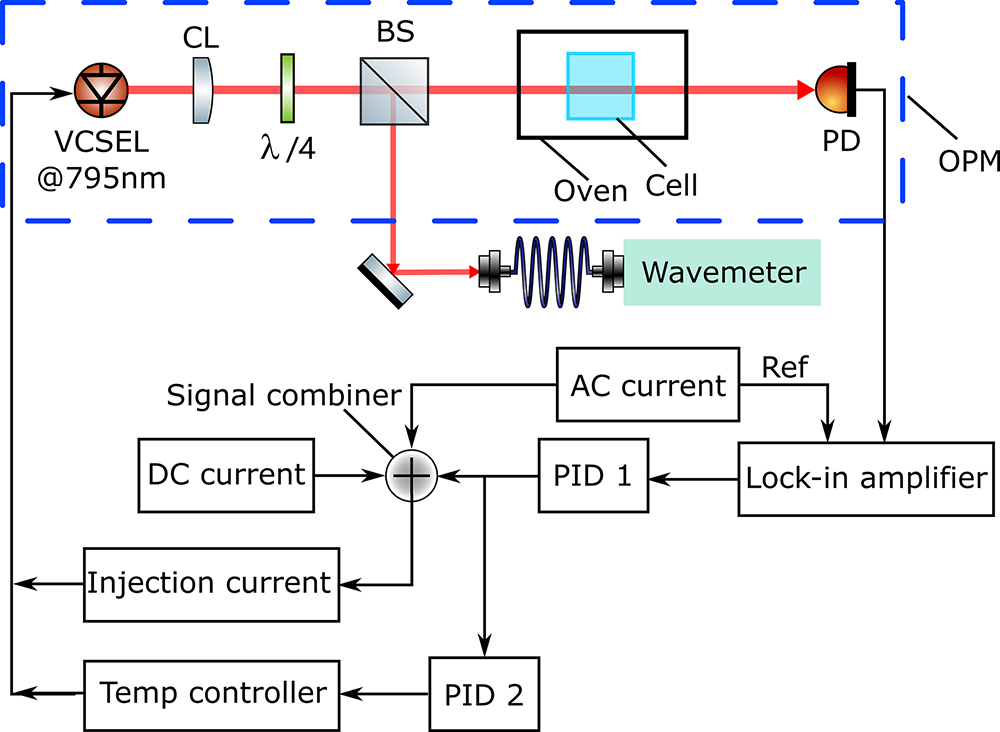
As shown in Fig. 1, the parts in the blue dashed box [excluding the beam splitter (BS)] are the major OPM fractions. The absorption spectrum is detected by the PD when scanning the VCSEL frequency. Then, the lock-in amplifier demodulates the signal from the PD and sends the demodulated signal to PID 1. The PID 1 module rapidly tunes the VCSEL frequency by controlling the injection current. The PDI 2 module controls the VCSEL temperature to achieve a larger frequency tuning range.
![]()
Figure 1.Schematic of the experimental apparatus. CL, collimating lens; BS, beam splitter; λ/4, quarter wave plate; PD, photodetector; OPM, optically pumped magnetometer; PID, proportional-integral-differential module.
The frequency tuning range by changing the VCSEL temperature is larger than the range by tuning the VCSEL injection current. When the injection current has a big deviation from the initial value, the VCSEL may jump modes. However, the system response speed using the injection current is much higher than that using the VCSEL temperature. Based on these analyses, PID 1 is used to tune the VCSEL frequency rapidly by the injection current when the VCSEL frequency drifts from the resonant frequency. PID 2 is designed to tune the VCSEL frequency by changing the VCSEL temperature and pull the VCSEL injection current to the initial value. To adjust the injection current, the input signal of PID 2 is set as the output signal of PID 1, and the setpoint of PID 2 is zero. Therefore, the proposed double-closed-loop method can increase both the frequency tuning range and the response speed.
After sequentially passing a linear polarizer and a quarter-wave plate, the VCSEL beam becomes circularly polarized. The circularly polarized light is separated into two parts by a BS. The reflected light is monitored by a wavemeter (WS7, HighFinesses), and the transmitted light can pump the alkali atoms in the cube-shaped vapor cell. The outer and inner side lengths are 4 and 3 mm, respectively. The glass cell is filled with a drop of Rb atom, 600 Torr
The VCSEL frequency stabilization is analyzed via Allan deviation based on the output data of the wavemeter. The wavemeter measurement is consistent with the results obtained using the beat note signal. A 794.98 nm VCSEL (ULM79X, Philips) operates at an injection current of 1.8 mA and a temperature of 47.6°C, which is a typical operating condition. Additionally, the light spot diameter is 1.1 mm, and the laser output power is 400 µW. A current source (LDC200CV, Thorlabs) and a temperature controller (TED200C, Thorlabs) are used to drive the VCSEL. In addition to the DC component, the VCSEL injection current contains a high-frequency modulation current at 59 kHz and a control signal from the feedback control system.
To obtain suitable VCSEL parameters, the tuning coefficients and absorption spectrum are examined. The VCSEL frequency stability results under the three running modes are analyzed according to the experimental setup. Furthermore, we experimentally investigate the noise suppression performance results under the three operating modes.
3. Results and Discussion
3.1. VCSEL properties and absorption spectrum
The VCSEL properties are measured and shown in Fig. 2. As presented in Fig. 2(a), the VCSEL threshold current is approximately 0.6 mA, which is consistent with its description. When the tuning range of the injection current is 1.5–2.0 mA, the output intensity is approximately 400–600 µW, and the fitting of the tuning coefficient is 391.9 µW/mA (black line), as shown in Fig. 2(a). Figure 2(b) shows the dependence of the VCSEL frequency on temperature and injection current. The tuning coefficient is 224 GHz/mA at 47.5°C (blue line), estimated through least-squares fitting. Similarly, the coefficient between the VCSEL frequency and temperature is 29.4 GHz/K (red line) when the injection current is 1.8 mA. Within a limited tuning range, the tuning coefficients are considered to be constant.
![]()
Figure 2.VCSEL properties. (a) Intensity tuning of the VCSEL can be obtained by changing the injection current. The injection current tuning coefficient is 391.9 µW/mA. (b) The tuning coefficient is 224 GHz/mA at 47.5°C and 29.4 GHz/K at 1.8 mA.
The absorption and dispersion curves (black and red lines, respectively) are obtained by scanning the VCSEL injection current presented in Fig. 3, which is broadly consistent with Eqs. (1) and (2). In the absorption curve, approximately 80% of the light is absorbed when the frequency is tuned on the Rb D1 resonance line. The linear slope around the zero crossing of the dispersion curve is 32.1 mV/GHz, which indicates the sensitivity of the control system to frequency fluctuations. As shown in Fig. 3, the shape of the absorption curve is asymmetric, showing a deviation from the Lorentzian line shape. Based on our analysis, there are three main causes for this: (i) an increase in light intensity with scanning of the injection current, (ii) collisions between alkali atoms and perturbing particles (quenching and buffer gases), and (iii) the thermal motion of alkali atoms. The demodulated signal (red line) has a dispersion line shape, whose slope indicates the sensitivity of the system to the VCSEL frequency fluctuation.
![]()
Figure 3.Absorption and dispersion curves (black and red lines, respectively). The vertical axis indicates the detection signal strength, and the horizontal axis represents the laser frequency detuning.
3.2. Frequency stability
The VCSEL frequency is measured continuously by a wavemeter for approximately 10 h under the free-running, single-closed-loop, and double-closed-loop modes, which are presented in the time domain in Fig. 4. The wavelength drift rate is 12.5 MHz/h in the double-closed-loop mode (red line), which is far superior to that of the single-closed-loop (19.0 MHz/h) and free-running (328.7 MHz/h) modes.
![]()
Figure 4.Frequency shift as estimated by the wavemeter. The frequency shift rates under the free-running (black line), single-closed-loop (blue line), and double-closed-loop (red line) modes are 328.7, 19.0, and 12.5 MHz/h, respectively.
To provide a more comprehensive analysis of the short-term and long-term frequency stability under these three modes, the Allan deviation is calculated in the three running modes, as shown in Fig. 5. The short-term frequency stability of the free-running VCSEL is approximately
![]()
Figure 5.Allan deviation calculated for three data sets under three running modes. The black, blue, and red lines represent the open-loop, single-closed-loop, and double-closed-loop modes, respectively.
When the average time exceeds 100 s, the Allan deviation of both closed-loop modes is similar. The most obvious finding to emerge from the Allan deviation is that the advantage of the double-closed-loop method is not pronounced for VCSEL frequency long-term stability.
There are several reasons to explain the results. The broad absorption spectrum is the main factor affecting the performance of long-term stability. In addition, environmental temperature fluctuation during the measurements also adds to the difficulty in achieving high long-term stability. Nevertheless, the running time of OPMs for MCG or MEG is much shorter each time (generally much less than 10 h); thus, it is helpful for OPMs using the double-closed-loop method, which only enhances the short-term stability.
3.3. Intensity noise suppression
To quantitatively describe the noise suppression effect of closed-loop systems, Gaussian white noise is added to the VCSEL injection current. The peak-to-peak value of the artificial noise is 24 µA produced by a waveform generator (Keysight, 33500B series). The bandwidth of the artificial noise is 100 Hz, which covers the working frequency of OPMs. Figure 6 shows that the single-closed-loop control system eliminates the impact of Gaussian white noise. When artificial noise is added, the standard VCSEL intensity deviation is 1.5 and 0.24 mV under the free-running and single-closed-loop modes, respectively. The time-domain results demonstrate the noise suppression performance of the single-closed-loop control system.
![]()
Figure 6.Light intensity noise in the time domain exposed to Gaussian white noise. The standard deviation is 1.5 and 0.24 mV under the free-running and single-closed-loop modes, respectively.
The noise level is also calculated in the frequency domain. The intensity noise spectral density (NSD) is calculated under the free-running and single-closed-loop modes. Subsequently, the noise rejection ratio (NRR) is introduced to represent the noise suppression effect[
The intensity NSD is shown in Fig. 7. When exposed to Gaussian white noise, the VCSEL tuned by the single-closed-loop control system has a lower noise level, which is approximately
![]()
Figure 7.NSD of the intensity exposed to Gaussian white noise. The black, blue, and red lines are the free-running, single-closed-loop, and double-closed-loop modes, respectively. The VCSEL intensity noises under the free-running, single-closed-loop, and double-closed-loop modes are approximately 1 × 10⁻⁴, 1 × 10⁻⁵, and 7 × 10⁻⁶ V/Hz1/2, respectively.
However, without artificial noise, the performance of the single-closed-loop system in terms of amplitude noise suppression is similar to that of the free-running mode. In contrast, the double-closed-loop system exhibits excellent amplitude noise suppression properties. The intensity NSD in the three running modes is measured and analyzed without artificial noise. The intensity of the laser passing through the heated vapor cell is detected using a photodetector. The signal from the photodetector is recorded and demodulated using a lock-in amplifier. The NSD is calculated from three sets of demodulated signals under the three running modes, as shown in Fig. 8. The noise under the double-closed-loop mode (red line) is approximately
![]()
Figure 8.Intensity NSD under the three running modes. The black, blue, and red lines represent the free-running, single-closed-loop, and double-closed-loop modes, respectively.
4. Conclusion
In this study, we propose a method that does not require additional setup for VCSEL stabilization. The proposed method utilizes a broadened absorption spectrum as a frequency reference. The effectiveness of our method is verified in terms of frequency stabilization and noise suppression. The frequency Allan deviation is
References
[1] J. C. Allred, R. N. Lyman, T. W. Kornack, M. V. Romalis. High-sensitivity atomic magnetometer unaffected by spin-exchange relaxation. Phys. Rev. Lett., 89, 13(2002).
[2] J. Osborne, J. Orton, O. Alem, V. Shah. Fully integrated standalone zero field optically pumped magnetometer for biomagnetism. Proc. SPIE, 10548, 105481G(2018).
[3] M. J. Brookes, E. Boto, M. Rea, V. Shah, J. Osborne, N. Holmes, R. M. Hill, J. Leggett, N. Rhodes, R. Bowtwll. Theoretical advantages of a triaxial optically pumped magnetometer magnetoencephalography system. NeuroImage, 236, 118025(2021).
[4] S. Knappe, P. D. D. Schwindt, V. Gerginov, V. Shah, L. Liew, J. Moreland, H. G. Robinson, L. Hollberg, J. Kitching. Microfabricated atomic clocks and magnetometers. J. Opt. A, 8, S318(2006).
[5] P. D. D Schwindt, C. N. Johnson. Atomic magnetometer for human magnetoencephalography(2010).
[6] M. V. Petrenko, S. P. Dmitriev, A. S. Pazgalev, A. E. Ossadtchi, A. K. Vershovskii. Towards the non-zero field cesium magnetic sensor array for magnetoencephalography. IEEE Sens. J., 21, 18626(2021).
[7] Y. Yang, M. Xu, A. Liang, Y. Yin, X. Ma, Y. Gao, X. Ning. A new wearable multichannel magnetocardiogram system with a SERF atomic magnetometer array. Sci. Rep., 11, 5564(2021).
[8] J. Tang, Y. Zhai, L. Cao, Y. Zhang, L. Li, B. Zhao, B. Zhou, B. Han, G. Liu. High-sensitivity operation of a single-beam atomic magnetometer for three-axis magnetic field measurement. Opt. Express, 29, 15641(2021).
[9] L. Xing, Y. Zhai, W. Fan, J. Huang, T. Song, W. Ye, W. Quan. Miniaturized optical rotation detection system based on liquid crystal variable retarder in a K-Rb-21Ne gyroscope. Opt. Express, 27, 38061(2019).
[10] X. Wang, K. Liu, H. Cheng, W. Ren, J. Xiang, J. Ji, X. Peng, Z. Zhang, J. Zhao, M. Ye, L. Li, T. Li, B. Wang, Q. Qu, L. Liu, D. Lü. Optimization of temperature characteristics of a transportable 87Rb atomic fountain clock. Chin. Opt. Lett., 17, 080201(2019).
[11] G. Dong, J. Deng, J. Lin, S. Zhang, H. Lin, Y. Wang. Recent improvements on the pulsed optically pumped rubidium clock at SIOM. Chin. Opt. Lett., 15, 040201(2017).
[12] H. Lin, J. Deng, J. Lin, S. Zhang, Y. Wang. Frequency stability of a pulsed optically pumped atomic clock with narrow Ramsey linewidth. Appl. Opt., 57, 3056(2018).
[13] B. Zhou, G. Lei, L. Chen, W. Wu, Z. Wang, X. Meng, J. Fang. Noise suppression for the detection laser of a nuclear magnetic resonance gyroscope based on a liquid crystal variable retarder. Chin. Opt. Lett., 15, 082302(2017).
[14] Y. Yao, C. Zou, H. Yu, J. Guo, Y. Li, J. Liu. The developing condition analysis of semiconductor laser frequency stabilization technology. J. Semicond., 39, 114004(2018).
[15] M. Salit, J. Kriz, J. Ridley, R. Compton. VCSELS for rubidium D1 (795 nm). Proceedings of the 43rd Annual Precise Time and Time Interval Systems and Applications Meeting, 377(2011).
[16] K. Jiang, J. Wang, X. Tu, M. He, M. Zhan. Polarization spectra of Rb atoms and their application in laser frequency stabilization. Chin. Opt. Lett., 20, 377(2003).
[17] W. Ma, L. Dong, W. Yin, C. Li, S. Jia. Frequency stabilization of diode laser to 1.637 µm based on the methane absorption line. Chin. Opt. Lett., 2, 486(2004).
[18] Y. Han, S. Guo, J. Wang, H. Liu, J. He, J. Wang. Efficient frequency doubling of a telecom 1560 nm laser in a waveguide and frequency stabilization to Rb D2 line. Chin. Opt. Lett., 12, 121401(2014).
[19] D. Su, T. Meng, Z. Ji, J. Yuan, Y. Zhao, L. Xiao, S. Jia. Application of sub-Doppler DAVLL to laser frequency stabilization in atomic cesium. Appl. Opt., 53, 7011(2014).
[20] A. Brillet, P. Cerez, H. Clergeot. Frequency stabilization of He-Ne lasers by saturated absorption. IEEE J. Quantum Electron., 10, 526(1974).
[21] A. Brillet, P. Cerez. Laser frequency stabilization by saturated absorption. J. Phys. Colloq., 42, C8(1981).
[22] M. Ouhayoun, C. J. Bordé. Frequency stabilization of CO2 lasers through saturated absorption in SF6. Metrologia, 13, 149(1977).
[23] J. Wallard. Frequency stabilization of the helium-neon laser by saturated absorption in iodine vapour. J. Phys. E, 5, 926(1972).
[24] V. Shah. Method for stabilizing atomic devices. U.S. Patent(2019).
[25] C. Affolderbach, G. Mileti. A compact laser head with high-frequency stability for Rb atomic clocks and optical instrumentation. Rev. Sci. Instrum., 76, 073108(2005).
[26] C. Affolderbach, C. Andreeva, S. S. Cartaleva, G. Mileti, D. G. Slavov. Frequency stability comparison of diode lasers locked to Doppler and sub-Doppler resonances. Eighth International Conference on Laser and Laser Information Technologies, 396(2004).
[27] J. Wang, W. Fan, K. Yin, Y. Yan, B. Zhou, X. Song. Combined effect of pump-light intensity and modulation field on the performance of optically pumped magnetometers under zero-field parametric modulation. Phys. Rev. A, 101, 053427(2020).
[28] R. Ciuryło. Shapes of pressure- and Doppler-broadened spectral lines in the core and near wings. Phys. Rev. A, 58, 1029(1998).
[29] R. Zhang, Y. Ding, Y. Yang, Z. Zheng, J. Chen, X. Peng, T. Wu, H. Guo. Active magnetic-field stabilization with atomic magnetometer. Sensors, 20, 4241(2020).
[30] S. P. Krzyzewski, A. R. Perry, V. Gerginov, S. Knappe. Characterization of noise sources in a microfabricated single-beam zero-field optically-pumped magnetometer. J. Appl. Phys., 126, 044504(2019).


Set citation alerts for the article
Please enter your email address

© Copyright 2018-2021 | Chinese Laser Press. All Rights Reserved 沪ICP备15018463号-20