
Jing Zhao, Long Zhu, Zhenyu Wu, Fei Dong. Reduction of Accumulated Error in Linear Motor Mover Position Measurement Based on Self-Adjusting Measurement Reference Chart[J]. Acta Optica Sinica, 2023, 43(11): 1112006
- Acta Optica Sinica
- Vol. 43, Issue 11, 1112006 (2023)
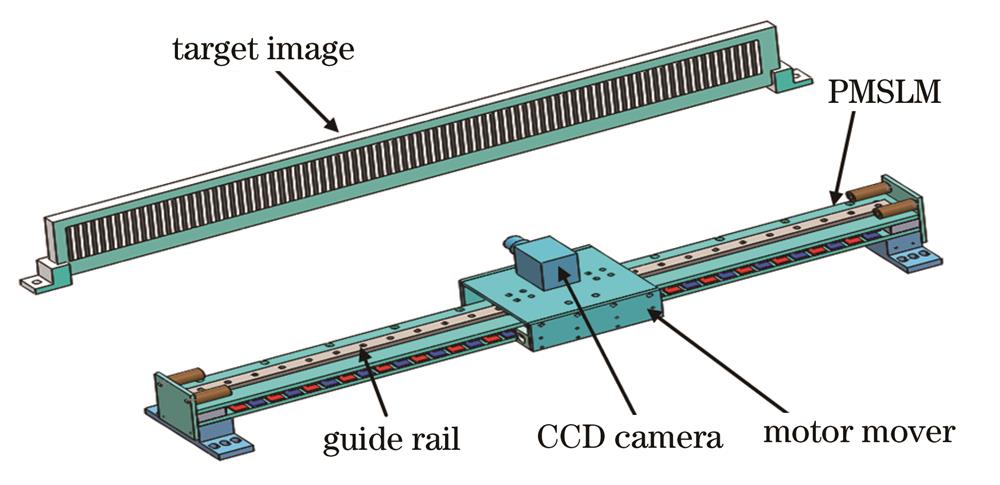
Fig. 1. PMSLM mover position measuring system
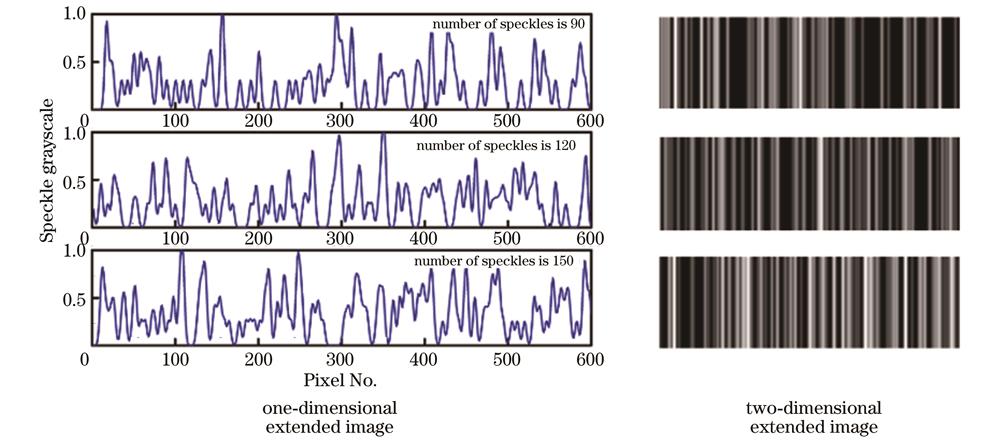
Fig. 2. Three target images
Fig. 3. Error comparison of different types of graphs
Fig. 4. Schematic of traditional incremental sensors for long travel displacement measurement
Fig. 5. Schematic of the proposed cumulative error reduction method. (a) Schematic diagram; (b) flow chart
Fig. 6. Comparison of measurement range. (a) Traditional gradient algorithm; (b) proposed method
Fig. 7. Comparison between the proposed variable benchmark method and the traditional method. (a) Displacement tracking comparison; (b) cumulative error comparison; (c) error analysis
Fig. 8. Cumulative error at different thresholds
Fig. 9. Experiment platform
Fig. 10. Measurement accuracy verification. (a) Verification of the measurement range of adjacent frames; (b) cumulative error reduction
Fig. 11. Comparison of different algorithms. (a) Comparison of displacement measurement errors of adjacent frames; (b) cumulative error comparison; (c) cumulative error analysis
Fig. 12. Robustness comparison. (a) Comparison of measurement error under different illuminations; (b) error comparison of different algorithms under low illumination; (c) error analysis
|
Table 1. Optimal threshold value range for images with different sizes
|
Table 2. Measurement system calibration coefficient calculation
|
Table 3. Time-consuming comparison of different algorithms

Set citation alerts for the article
Please enter your email address
© Copyright 2018-2021 | Chinese Laser Press. All Rights Reserved 沪ICP备15018463号-20