
Jian ZHOU, Tong JIANG, Buda Su, Yanjun WANG, Hui TAO, Jiancheng QIN, Jianqing ZHAI. Spatiotemporal variations of aridity index over the Belt and Road region under the 1.5℃ and 2.0℃ warming scenarios[J]. Journal of Geographical Sciences, 2020, 30(1): 37
- Journal of Geographical Sciences
- Vol. 30, Issue 1, 37 (2020)
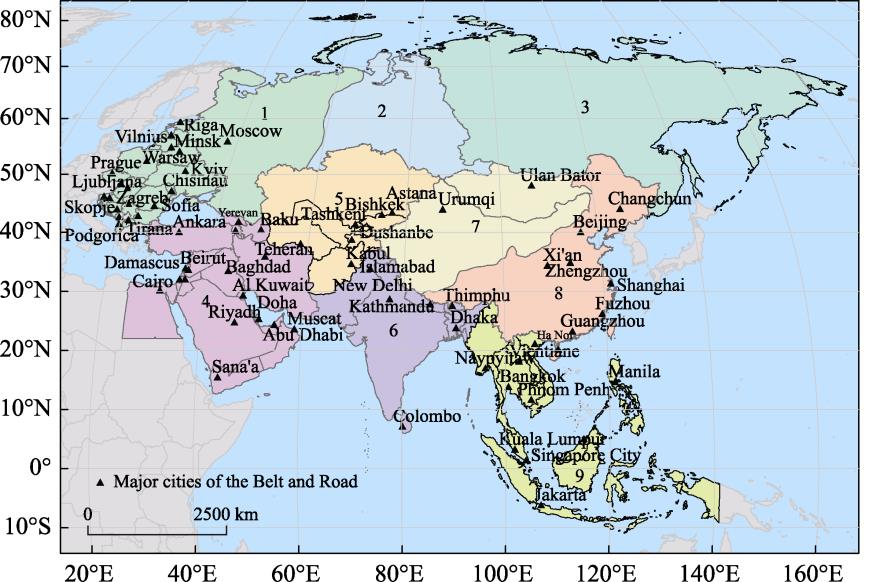
Fig. 1. The Belt and Road sub-regions: 1. Central-Eastern Europe; 2. West Siberia; 3. Central-Eastern Siberia; 4. West Asia; 5. Central Asia; 6. South Asia; 7. Non-monsoon region of East Asia; 8. Monsoon region of East Asia; 9. Southeast Asia
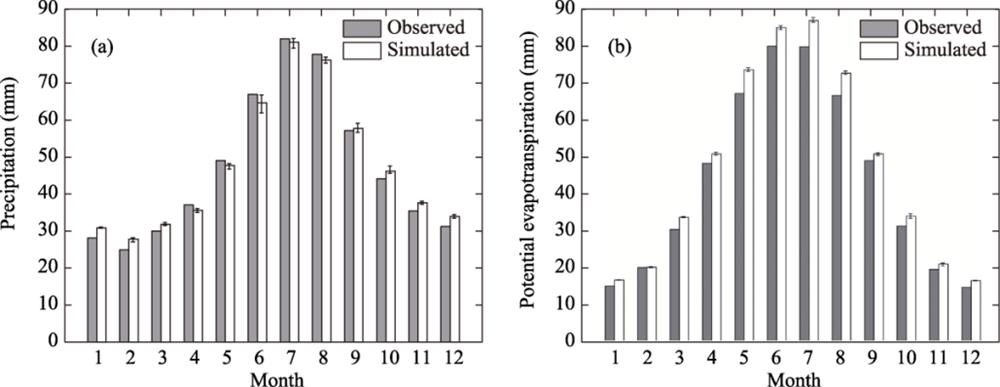
Fig. 2. Comparison of GCM ensemble mean with observation in the Belt and Road region for 1961-2005: multi-year averaged monthly precipitation (a) and potential evapotranspiration (b)Note: The upper and lower limits represent the range of climate models. The same applies to Figures 4 and 6.
Fig. 3. Spatial distributions of annual precipitation and potential evapotranspiration for 1961-2005: observed and simulated precipitation (a-b); observed and simulated potential evapotranspiration (c-d)
Fig. 4. Comparison of precipitation (a) and potential evapotranspiration (b) in 1986-2005, 1.5℃ and 2.0℃ global warming levels over the Belt and Road region
Fig. 5. Changes in precipitation (a-b) and potential evapotranspiration (c-d) under the 1.5℃ and 2.0℃ global warming scenarios relative to the reference period over the Belt and Road region: (a) and (c) show the changes in precipitation and potential evapotranspiration under the 1.5℃ scenario compared to the reference period; (b) and (d) show the changes in precipitation and potential evapotranspiration under the 2.0℃ scenario compared to the reference period
Fig. 6. Annual aridity index changes in the Belt and Road region under the 1.5℃ and 2.0℃ global warming scenariosNote: Numbers (1-9) denote different areas of the Belt and Road region marked in Figure 1 . The same applies to Figure 8 .
Fig. 7. Spatial distribution of the aridity index in the Belt and Road region: (a) in 1986-2005; (b) changes in the 1.5℃ with relative to the reference period; (c) changes in the 2.0℃ with relative to the reference period; (d) changes in the 2.0℃ with relative to the 1.5℃ Note: Dashes in the figures represent areas with significant changes at p <0.1. This also applies to Figure 9 .
Fig. 8. Seasonal aridity index changes in the Belt and Road region under the 1.5℃ and 2.0℃ global warming scenarios: (a) spring, (b) summer, (c) autumn, and (d) winter Note: The black mark (×) above the bars represents the multi-model ensemble mean in 1986-2005.
Fig. 9. Relative changes of the seasonal aridity index under the 1.5℃ and 2.0℃ warming scenarios: (a) spring, (b) summer, (c) autumn, (d) and winter. (1-3) denote the 1.5℃ scenario relative to the reference period, the 2.0℃ scenario relative to the reference period, and the 2.0℃ scenario relative to the 1.5℃ scenario, respectively.
Fig. 10. Changes in the aridity index attributable to precipitation (a, c) and potential evapotranspiration (b, d) under the 1.5℃ scenario (a, b) and 2.0℃ scenario (c, d) relative to 1986-2005
|
Table 1.
Basic information on the four global climate models (GCMs)

Set citation alerts for the article
Please enter your email address
© Copyright 2018-2021 | Chinese Laser Press. All Rights Reserved 沪ICP备15018463号-20