
Jian ZHOU, Tong JIANG, Buda Su, Yanjun WANG, Hui TAO, Jiancheng QIN, Jianqing ZHAI. Spatiotemporal variations of aridity index over the Belt and Road region under the 1.5℃ and 2.0℃ warming scenarios[J]. Journal of Geographical Sciences, 2020, 30(1): 37
- Journal of Geographical Sciences
- Vol. 30, Issue 1, 37 (2020)
Abstract
Keywords
1 Introduction
As an important climate indicator, the aridity index is widely used to characterize the dry and wet levels of a region and is also applied to assess the impacts of climate change (
Global warming is expected to make the surface air drier and result in an increase of evaporation from water bodies (
There is no doubt that the climate is warming (
China put forward an initiative of “The Belt and Road” in 2015 to strengthen the connection between the Asian Pacific and Europe and form a human community with shared destiny (
2 Study area
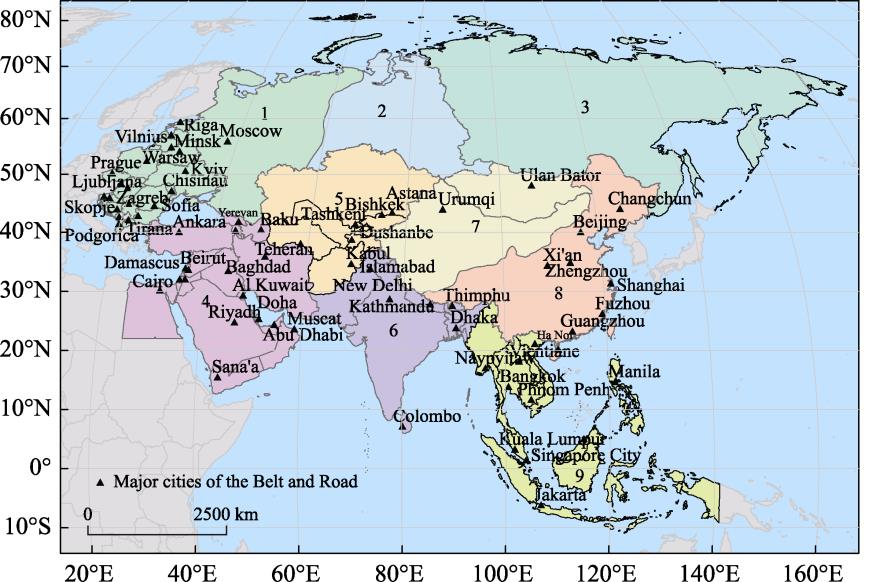
The Belt and Road region straddles Asia, Europe and Africa, and covers 65 countries with diverse natural environments. Eight types of climate dominate in this region, with both monsoon and continental climate characteristics and the regionally uneven distribution of water resources. Because the proportion of bare land and bush is higher in this region than the global average, the overall ecological environment is fragile (
According to the geographical divisions of the United Nations and Köppen climate classification, the Belt and Road region can be divided into nine sub-regions: Central-Eastern Europe, West Siberia, Central-Eastern Siberia, West Asia (Egypt included), Central Asia, South Asia, the non-monsoon region of East Asia, the monsoon region of East Asia and Southeast Asia (
![]()
Figure 1.
3 Data and methods
3.1 Data
The Climatic Research Unit (CRU) datasets include monthly precipitation and potential evapotranspiration during 1961-2017. These datasets for the period 1961-2005 when matches the historical period of climate simulation data are used to evaluate the simulation capacity of the GCMs. The CRU is based on more than 4000 meteorological stations around the world and covers the land areas of the Earth at a spatial resolution of 0.5º×0.5º (
Climate simulation data are from four GCMs (GFDL-ESM2M, HadGEM2-ES, IPSL- CM5A-LR and MIROC5) in the Coupled Model Intercomparison Project Phase 5 (
| Climate model | Research institute | Original horizontal resolution |
|---|---|---|
| GFDL-ESM2M | Geophysical Fluid Dynamics Laboratory | 144´90 |
| HadGEM2-ES | Hadley Centre for Climate Prediction and Research | 192´145 |
| IPSL-CM5A-LR | L’Institut Pierre-Simon Laplace | 96´96 |
| MIROC5 | Atmosphere and Ocean Research Institute | 256´128 |
Table 1.
Basic information on the four global climate models (GCMs)
3.2 Methods
3.2.1 Aridity index
The aridity index in this study is deduced by the ratio of potential evapotranspiration and precipitation. The greater the Aridity Index is, the more dryer the climate. Areas where the aridity index is less than 1 are regarded as humid regions (
where AI indicates the aridity index; P represents precipitation (mm); ETP represents potential evapotranspiration (mm) and is calculated based on the Penman-Monteith formula recommended by the United Nations Food and Agriculture Organization (
3.2.2 Horizons of the 1.5℃ and 2.0℃ global warming
The global average temperature during the reference period (1986-2005) increased by 0.61℃ compared to the pre-industrial period in 1850-1900 (
3.2.3 Sensitivity analysis
The sensitivity of the aridity index to potential evapotranspiration and precipitation can be evaluated as follows:
where xi represents the variable that denotes potential evapotranspiration or precipitation in this paper, Sxi represents the sensitivity coefficient of the aridity index related to xi, AI0 represents the original aridity index, and AI(xi) represents the aridity index with the change in the specified variable. When the sensitivity of potential evapotranspiration to the aridity index is calculated, precipitation remains unchanged, and vice versa.
4 Results
4.1 Comparison of GCM simulations with observations
The inter-annual distributions of precipitation and potential evapotranspiration simulated by GCMs over the Belt and Road region during 1961-2005 are compared with the observation data (
![]()
Figure 2.
Spatial distributions of annual precipitation and potential evapotranspiration over the Belt and Road region for 1961-2005 are shown in
![]()
Figure 3.
4.2 Projection of precipitation and potential evapotranspiration
The variation of the aridity index is closely related to changes of precipitation and poten-tial evapotranspiration. In the 1986-2005 reference period, area-averaged annual precipitation over the Belt and Road region is approximately 574 mm by the ensemble, with model values ranging from 568 mm to 580 mm. Relative to the reference period, precipitation will increase by 5.3% and reach 605 mm (600-613 mm) under a global warming scenario of 1.5℃, with the largest growth of 25% in West Asia. Meanwhile, precipitation will slightly decrease in Central Asia, Central-Eastern Europe and Southeast Asia. Under the 2.0℃ warming scenario, area averaged annual precipitation will further increase to 620 mm (608-635 mm), with a remarkably increase of over 15% in West Asia, the non-monsoon region of East Asia and Central-Eastern Siberia. Decreased precipitation will occur in Central-Eastern Europe, Central Asia and north of West Asia, with the largest decrease of more than 5% (Figures 4a and 5a-5b).
![]()
Figure 4.
Potential evapotranspiration is approximately 910 mm (905-912 mm) over the Belt and Road region in 1986-2005. Under the global warming scenario of 1.5℃, potential evapotranspiration will reach 950 mm (922-967 mm), with the fastest growth of more than 10% in Central-Eastern Europe and a slight decrease in Southeast Asia. The increase of potential evapotranspiration will be more extensive under the 2.0℃ warming scenario. The area-averaged potential evapotranspiration will increase to 974 mm (938-997 mm), with an increase of more than 10% in Central-Eastern Europe, Central-Eastern Siberia and the monsoon region of East Asia relative to the reference period (Figures 4b and 5c-5d).
![]()
Figure 5.
4.3 Projection of the aridity index under the 1.5℃ and 2.0℃ warming scenarios
4.3.1 Changes in the annual aridity index
In 1986-2005, the annual aridity index in the Belt and Road region was approximately 1.58 (1.57-1.61). West Asia, Central Asia and the non-monsoon region of East Asia can be considered as arid areas, with the highest aridity index of more than 10 in West Asia. South Asia belongs to a semi-arid area, while Central-Eastern Europe, Central-Eastern Siberia and the monsoon region of East Asia are semi-humid. Southeast Asia is the wettest area in the Belt and Road region, and the aridity index is only about 0.57 (0.56-0.58) (Figures 6 and 7a). With global warming, the aridity index in the Belt and Road region will maintain at 1.57 due to the simultaneous increases in precipitation and potential evapotranspiration. Under the 1.5℃ global warming scenario, the aridity index in Central-Eastern Europe, north of West Asia, south of East Asia and northwest of Southeast Asia will rise rapidly at a rate of over 5% compared to 1986-2005. In contrast, the aridity index will decline in southeast of West Asia, South Asia and Central-Eastern Siberia (
![]()
Figure 6.
Relative to the 1.5℃ level, the spatial distribution of the aridity index with an additional 0.5℃ of global warming in the Belt and Road region will change substantially. Spatially, the aridity index along the borders of Central Asia, South Asia and West Asia will increase significantly at a rate of approximately 15%, followed by Central-Eastern Europe and the monsoon region of East Asia, where the increase will be above 5%. Meanwhile, the aridity index will decrease by approximately 5% in the west of Central-Eastern Siberia and Southeast Asia (
![]()
Figure 7.
4.3.2 Changes of the seasonal aridity index
Area averaged aridity index values in the Belt and Road region for four seasons are shown in
![]()
Figure 8.
Under the 1.5℃ global warming scenario, the aridity index in the northwestern part of West Asia, south of South Asia and northwest Southeast Asia will increase more than that in other regions during the spring season by more than 20% relative to the reference period, followed by an increase of about 10%-15% in Central-Eastern Europe. Meanwhile, the aridity index will decrease by approximately 15% in the eastern part of West Asia and the western part of the monsoon region in East Asia. In summer, the greatest increase of the aridity index will occur in Central Asia, followed by the northwest region of Southeast Asia and Central-Eastern Europe. In contrast, the aridity index will decrease sharply in the eastern portion of West Asia. In autumn, spatial pattern of changes in the aridity index will be similar to those in summer, except for a 15% decrease in South Asia. In winter, the dryness trend will be significant in the eastern part of South Asia, southwestern part of the monsoon region of East Asia, the northern region of West Asia and Central-Eastern Europe, where the aridity index will increase by more than 20% (Figures 9a1-d1).
In the 2.0℃ warming level, dryness will be obvious in Central-Eastern Europe and the northwestern part of South Asia in spring, with the aridity index increasing by more than 15% compared with that in 1986-2005. In summer and autumn, the aridity index will increase rapidly in the west but slowly in the southeastern part of the monsoon region of East Asia. Central Asia, Central-Eastern Europe and the northern region of West Asia will present significant dryness trends, with an increase of the aridity index over 20%, while South Asia will experience a wetter trend. In winter, the aridity index in Central-Eastern Europe, South Asia, Central Asia, the northern region of Central Asia, West Siberia and the northern region of Central-Eastern Siberia will increase by more than 20% but decrease in the non-monsoon region of East Asia, northwest of Southeast Asia and south of West Asia by approximately 20% (Figures 9a2-d2).
For an additional 0.5℃ warming scenario from 1.5℃ to 2.0℃, the aridity index will increase by more than 20% along the borders of Central Asia, South Asia and West Asia, while in the northwest of Southeast Asia and northeast of South Asia, the aridity index will decrease by about 15%-20% in spring season. In summer, the extent of dryness will further expand, and the aridity index in Central-Eastern Europe, Central Asia and most of West Asia will increase by more than 20%. In autumn, the aridity index will increase in the majority of the Belt and Road region, which will be most obvious in Central Asia, West Asia, northwest of South Asia, and all of East Asia. In winter, the aridity index will significantly increase by more than 20% in the western area of South Asia, southeast coastal of the monsoon region of East Asia, north of East Siberia and northwest of Central-Eastern Siberia, but it will decrease by 10%-20% in the northwest of South Asia and west of Central-Eastern Siberia (Figures 9a3-d3).
![]()
Figure 9.
4.3.3 Attribution to aridity index changes
![]()
Figure 10.
The sensitivity analyses show that at the 1.5℃ warming level, precipitation play a more important role than potential evapotranspiration in the southern region of West Asia, South Asia, Central-Eastern Siberia and the non-monsoon region of East Asia, where the attribution of precipitation will be up between -20% and -8% and potential evapotranspiration will be around 0-8%, together conspire the decrease of aridity index of about 0-20%. However, in Central-Eastern Europe, West Siberia, Central Asia and the monsoon region of East Asia, an increase of potential evapotranspiration will attribute largely to the increasing aridity index with amount of 8%-20%, and attribution of precipitation will be from -8% to -4%. Major differences under the 2.0℃ warming scenario relative to the 1.5℃ scenario are found along the border of South Asia and Central Asia, where the drying trend could be explained mainly by the decrease in precipitation.
5 Conclusions and discussion
5.1 Conclusions
The aridity index can represent the distribution of the energy balance and water circulation on the surface of the earth. Its spatial and temporal changes reflect regional droughts and floods. Based on four GCMs, changes of the aridity index over the Belt and Road region are analysed using the Penman-Monteith formula based potential evapotranspiration and precipitation. The following conclusions are drawn in this paper:
(1) In 1986-2005, the area averaged annual potential evapotranspiration and precipitation are about 910 mm and 574 mm, respectively, and the aridity index over the Belt and Road region is approximately 1.58. Spatially, the most arid region lies in the middle and low-latitude Eurasia, such as West Asia, Central Asia and the non-monsoon region of East Asia, while Central-Eastern Europe, West Siberia, the monsoon region of East Asia and Southeast Asia are relatively humid. Note that South Asia belongs to a semi-arid area, with distinct dry and wet seasons.
(2) Under the 1.5℃ global warming scenario, with a 4.5% increase of annual potential evapotranspiration and a 5.3% increase in annual precipitation, the aridity index over the Belt and Road region will change slightly compared with that in 1986-2005 but with spatially distinct variability. The aridity index in Central-Eastern Europe, north of West Asia, south of the monsoon region in East Asia and northwest of Southeast Asia will increase by more than 5%, but it will significantly decrease in Central-Eastern Siberia. For the seasonal scale, changes in the aridity index in winter will be more obvious in Central-Eastern Europe, with increases over 20%, but the index in spring and summer will be relatively flat. The spring and winter seasons in South Asia are expected to become drier, and the dryness trend is also expected in the monsoon region of East Asia in summer, while West Asia is expected to become wetter than before, except during winter.
(3) In the 2.0℃ warming level, potential evapotranspiration and precipitation will increase further, with rates of 7.1% and 7.9%, respectively, relative to those in 1986-2005. Although the aridity index over the Belt and Road region will still be approximately 1.57, the spatial variation will be more obvious. Central-Eastern Europe, north of West Asia and Central Asia will become drier, with an over 20% growth of the aridity index, while Central-Eastern Siberia, the southern part of South Asia and the southeastern part of West Asia might be in a wetness trend. Seasonally, the drying trend will be extensive in autumn and winter, covering Central-Eastern Europe, Central Asia and West Asia. And the trend will even extend towards South Asia, eastern Siberia and north of Central-Eastern Siberia in winter. Differences between the dry and wet seasons in South Asia will be more pronounced, and the monsoon region in East Asia will be drier than it was previously in summer and autumn. The non-monsoon East Asia region will get wetter (excluding autumn).
(4) Compared with the 1.5℃ global warming scenario, change of the area-averaged aridity index over the Belt and Road region is not distinct in the 2.0℃ warming scenario, but significant dryness in Central Asia and north of West Asia and wetness in Southeast Asia and Central Siberia are expected. Seasonally, an increasing trend of the aridity index in Central-Eastern Europe will be continuous, especially in summer. The aridity index will increase at a rate of over 20% in all four seasons in Central Asia, and the increase is obvious in autumn and winter in the monsoon region of East Asia. South Asia will experience intense aridity in spring and winter, but the aridity index will decrease in West Asia during winter.
5.2 Discussion
It can be seen that the increase of the aridity index over the Belt and Road region under the 2.0℃ warming scenario will be more severe than that under the 1.5℃ scenario, especially in Central-Eastern Europe, north of West Asia, Central Asia, the monsoon region of East Asia and South Asia in summer and autumn. As a result, crop yields might be reduced due to water shortages. Our findings are consistent with the drier trends of the aridity index over the Mediterranean, Central Asia, monsoon region of East Asia and a wetter trend in the northwest of China found by previous projection studies (
References
[1] G Allen R. Crop evapotranspiration: Guidelines for computing crop water requirements. FAO Irrigation & Drainage Paper, 56(1998).
[2] K Arora V. The use of the aridity index to assess climate change effect on annual runoff. Journal of Hydrology, 265, 164-177(2002).
[3] T Botzan, M Mariano, A Necula. Modified De Martonne aridity index: Application to the Napa Basin, California. Physical Geography, 19, 55-70(1998).
[4] W Brutsaert, B Parlange M. Hydrologic cycle explains the evaporation paradox. Nature, 396, 30(1998).
[5] J Chen, C Gao, X Zeng et al. Assessing changes of river discharge under global warming of 1.5℃ and 2℃ in the upper reaches of the Yangtze River Basin: Approach by using multiple-GCMs and hydrological models. Quaternary International, 453, 63-73(2017).
[6] X Chen, X Mo, S Hu et al. Contributions of climate change and human activities to ET and GPP trends over North China Plain from 2000 to 2014. Journal of Geographical Sciences, 27, 661-680(2017).
[7] W Cheng J, X Zhang Y. Discussion on relation between humidity index and aridity degree. Journal of Desert Research, 16, 79-82(1996).
[8] T Cong Z, H Ni G, W Yang D et al. Evaporation paradox in China. Advances in Water Science, 19, 147-152(2008).
[9] P Cui Y, P Xiao D, J Liu S et al. Growth periods variation of summer maize and winter wheat and their correlations with hydrothermal conditions in recent years in China. Chinese Journal of Eco-Agriculture, 26, 388-396(2018).
[10] K Djaman, G Komla. Trend analysis in reference evapotranspiration and aridity index in the context of climate change in Togo. Journal of Water & Climate Change, 6, 848-864(2015).
[11] S Feng,, Q Fu,. Expansion of global drylands under a warming climate. Atmospheric Chemistry and Physics, 13, 10081-10094(2013).
[12] K Frieler, S Lange, F Piontek et al. Assessing the impacts of 1.5℃ global warming: Simulation protocol of the Inter-Sectoral Impact Model Intercomparison Project (ISIMIP2b). Geoscientific Model Development Discussions, 10, 1-59(2017).
[13] Q Fu, S Feng. Responses of terrestrial aridity to global warming. Journal of Geophysical Research Atmospheres, 119, 7863-7875(2014).
[14] R Hao Z, W Guo, Y He J et al. The variation tendency of surface aridity index of Shanxi province in recent 50 years. Agricultural Research in Arid Areas, 32, 244-249(2014).
[15] I Harris, D Jones P, J Osborn T et al. Updated high-resolution grids of monthly climatic observations: The CRU TS3.10 Dataset. International Journal of Climatology, 34, 623-642(2014).
[16] S Hempel, K Frieler, L Warszawski et al. A trend-preserving bias correction: The ISI-MIP approach. Earth System Dynamics, 4, 219-236(2013).
[17] P Huang H, P Han Y, M Cao M et al. Spatial-temporal variation of aridity index of China during 1960-2013. Advances in Meteorology, 31, 1488-1498(2016).
[18] L Huang J, J Wang Y, T Fischer et al. Simulation and projection of climatic changes in the Indus River Basin, using the regional climate model COSMO-CLM. International Journal of Climatology, 37, 2545-2562(2017).
[19] G Huntington T. Evidence for intensification of the global water cycle: Review and synthesis. Journal of Hydrology, 319, 83-95(2006).
[20] . Climate Change 2013: The Physical Science Basis. IPCC Working Group 1 Contribution to AR5. Cambridge.
[21] . Climate Change 2014: Synthesis Report, in: Contribution of Working Groups I, 151(2014).
[22] T Jiang, J Wang Y, S Yuan J et al. Projection of population and economy in “the Belt and Road” countries (2020‒2060). Climate Change Research, 14, 155-164(2018).
[23] P Li F, X Zhang G, Q Dong L et al. Studies for impact of climate change on hydrology and water resources. Scientia Geographica Sinica, 33, 457-464(2013).
[24] L Lin, A Gettelman, S Feng et al. Simulated climatology and evolution of aridity in the 21st century. Journal of Geophysical Research Atmospheres, 120, 5795-5815(2015).
[25] X Liu F, J Wang Y, J Zhao et al. Variations of the extreme precipitation under the global warning of 1.5℃ and 2.0℃ in the mid-lower reaches of the Yangtze River Basin. Resources and Environment in the Yangtze Basin, 26, 778-788(2017).
[26] D Liu W, Y Song Z, G Liu Z et al. Progress in research on the Belt and Road Initiative. Acta Geographica Sinica, 73, 620-636(2018).
[27] M Liu X, D Zhang, Z Luo Y et al. Spatial and temporal changes in aridity index in northwest China: 1960 to 2010. Theoretical & Applied Climatology, 112, 307-316(2013).
[28] M Lu, Y Chen, Q Lu Y et al. The spatial balance pattern between land and sea transport in Europe-Asia under the Belt and Road Initiative. Acta Geographica Sinica, 73, 1526-1539(2018).
[29] M Meng, J Ni, G Zhang Z. Aridity index and its applications in geo-ecological study. Acta Phytoecologica Sinica, 28, 853-861(2004).
[30] T Nastos P, N Politi, J Kapsomenakis. Spatial and temporal variability of the Aridity Index in Greece. Atmospheric Research, 119, 140-152(2013).
[31] T Oki, S Kanae. Global hydrological cycles and world water resources. Science, 313, 1068-1072(2006).
[32] C Peterson T, S Golubev V, Y Groisman P. Evaporation losing its strength. Nature, 377, 687-688(1995).
[33] M Ponce V, P Pandey R, S Ercan. Characterization of drought across climatic spectrum. Journal of Hydrologic Engineering, 5, 222-224(2000).
[34] L Roderick M, D Rotstayn L, D Farquhar G et al. On the attribution of changing pan evaporation. Geophysical Research Letters, 34, 251-270(2007).
[35] J Schilling, J Vivekananda, P Nisha et al. Vulnerability to environmental risks and effects on community resilience in mid-west Nepal and South-East Pakistan. Environment & Natural Resources Research, 3, 1-19(2013).
[36] F Schleussner C, K Lissner T, M Fischer E et al. Differential climate impacts for policy-relevant limits to global warming: The case of 1.5℃ and 2℃. Earth System Dynamics, 6, 2447-2505(2016).
[37] D Su B, L Huang J, M Gemmer et al. Statistical downscaling of CMIP5 multi-model ensemble for projected changes of climate in the Indus River Basin. Atmospheric Research, 178/179, 138-149(2016).
[38] D Su B, N Jian D, C Li X et al. Projection of actual evapotranspiration using the COSMO-CLM regional climate model under global warming scenarios of 1.5℃ and 2.0℃ in the Tarim River Basin, China. Atmospheric Research, 196, 119-128(2017).
[39] M Sun H, J Chen et al. Exposure of population to droughts in the Haihe River Basin under global warming of 1.5 and 2.0℃ scenarios. Quaternary International, 453, 74-84(2017).
[40] H Tabari, B Aghajanloo M. Temporal pattern of aridity index in Iran with considering precipitation and evapotranspiration trends. International Journal of Climatology, 33, 396-409(2013).
[41] M Türkeş. Spatial and temporal variations in precipitation and aridity index series of Turkey. Mediterranean Climate - Variability and Trends, 181-213(2003).
[42] Q Wang A, D Su B, J Wang Y et al. Variation of the extreme minimum temperature events and farmland exposure under global warming of 1.5℃ and 2.0℃. Acta Meteorologica Sinica, 75, 415-428(2017).
[43] F Wang, L Ding J, Y Wei. Analysis of drought characteristics over countries and regions of “The Belt and Road” in recent one hundred years. Journal of Geo-information Science, 19, 1442-1455(2017).
[44] P Wang L, M Wen, X Song J et al. Spatial-temporal variation of aridity index during 1961-2014 in China. Journal of Natural Resources, 31, 1488-1498(2016).
[45] L Warszawski, K Frieler, V Huber et al. The Inter-Sectoral Impact Model Intercomparison Project (ISI-MIP): Project framework. Proceedings of the National Academy of Sciences of the United States of America, 111, 3228-3232(2014).
[46] H Yin Y, H Wu S, D Zheng et al. Regional difference of aridity/humidity conditions changeover China during the last thirty years. Chinese Science Bulletin, 50, 2226-2233(2005).
[47] L Zhang H, Q Zhang, Q Liu et al. Analysis on variation characteristics and differences of the Climate drying degree between South and North of China. Plateau Meteorology, 35, 1339-1351(2016).
[48] Y Zheng J, J Bian J, S Ge Q. The climate regionalization in China for 1981-2010. Chinese Science Bulletin, 58, 3088-3099(2013).
[49] Y Zheng J, Y Yin, Y Li B. A new scheme for climate regionalization in China. Acta Geographica Sinica, 65, 3-12(2010).


Set citation alerts for the article
Please enter your email address

© Copyright 2018-2021 | Chinese Laser Press. All Rights Reserved 沪ICP备15018463号-20