
Ying Ji, Lingran Gong, Shuang Fu, Yawei Wang. Automatic Phase Recognition Method Based on Convolutional Neural Network[J]. Laser & Optoelectronics Progress, 2022, 59(6): 0617026
- Laser & Optoelectronics Progress
- Vol. 59, Issue 6, 0617026 (2022)
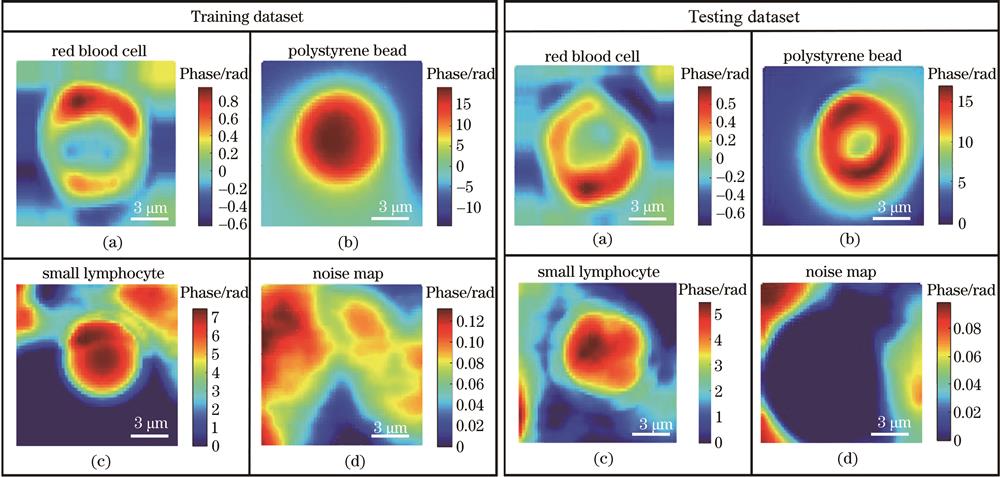
Fig. 1. Examples of each class in training dataset (left) and testing dataset (right) (a) Red blood cell; (b) polystyrene bead; (c) small lymphocyte; (d) noise map
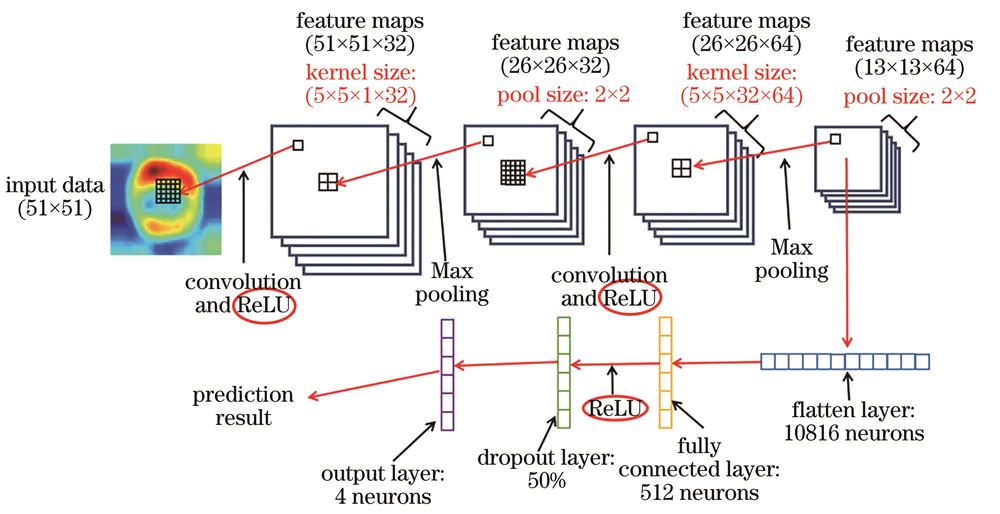
Fig. 2. Structure of CNN implemented for 4-class phase recognition
Fig. 3. Performance of LeNet-5 model in training process. (a) Loss function value; (b) accuracy
Fig. 4. Phase distributions of red blood cell before and after change. (a) Before change; (b) after change
Fig. 5. Performance of new CNN model in training process. (a) Loss function value; (b) accuracy
Fig. 6. Interferograms of various samples. (a) Red blood cell; (b) polystyrene bead; (c) small lymphocyte; (d) noise map
Fig. 7. Performance of LeNet-5 model in training process. (a) Loss function value; (b) accuracy
Fig. 8. ResNet-17 network architecture. (a) Structure of residual block; (b) total architecture of network
Fig. 9. Performance of LeNet-5 model in training process. (a) Loss function value; (b) accuracy
Fig. 10. Polystyrene bead interferograms with different intensity ratios (reference wave∶object wave). (a) 1∶1; (b) 2∶1; (c) 3∶1; (d) 4∶1
Fig. 11. Polystyrene bead interferograms with different fringe spatial frequencies. (a) 1.05 rad/pixel; (b) 1.57 rad/pixel; (c) 2.09 rad/pixel; (d) 3 rad/pixel
Fig. 12. Performance of LeNet-5 model in training process. (a) Loss function value; (b) accuracy
| |||||||||||||||||||||||||||||||
Table 1. Confusion matrix of classification results of LeNet-5 model on interferogram testing dataset
|
Table 2. Performance of LeNet-5 model on each class of interferogram testing dataset
|
Table 3. Performance of ResNet-17 model on each class of interferogram testing dataset
| ||||||||||||||||||||||||||||||
Table 4. Performance of ResNet-17 model on interferogram datasets with different fringe spatial frequencies
|
Table 5. Performance of ResNet-17 model on each class of interferogram testing dataset with multiple spatial frequencies

Set citation alerts for the article
Please enter your email address
© Copyright 2018-2021 | Chinese Laser Press. All Rights Reserved 沪ICP备15018463号-20