• Photonics Research
  • Vol. 9, Issue 6, 916 (2021)
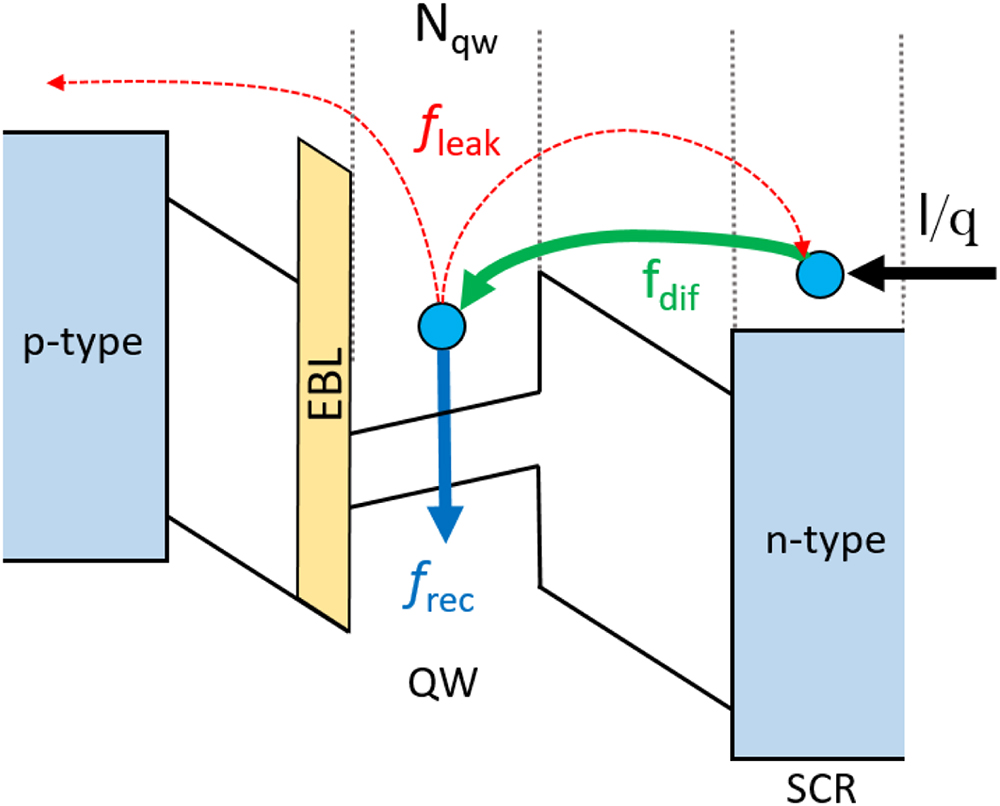
Anton Alexeev1, Jean-Paul M. G. Linnartz1、2, Kumar Arulandu2, and Xiong Deng1、*
Author Affiliations
  • 1Department of Electrical Engineering, Eindhoven University of Technology, 5600 MB Eindhoven, The Netherlands
  • 2Signify (Philips Lighting) Research, HTC 34 (WB), 5656 AE Eindhoven, The Netherlands
  • show less
    DOI: 10.1364/PRJ.416269 Cite this Article Set citation alerts
    Anton Alexeev, Jean-Paul M. G. Linnartz, Kumar Arulandu, Xiong Deng. Characterization of dynamic distortion in LED light output for optical wireless communications[J]. Photonics Research, 2021, 9(6): 916 Copy Citation Text show less
    Model of the p−n junction. Multiple quantum well structure is designated as a singular QW.
    Fig. 1. Model of the pn junction. Multiple quantum well structure is designated as a singular QW.
    Schematic diagram illustrating dominant recombination mechanisms.
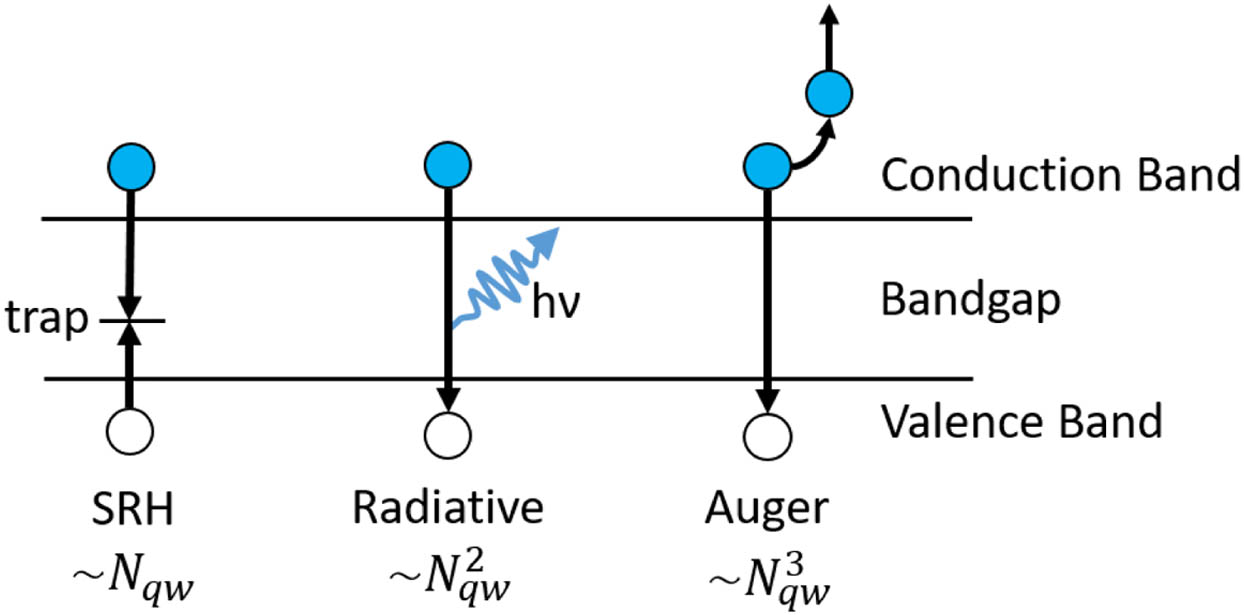
    Fig. 2. Schematic diagram illustrating dominant recombination mechanisms.
    Schematic diagram of the measurement system.
    Fig. 3. Schematic diagram of the measurement system.
    Normalized EQE measurement results and recombination model fits. The plots are separated by 3 dB.
    Fig. 4. Normalized EQE measurement results and recombination model fits. The plots are separated by 3 dB.
    Normalized small-signal optical response measurements and one pole low-pass filter fits. Low current measurements are shifted up by 3 dB to avoid visually overlapping curves.
    Fig. 5. Normalized small-signal optical response measurements and one pole low-pass filter fits. Low current measurements are shifted up by 3 dB to avoid visually overlapping curves.
    Stepped frequency measurement and simulation results of LED optical signal harmonic distortion. (a) Bias current 75 mA peak-to-peak sinusoidal modulation of 100 mA. (b) Bias current 150 mA peak-to-peak sinusoidal modulation of 200 mA. The horizontal axis is the frequency of the fundamental, not of the harmonic it self.
    Fig. 6. Stepped frequency measurement and simulation results of LED optical signal harmonic distortion. (a) Bias current 75 mA peak-to-peak sinusoidal modulation of 100 mA. (b) Bias current 150 mA peak-to-peak sinusoidal modulation of 200 mA. The horizontal axis is the frequency of the fundamental, not of the harmonic it self.
    Two-level pulse amplitude modulation measurements and simulation results. The experimentally measured current is used as an input for optical output simulation. The rise and the fall times are significantly different due to the nonlinear effects.
    Fig. 7. Two-level pulse amplitude modulation measurements and simulation results. The experimentally measured current is used as an input for optical output simulation. The rise and the fall times are significantly different due to the nonlinear effects.
    Discrete-time model for QW carrier dynamics used for simulation of the large-signal light output. Ts represents time delay. Light output p is proportional to the squared population of carriers ∼Nqw2, thus also proportional to ∼B′Nqw2. Parameters TsA′ and TsD′ can be neglected if modulation is around the nominal bias current.
    Fig. 8. Discrete-time model for QW carrier dynamics used for simulation of the large-signal light output. Ts represents time delay. Light output p is proportional to the squared population of carriers Nqw2, thus also proportional to BNqw2. Parameters TsA and TsD can be neglected if modulation is around the nominal bias current.
    DC-biased model for light output modulation and carrier concentration variations nqw for normalized modulating input current iTs/q.
    Fig. 9. DC-biased model for light output modulation and carrier concentration variations nqw for normalized modulating input current iTs/q.
    Schematic band diagram of QW carrier energy distribution. (a) Forward biased p−n junction. (b) Unbiased p−n junction. Fractions of the carrier distribution contributing to the thermionic escape rate are demonstrated.
    Fig. 10. Schematic band diagram of QW carrier energy distribution. (a) Forward biased pn junction. (b) Unbiased pn junction. Fractions of the carrier distribution contributing to the thermionic escape rate are demonstrated.
    OOK (2-PAM) using raised-cosine pulse shaping with roll-off of 0.25 at 100 Msymbols/s. The targeted light output, indicated by the current input to the predistorter (black), is positive, and the lowest point is around 10% above 0. Blue curve: predistorted LED current.
    Fig. 11. OOK (2-PAM) using raised-cosine pulse shaping with roll-off of 0.25 at 100 Msymbols/s. The targeted light output, indicated by the current input to the predistorter (black), is positive, and the lowest point is around 10% above 0. Blue curve: predistorted LED current.
    Anton Alexeev, Jean-Paul M. G. Linnartz, Kumar Arulandu, Xiong Deng. Characterization of dynamic distortion in LED light output for optical wireless communications[J]. Photonics Research, 2021, 9(6): 916
    Download Citation