
Anton Alexeev, Jean-Paul M. G. Linnartz, Kumar Arulandu, Xiong Deng. Characterization of dynamic distortion in LED light output for optical wireless communications[J]. Photonics Research, 2021, 9(6): 916
- Photonics Research
- Vol. 9, Issue 6, 916 (2021)
Abstract
1. INTRODUCTION
Wireless communications has become an essential enabler for a significant part of the activities of modern society. Continuous exponential growth of the demand for data transfer challenges engineers to search for less-congested alternatives to communications technologies based on radio frequency (RF). Optical wireless communications (OWC) use visible, infrared, or ultraviolet light to transmit data. OWC offer a number of advantages over RF communications [1–3]. In particular, it offers an extra layer of security due to the inability of the light to travel across walls; it allows a very dense reuse as walls form a natural spatial separation against interference; and it is not subject to licensing and can be used in environments where RF communication is restricted (e.g., in hospitals, factories, or aircrafts). Moreover, because OWC employ light as a carrier, significantly more bandwidth is potentially available than for RF alternatives [4]. The OWC technology can become a major breakthrough to solve the current bandwidth crunch in wireless communications systems.
State-of-the-art solid-state lighting (SSL) systems rapidly embrace further Internet of Things (IoT) sensing and communications functionalities. The communications performance of OWC continuously increases [5–7]. These systems can be designed in several ways. First, illumination LEDs can be directly employed to transmit data. Second, a lighting system can be augmented with infrared LEDs to transmit data independently of the illumination function. However, we witness that LED models now commonly used in the communications community do not yet capture the physics of modern LEDs, and can be improved significantly [8].
Highly efficient infrared LEDs typically employ aluminium indium gallium phosphide (InGaAIP) for its semiconductor material, instead of indium gallium nitride, which is dominantly used for blue and white illumination LEDs. A typical white LED is made of a blue-emitting chip and phosphorous particles that convert a part of the blue photons into light of a wider spectrum to provide quality illumination with an adequate color rendering index [9]. Therefore, the communications performance of such LEDs is limited by both the electrical processes in the active region and the response of the phosphor particles. Conventional yttrium aluminum garnet phosphors have a long excited-state lifetime that limits the OWC phosphor-associated bandwidth [10–12]. The development of a fast light-conversion material with a short radiative lifetime and high efficiency is still a significant challenge for the SSL industry. Materials such as perovskite nanocrystals and others have been shown to significantly increase the phosphor-associated bandwidth [10,12–14], which can eliminate the phosphor bottleneck for OWC. Phosphor-converted light carries a low-pass filtered, attenuated copy of the signal. Blue-pass filters can significantly extend the modulation bandwidth [15–17], but at the cost of the deterioration of the signal-to-noise ratio. In a typically thermal-noise-limited channel, however, it may work counterproductively [18]. Interestingly, the general active region architecture of infrared and visible light high-efficiency LEDs remains identical. The same modeling approach can be applied for the chips of these LEDs types. While the predominantly used modulation method can cope with the low-pass nature of LEDs and phosphors, it is very sensitive to nonlinearities. This limits the usable modulation depth and the achievable coverage and bit rates. Therefore, we focus our investigation efforts on the combined bandwidth and dynamic linearity of modern LED chips with high efficiency.
Sign up for Photonics Research TOC. Get the latest issue of Photonics Research delivered right to you!Sign up now
Modern illumination LEDs are primarily designed to maximize light output. Their relatively large junction capacitance limits the communications performance. For IR communication LEDs, the major bottleneck of OWC-enabled SSL systems also is the low modulation bandwidth of the LEDs and the nonlinear distortion of the signal [7,19,20]. To achieve high data rates over a low-pass transfer function, orthogonal frequency division multiplexing (OFDM) modulation is widely employed [21,22]. As it splits the entire frequency band in a many narrowband portions, it can precisely load all parts of the signal spectrum with an optimized signal power and signal constellation [20,23,24]. However, OFDM modulation is notoriously sensitive to any nonlinearity of the communications channel since distortion causes interference among the various subcarriers. Hence, predicting and suppressing nonlinearities by signal processing potentially enhances the performance, but requires a reliable model.
As we will review in Section 2 and have argued in Ref. [8], often-used LED models may no longer realistically describe the dynamic light output of modern LEDs and may oversimplify the combination of memory effects and nonlinearities. Other models may be overly generic and involve many parameters that do not have a physical interpretation. On the other hand, models in physics literature often use parameters, such as the junction size that cannot be measured or calibrated in a running communications system.
In this contribution, we demonstrate an approach to model the dynamic light output based on the physics of the LEDs. We translate this model into a discrete-time representation that is suitable for digital signal processing, but is less commonly used in physics-oriented LED modeling. In what we believe, to the best of our knowledge, is a novel way, we combine methods of characterization of the LED efficiency, cover multiple recombination and leakage processes in an extension of the common expressions for the ABC model, and propose a model characterization procedure using differential carrier lifetime measurements. In isolation, these methods were published previously in the literature. Combining them enables us to compile a communications model and a signal processing architecture. We derive what we believe is a new procedure for unique and precise physics-based estimation of the radiative and nonradiative recombination parameters that can be used in the field (i.e., in a working communications system that sets equalizer parameters on the fly). Typical parameters used in literature, such as the effective size of the quantum well, require sophisticated (e.g., chip reverse-engineering) lab setups. Proprietary design data can not be used in a real-time adaptive equalizer designed by other parties. Moreover, these parameters are subject to problems such as process spread and aging. Therefore, these cannot be used in mass market products that run communications links that must compensate for component spread and adapt to drifting parameters. We show that the proposed approach ensures a sufficiently precise modeling of the light output and its distortion artefacts over a wide range of bias currents and modulation depths. It only executes measurements that are feasible in a standard operational system. This paves the way for a new structure of nonlinear equalizers to enhance communications link performance.
After an initial review of existing communications models in Section 2, we first define the phenomena limiting the optical bandwidth. Second, inspired by methods to characterize efficiency, we use a combination of steady-state light output and small-signal optical response measurements to characterize the recombination processes. Next, we propose the dynamic nonlinear light output model and validate it against measurements. Finally, we identify the most relevant and significant parameters of the model and demonstrate how the model can be simplified without jeopardizing accuracy. We compare our model with models previously shown in the literature. The obtained results can be used for effective reduction of intersymbol interference, for instance, using a predistorter, a nonlinear equalizer, or digital waveform shaping, to extend approaches like in Refs. [7,25–27].
2. LED MODELS FOR COMMUNICATIONS
A variety of models are used in communications, but their foundation in semiconductor physics has been relatively limited. The term, intensity-modulated direct-detection (IM/DD)channel, is often used to distinguish LEDs that modulate the intensity of the photon flow from coherent phase and quadrature modulation possible with lasers. The non-negativity of the photon flux requires a nonzero signal while most communications signals also take negative values. Non-negativity causes the fundamental expressions by Shannon for the AWGN channel to no longer apply. In 1971, a peak limitation also was modeled, as excessive currents could damage the LED after a thermal runaway [28]. This channel model, which sees the LED as a linear, instantaneous conversion from current into light intensity in a specific, but hard-limited range, remained popular in information theory. It was used to optimize probability distributions of signals. However, it is doubtful whether hard clipping of the light output is still a realistic model. Particularly, we increasingly see that LEDs are no longer operated near their maximum tolerable power levels, but rather near their most efficient current setting, which is safely far below thermal breakdown.
Other models focus on the profound low-pass nature of the LED junction, as this was recognized to be the dominant limiting factor in the bit rates achieved in visual light communication (VLC) systems. The low-pass characteristic has been modeled as a linear time-invariant (LTI) filtering [29] and its time constant is on the order of magnitude of the radiative recombination time [30], or as communications engineers see it, the RC time constant of the junction capacitance and the dynamic resistance of the LED.
To increase the LED speed, techniques were developed to electrically compensate the low-pass behavior [31]; for instance, by using a pre-emphasis, a.k.a. a bandwidth extension. However, interpreted from an information–theoretical point of view, boosting high-frequency modulation can be counterproductive: it requires a power backoff to accommodate signal peaks and reduces the overall signal-to-noise ratio (SNR) [32]. Optimally, modulation strategies accept the low-pass nature of the LED and maximize the achievable throughput using Lagrangian (“waterfilling”) theories to exploit the channel where it performs best, but nonetheless modulate the LED far beyond its 3 dB bandwidth.
Analytical expressions are now known for the throughput of noise-limited, low-pass channels [32]. These approaches mostly assume a linear channel. The LED nonlinearity has been addressed as a separate memoryless effect using a polynomial current-to-light curve [33,34]; in other words, where the output of nonlinear block only depends on the current input and nonlinearity does not involve memory effects. The Wiener [35] and Hammerstein [36] model includes a linear time-invariant (LTI) filter (low-pass filter) concatenated with such a separate memoryless nonlinearity. Yet, the LED exhibits not only instantaneous nonlinear effects, but also shows a dependency on the charge built up and the hole electron flows in the (recent) past status [25]. A generic approach has been based on the Volterra series [25,37–39]. In a Volterra model, a memory of length leads to as many as coefficients for the th kernel function [25,40]. Its complexity can lead to practical problems. A memory polynomial model that reduces complexity was initially proposed for signal predistortion in the power amplifier (PA) [41,42], and it was recently considered for a pre-distorter (post-distorter) in VLC [36,43]. The Wiener [35] and Hammerstein [36] models can be seen as an overly simplified subset of the Volterra model. Yet, a too heavily pruned and truncated Volterra series and memory polynomial models do not necessarily accurately model real LEDs.
Eye diagrams are a popular way to study intersymbol interference caused by frequency selectivity and nonlinearities. Refs. [7,8,18,44] consistently show slower LED responses at lower signal levels and differences between rise and fall times, which cannot be explained by the simplified models above. As discussed in Ref. [7], the LTI low-pass model can only predict equal signal level spacings, equal eye openings at all levels, equal fall and rise times, and a well-defined optimum sampling moment. On the other hand, a memoryless polynomial nonlinear channel can model different signal levels, but neither an unequal rise and fall time nor a right skew. Combining these two into a cascade, the Wiener model assumes an LTI low-pass filter followed by a memoryless nonlinearity. This can model the different signal level spacings at the receiver, but cannot account for different time constants during the rise and fall ramp and cannot explain the signal-level dependent location of the timing at which the eye opening is largest. Similarly, the Hammerstein model, which starts with a memoryless nonlinearity followed by an LTI system, fails to capture any dynamic nonlinearities that are subject to hole electron charge memory in the LED junction. Experimentally, we found that the Wiener and Hammerstein models visually give almost the same eye diagram. Although sophisticated models such as the Volterra-based model can, to a large extent, model the closure and signal-level dependent timing shift (right-skew) in the eye, it allows more degrees of freedom than physically justified. Coefficient estimation and compensation can become faster, easier, and less power-consuming with physics-based, low-complexity models with just the essential parameters.
We believe that there is room to improve communications systems by modeling the LED response more realistically, exploiting the hole–electron recombination models. However, these must be mapped into an appropriate framework, suitable for probing via signals compatible with a running communications signaling system. In the next section, we review the dynamic response of LEDs to improve communications modeling.
3. DYNAMIC PHOTON GENERATION MODELS
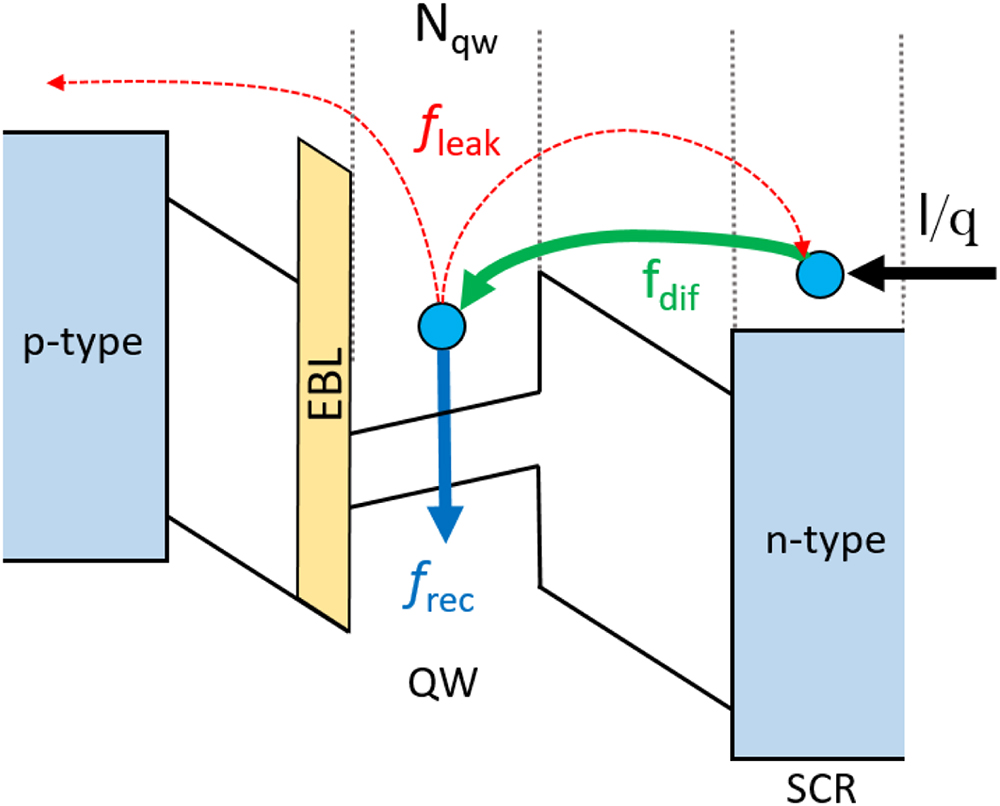
Figure 1.Model of the
The small-signal analysis technique was shown to be a powerful tool to characterize semiconductor devices such as LEDs and laser diodes [46–50]. The work of David
We use a rate equation to describe the carrier dynamics inside a junction and connect it to the light output. Our modeling of the rate equations is subject to the following simplifications: we do not consider SCR transport phenomena to introduce any latency, based on findings from the small-signal analysis. We neglect any recombination in the SCR and GaN cladding layers, as these regions contain significantly lower carrier concentrations. We model the MQW structure as a single equivalent QW. This is reasonable because carrier transient times between the QWs in a GaN MQW structure have been reported to be in the range of a femtosecond [52,53] in InGaN/GaN LEDs. This is significantly faster than the characteristic times of the carrier recombination and of the QW escape processes. Thus, we may neglect the carrier transport between the QWs and can see the MQW structure as equivalent to a singular effective QW. We assume a uniform carrier distribution in this QW. We assume the populations of the electrons and holes to be equal and we use a single-particle rate equation modeling approach, similar to Ref. [51].
Designating the total population of carriers in the effective QW as , we obtain the following rate equation for the QW population
A. Recombination
![]()
Figure 2.Schematic diagram illustrating dominant recombination mechanisms.
The linear -term is SRH, covering the process of an electron passing through a localized energy state (a so-called trap) between the valence and the conduction bands related to a defect in a crystal lattice. The energy is typically released in form of a phonon (i.e., a crystal lattice vibration). The rate of SRH recombination is linearly proportional to (the first power of) the carrier population in the QW ; thus, it is dominant at low injection currents.
Bimolecular recombination requires two particles: one electron and one hole. An electron directly recombines with a hole while the difference in energy releases as a photon. This recombination mechanism is the only one that results in light emission. Two particles must be present in the vicinity of each other for this recombination to occur. Thus, the rate of this process is proportional to and it is the dominant mechanism at medium currents. The total light output power is , where is the energy per photon.
Finally, Auger recombination requires three particles. In the case of an Auger recombination, an electron and a photon recombine and the released energy is absorbed by a third carrier; hence, the third power in the -term. As a result, the third carrier moves to a higher energy state within the same band. Thus, no light is emitted during an Auger recombination. The Auger recombination rate becomes significant at high bias currents and is considered to be one of the major reasons for LED efficiency droop.
Traditionally, in literature devoted to modeling of the dynamic light output, the recombination rates corresponding to these different channels are estimated based on the assumptions of the QW thickness, its volume, and the characteristic rates of the recombination processes. These physical estimations are not reliable since none of these parameters can be measured directly. Moreover, we are interested in building a model that can be used by self-adjusting communications algorithms in mass market communications equipment, without factory calibration, that have to estimate (varying) parameters in real-time in the field. This prohibits the use of properties and dimensions of the active region structures that are subject to process spread. Thus, instead of the carrier concentration and the QW volume traditionally used in literature, we use the total number of the carriers. In other words, our ABC parameters define the total rates of carrier recombination and leakage in the whole active region.
B. Leakage
The carrier leakage rate in the active region is caused by multiple mechanisms such as thermionic emission and carrier overflow, but also many other effects. In scientific literature, there are still ongoing investigations and different mechanisms are seen as the dominant effect [55]. Nevertheless, in a formal approach these can be expanded into a Taylor series of [56,57],
4. MODEL PARAMETER CHARACTERIZATION
Neither the carrier recombination rate nor the active region leakage rate nor the QW carrier population can be directly measured in practice. Thus, we use a combination of steady-state measurements of light conversion efficiency and dynamic measurements of 3 dB small-signal modulation response to estimate the , , and parameters defining these values. In this section, we discuss an implementation of how these parameters can be derived in a laboratory environment. Section 6 discusses possible in-field implementations for communications systems. We consider the possible usage of an inexpensive, unobtrusive light intensity detector at the communications transmitter.
The internal quantum efficiency (IQE) is defined by the fraction of the injected carriers that is converted into photons. Therefore, it equals the ratio between the radiative recombination rate and the total recombination and leakage rate, and can be written as
The normalized and ratios can easily be obtained from versus measurements. can be obtained either by a least-square fitting of Eq. (10) or by plotting the ratio versus and approximating the plot by a linear function toward the vertical axis [61]. The interception point will define the maximum IQE. By definition, in Eq. (8), the quality factor relates the , , and parameters to each other. As can be estimated, we have to find two more independent equations that relate these parameters to estimate all unambiguously.
We refer to the work of Ryu
A useful equation connecting and is derived from Eqs. (8) and (11):
A further independent equation is obtained from the differential carrier lifetime analysis. The differential lifetime is defined as . Thus, following the reinterpreted model in Eq. (4),
However, it is not directly related to the previously discussed and . Schiavon
![]()
Figure 3.Schematic diagram of the measurement system.
We use a high-bandwidth oscilloscope to monitor the photodiode output signal, the LED modulation, and bias currents. The emitter current, as sensed across the sense resistor, is passed through a filter and fed to the inverting input of an operational amplifier. On the noninverting input of the operation amplifier, the desired modulation signal is applied. Furthermore, the operational amplifier has a frequency-limiting arrangement to ensure a smooth roll-off at approximately 200 MHz. The optical signal is detected by a photodetector (C12702 series, Hamamatsu Photonics KK, Hamamatsu, Japan), equipped with a silicon photodiode (Si APD) and a preamplifier.
The steady-state efficiency dependence on the current was measured with an integration sphere. The LED junction temperature is controlled by a thermostat. Preliminary junction-to-case thermal resistance measurements were performed to ensure precise junction temperature control at any bias current. In all of the discussed experiments, we set the junction temperature to 50°C. The thermal resistance measurements and temperature control were done in accordance with the JESD51 series of standards.
5. RESULTS
A. Numerical Model Parameter Extraction
![]()
Figure 4.Normalized EQE measurement results and recombination model fits. The plots are separated by 3 dB.
![]()
Figure 5.Normalized small-signal optical response measurements and one pole low-pass filter fits. Low current measurements are shifted up by 3 dB to avoid visually overlapping curves.
We separately determine two sets of the , , and parameters for the two bias conditions. First, we use Eq. (14) to determine . Second, we employ Eqs. (8) and (12) to find and for each bias current.
The obtained parameters are practically identical with less than a 2% difference. The resulting averaged values are , , and . Further higher-order terms of the leakage rate [ with above 3] can be estimated as a difference between the measured injection rate and the sum of the total recombination and leakage rates predicted by the modified model. To also capture the residual , we fit this to a fourth-order leakage term , although this may not represent a single, specific physical mechanism. We obtain .
The resulting “” model fit is presented in Fig. 4. The results indicate that the fourth-order polynomial enhances the characterization of the LED efficiency in the droop regime. Additional higher-order terms that characterize the leakage rate (e.g., ), can be added to the model in a similar manner. Yet, we limit the leakage current expansion to a fourth-order polynomial one and assume .
B. Model Verification
To evaluate how accurately the model and its estimated parameters predict communications signals, we compare its outcome with measured signal responses. A finite-difference method analysis is applied to numerically solve the rate equation that characterizes the QW carrier population and to determine the radiative recombination rate proportional to the light intensity . We use the difference scheme
![]()
Figure 6.Stepped frequency measurement and simulation results of LED optical signal harmonic distortion. (a) Bias current 75 mA peak-to-peak sinusoidal modulation of 100 mA. (b) Bias current 150 mA peak-to-peak sinusoidal modulation of 200 mA. The horizontal axis is the frequency of the fundamental, not of the harmonic it self.
Figure 6(a) plots the harmonic content in the light output for a stepped modulation frequency with a bias current fixed at 75 mA and a sinusoidal modulation with a peak-to-peak amplitude of 100 mA. Figure 6(b) is related to a 150 mA bias current and a 200 mA peak-to-peak modulation amplitude.
Our predicted distortion in the light output signal is in a good agreement with the experimental measurements, at least at frequencies that are not too high. The deviation at higher frequencies between the experimental and simulated data in the second, but particularly the third, harmonic of the light output, as seen in Fig. 6, can be associated with imperfections in the electronics, as we also observed some harmonic distortion in the driving current. We suspect modulator imperfections are causing the discrepancy at higher frequencies. In particular, a potential explanation is that current-voltage nonlinearities may be suppressed less effectively by the response of the feedback loop [64] at these high frequencies.
At all frequencies, we see that the second harmonic is highly dominant. Moreover, we see second-order distortion appear at low modulation depths where clipping effects are insignificant. The nonlinearity from the (or model) is particularly relevant for links with a good SNR that would justify higher constellations; say, 1024 QAM and above.
The above characterization of harmonics as a function of frequency is particularly relevant to OFDM modulation. The LED model also covers intermodulation that causes intercarrier interference in OFDM.
![]()
Figure 7.Two-level pulse amplitude modulation measurements and simulation results. The experimentally measured current is used as an input for optical output simulation. The rise and the fall times are significantly different due to the nonlinear effects.
Two model variations are used to simulate light responses. The first one corresponds to Eq. (16). The second one is a reduced “BC” model with no and parameters. We observe that both the full and the reduced models provide practically identical results.
We also experimented with inclusion of the higher-order leakage terms . This enabled a better fit of the static EQE curve. However, it did not increase the accuracy of the dynamic optical response simulations. We associate this with the fact that the model is only an approximation of the complex physics inside the active region of an LED. In particular, we have postulated that the parameters do not change with the bias current, and that the populations of electrons and holes are homogeneous and equal. Both of these assumptions are approximations. Small variations of the and parameters have been reported at high bias currents [66]. The polarization field is known to separate the electrons and holes populations [67] and makes the distributions of carriers not homogeneous. Moreover, other aspects such as differences in the mobilities of holes and electrons may also affect the approach precision. All these phenomena create additional light output distortion that cannot be physically captured by the model. Thus, we conclude that the absence of further convergence of the dynamic modeling results to the measured data is primarily caused by (small) violations of the assumptions behind the model.
C. Sensitivity to Measurement Errors
The approach that we study here is relatively well conditioned. For instance, making an error of 1% in a 3 dB bandwidth estimation gives an error of approximately 1%, 2%, and 3% in , , and parameters, respectively. This translates into an error of less than 4% and 8% in the estimation of the amplitudes of the second and third harmonics, respectively. A 1% error in estimation translates to approximately 0.6%, 0.5%, and 0.3% errors in , , and parameters, respectively, and less than a 1% error in the amplitude estimations of the second and third harmonics, in the considered frequency range. Inclusion of the term can lead to a deviation of up to 30% (1.1 dB) in the estimates of the amplitudes of the second and the third harmonics primarily at low () and high modulation frequencies (say, above ). Nonetheless, this deviation remains below the modeling accuracy in these regions. As demonstrated in Fig. 6, the model mismatch can reach several dB there. Moreover, as shown in Fig. 7 and discussed in the previous paragraph, it does not increase the overall accuracy. Yet, at higher bias currents, the impact of a term may be significantly larger. As shown in Section 6, the second-order distortion from it can be effectively captured in .
6. USE IN REAL-TIME COMMUNICATIONS SYSTEMS
We have demonstrated, characterized, and verified a nonlinear model to predict the distortion in the dynamic light output. Unlike the modeling approaches that were demonstrated earlier, our method relies on a direct estimation of the parameters characterizing total recombination and leakage rates. This eliminates the errors associated with indirect estimation of the SRC, radiative, and Auger recombination rates, and the volume of the active region and other parameters commonly used in previous works based on the model-like approach [7,18]. As an example, previous works had to assume the presence of a significant level of doping in the active region to fit the model and to correctly predict the optical response, including nonlinearities. In reality, high-efficiency LEDs have an intrinsic active region, since doping atoms increase the number of defects and severely decrease the light output efficiency. Thus, previously reported models may not necessarily fit reality in the best possible way. Moreover, we demonstrate that our modeling approach, beside the recombination phenomena, also accounts for the impact of the active region carrier leakage. This ensures the property of the boundary condition independence of the model. Thus, we believe that our approach makes LED models better suited for real-time estimation to enhance the performance of communications systems.
A. Real-Time Parameter Estimation and Self-Calibration
Inside an operational communications system, an EQE measurement setup is not feasible. Therefore, we extend this method by defining an effective (remote) communications quantum efficiency , where CQE represents the ratio of the number of photons received by a remote detector over the number of carriers injected into the LED, and where represents an optical path loss between the emitter and the detector. Thus, EQE and CQE are directly related as . This enables a self-calibration for Li-Fi systems. Real-time tracking of system parameters is common practice in mobile communications where the (linear) propagation channel response changes rapidly and adaptive equalizers must compensate for it. However, it is not yet a common practice to estimate nonlinear LED parameters. We believe that this is nonetheless feasible and can improve OWC performance [8]. Dynamic tracking of LED properties may be required due to changes in temperature that influence the recombination and leakage processes and drift, due to the aging of an LED. The self-calibration procedure can be summarized as the following sequence.
A number of practical issues may arise during execution of the proposed method. For example, the presence of the ambient light may significantly decrease the accuracy of the low light output measurements required to precisely characterize the CQE around point and perform the fit. To overcome this problem, first we reduce the complexity of the model by omitting the insignificant parameters. Second, we propose an alternative characterization procedure suitable for the reduced model. The procedure is based on a pair of small-signal 3 dB bandwidth measurements performed at different bias currents.
B. Model Reduction
The model is built by using the underlying physics as a basis. The demonstrated uniqueness of the parameter estimation enables analysis of the significance of the impact of various mechanisms on the accuracy of the nonlinear light output modeling. Radiative and Auger recombination mechanisms are two of the most dominant under the recommended bias current conditions for blue GaN LEDs. Thus, we expect the and coefficients of the model to have the most impact on the optical bandwidth and the linearity of the light output. Indeed, the simulation results in Fig. 7 demonstrate that a truncated model with and parameters equally predicts the light output distortion accurately. The truncated model was also used to repeat the simulations presented in Fig. 6. Similar to the case of PAM, the truncated model provides practically identical results for the harmonic distortion evaluation.
![]()
Figure 8.Discrete-time model for QW carrier dynamics used for simulation of the large-signal light output.
![]()
Figure 9.DC-biased model for light output modulation and carrier concentration variations
The exclusion of the parameter out of the model has two main prerequisites. First, the parameter defines the linear component of the leakage and recombination rates dependence on , so it does not directly contribute to the generation of harmonics. Second, the fraction of the SRH recombination rate is relatively low at nominal operational currents of the GaN LEDs. Therefore, the BC model describes the light output with sufficient accuracy. For instance, the BC model predicts the 3 dB bandwidth with an error of less than 0.5% (compared to the ABC model) for a forward current above 75 mA. This is significantly below the expected accuracy of the estimation of the bandwidth in-field. Moreover, numerical experiments reveal that error of the reduced model for a two-level PAM (250 mA and 0.25 mA, 0.998 depth) 3 MHz is below 0.5% of the absolute value, after amplitude normalization (below 1.5% without it) compared to the full ABC model. This observation enables straightforward in-field calibration.
C. Reduced Model Self-Calibration
We have shown that just the and coefficients of the model are enough to predict the nonlinearity around a nominal bias current setting. In other words, a communications system can estimate in real-time the LED channel response and correspondingly operate a nonlinear equalizer or a distortion compensator. We use a steady-state solution of Eqs. (1) and (4) and the definition of the differential carrier lifetime and 3 dB optical response bandwidth, in Eqs. (13) and (15). Assuming , the forward current and the optical 3 dB cutoff frequency of a small-signal modulation are determined, respectively, as
D. DC-Biased Communications
Figure 8 describes an unbiased discrete-time equivalent large-signal LED model. However, most communications systems use a DC bias to linearize the response and to allow not only positive but also negative modulation signals. Spitting , normalizing amperes to electrons per sampling interval by multiplying by , and splitting reveals small-signal filter taps. In the feedback channel, the low-pass nature is reflected in the linear feedback term , which leads to a 3 dB attenuation at and which shifts upward with larger biases , thus a larger . The dominant nonlinear tap is the second-order , followed by the cubic term of . The feedforward channel has a linear path and a squaring path , as shown in Fig. 9.
The model that we verify here can be inverted in a communications system to suppress distortion. Anticipating the verification of the LED model, which is the focus of this paper, nonlinear equalizers inspired on similar structures are being tested, but that is out of the scope of this paper. Very recently, in Ref. [68] Mardani
E. Modeling Limitations
The , , and parameters of the modified ABC model incorporate leakage current terms. Therefore, this model is appropriate only if the characteristic times of the recombination and leakage processes remain constant. Carrier thermionic escape is one of the main contributors to leakage current. According to the standard theory of thermionic emission, the thermionic escape current over a QW barrier can be written as [69]
![]()
Figure 10.Schematic band diagram of QW carrier energy distribution. (a) Forward biased
F. Compensation in Communications Systems
![]()
Figure 11.OOK (2-PAM) using raised-cosine pulse shaping with roll-off of 0.25 at 100 Msymbols/s. The targeted light output, indicated by the current input to the predistorter (black), is positive, and the lowest point is around 10% above 0. Blue curve: predistorted LED current.
PAM pre-emphasis techniques accelerate the LED response by inverting the low-pass nature. These may lead to negative current spurts during a negative signal ramp. If a large negative current pulse depletes the junction and eliminates the voltage over a p-n juntion, it increases the thermionic escape current and causes a carrier sweep-out [71]. The sweep-out characteristic time can be much shorter than the carrier lifetime [30]. The proposed model should be used with caution for OOK systems enabled with pre-emphasis in which the off level is taken too close to a zero light output. Our model loses accuracy if the carrier charge in the LED junction drops below the turn-on threshold during a negative current spike. Nonetheless, we believe that our model is more realistic than commonly used models described in Section 2.
In fact, the LED model can be inverted to create a pre-distorter that not only pre-emphasizes the signal to compensate for the linear low-pass behavior, but also to precompensate the LED nonlinearity [7]. For OOK at 100 Msymbols/s over an LED with a bandwidth around 20 MHz, Fig. 11 simulates how a pulse-shaped OOK (2-PAM) light output can be created by adapting the current into the LED.
OFDM communications systems that build upon our modeling insights may attempt to compensate for the low-pass filtering and/or for the distortion. This can be done at the transmitter and/or at the receiver [7,8,18,21,22,25,32,36–39,68]. Pre-emphasis boosts high frequencies at the transmitter. However, Ref. [32] shows that a waterfilling optimization gives a higher throughput than a pre-emphasis, because it places most signal power at lower frequencies, where the LED response is best. If pre-emphasis is nonetheless used, large, but short, negative current spikes may occur. However, these high-frequency (thus short) sweep-out current spikes, hardly change the carrier concentrations (or the voltage) in the p-n juntion. Therefore, we believe that our model remains appropriate as long as the root mean square swing of is much smaller than , which is required in direct current-biased OFDM (DCO-OFDM) to avoid clipping the Gaussian, thus a peaky signal.
G. Infrared LEDs
Infrared high-efficiency LEDs are commonly used for OWC. The model proposed in this article is also generally valid for this type of LEDs due to the similar physics involved. Nonetheless, there are a number of differences between the blue and infrared LEDs in the properties of the active region materials. While the same approach and procedure can be used, we expect different parameter values. In particular, for infrared LEDs, the Auger recombination is not expected to have a major effect [72,73]. Moreover, defects and nonradiative centers play a more pronounced role by increasing the nonradiative SRH recombination [72], thus increasing and coefficients. At the same time, quantum wells are often not so deep. This increases the effect of thermal ionization of carriers in QW [69] (higher thermionic escape rate). It supposedly yields higher , , parameters. On the contrary, piezoelectric polarization field effects are absent in the AlGaInP/AlInP/GaAs LEDs. For this reason, the model parameters should be more stable with a change in the QW carrier concentration.
In a nutshell, for infrared LEDs, is expected to have a larger impact, while the effect of is expected to be significantly reduced compared to GaN-based LEDs. Thus, a model for the infrared LEDs can potentially omit the term. The reduced model might consist of components related to and and be accurate in the whole current range. Nonetheless, empirical verification is required to determine the model fit and accuracy for this case.
7. CONCLUSIONS
We have proposed and demonstrated the feasibility of a method to model and quantify the dynamic nonlinear optical response for high-efficiency LEDs. We reinterpreted the ABC approach. It enables simultaneous simulation of two competing processes that jointly characterize the carrier lifetime in the active region: carrier recombination and carrier leakage. A practical extraction procedure of the model parameters is demonstrated. The extraction procedure ensures an unambiguous characterization of the model parameters and ensures the boundary condition independence of the model.
We have experimentally validated the proposed approach for dynamic light output modeling. As an example, a blue illumination LED has been characterized. The harmonic distortion for a wide range of frequencies and signal level transients in PAM was simulated, based on the extracted model parameters. The simulation results were shown to be in excellent agreement with the light output measurements.
We show that, for a case of blue GaN LEDs, the linear term of the ABC model can be reduced without a significant loss of accuracy. The reduction enables a straightforward estimation of the remaining parameters based on two measurements of small-signal optical responses at different bias current levels.
We believe these results can be used for effective reduction of intersymbol and intercarrier interference, using, for instance, pre-distortion, equalization, and digital waveform shaping. Such communications-enhancing algorithms critically depend on having a sufficiently accurate, yet computationally simple model.
Acknowledgment
Acknowledgment. This research received funding from the European Union’s Horizon 2020 research and innovation program through the H2020 ECSEL project Delphi4LED, the National Natural Science Foundation of China, and the H2020 project, Enhance Lighting for the Internet of Things (ELIoT).
References
[1] J. B. Carruthers. Wireless infrared communications. Wiley Encyclopedia of Telecommunications(2003).
[2] M. Kavehrad. Sustainable energy-efficient wireless applications using light. IEEE Commun. Mag., 48, 66-73(2010).
[3] T. Komine, M. Nakagawa. Fundamental analysis for visible-light communication system using LED lights. IEEE Trans. Consum. Electron., 50, 100-107(2004).
[4] H. Haas. High-speed wireless networking using visible light. SPIE Newsroom(2013).
[5] L. Hanzo, H. Haas, S. Imre, D. O’Brien, M. Rupp, L. Gyongyosi. Wireless myths, realities, and futures: from 3G/4G to optical and quantum wireless. Proc. IEEE, 100, 1853-1888(2012).
[6] R. Windisch, A. Knobloch, M. Kuijk, C. Rooman, B. Dutta, P. Kiesel, G. Borghs, G. H. Dohler, P. Heremans. Large-signal-modulation of high-efficiency light-emitting diodes for optical communication. IEEE J. Quantum Electron., 36, 1445-1453(2000).
[7] X. Deng, S. Mardanikorani, Y. Wu, K. Arulandu, B. Chen, A. M. Khalid, J.-P. M. G. Linnartz. Mitigating LED nonlinearity to enhance visible light communications. IEEE Trans. Commun., 66, 5593-5607(2018).
[8] J.-P. M. G. Linnartz, X. Deng, A. Alexeev, S. Mardanikorani. Wireless communication over an LED channel. IEEE Commun. Mag., 58, 77-82(2020).
[9] C. Lee, C. Shen, H. M. Oubei, M. Cantore, B. Janjua, T. K. Ng, R. M. Farrell, M. M. El-Desouki, J. S. Speck, S. Nakamura, B. S. Ooi, S. P. DenBaars. 2 Gbit/s data transmission from an unfiltered laser-based phosphor-converted white lighting communication system. Opt. Express, 23, 29779-29787(2015).
[10] I. Dursun, C. Shen, M. R. Parida, J. Pan, S. P. Sarmah, D. Priante, N. Alyami, J. Liu, M. I. Saidaminov, M. S. Alias, A. L. Abdelhady, T. K. Ng, O. F. Mohammed, B. S. Ooi, O. M. Bakr. Perovskite nanocrystals as a color converter for visible light communication. ACS Photon., 3, 1150-1156(2016).
[11] D. C. O’Brien, L. Zeng, H. Le-Minh, G. Faulkner, J. W. Walewski, S. Randel. Visible light communications: challenges and possibilities. IEEE International Symposium on Personal, Indoor and Mobile Radio Communications (PIMRC), 1-5(2008).
[12] H. Chun, P. Manousiadis, S. Rajbhandari, D. A. Vithanage, G. Faulkner, D. Tsonev, J. J. D. McKendry, S. Videv, E. Xie, E. Gu, M. D. Dawson, H. Haas, G. A. Turnbull, I. D. W. Samuel, D. C. O’Brien. Visible light communication using a blue GaN μLED and fluorescent polymer color converter. IEEE Photon. Technol. Lett., 26, 2035-2038(2014).
[13] M. T. Sajjad, P. P. Manousiadis, H. Chun, D. A. Vithanage, S. Rajbhandari, A. L. Kanibolotsky, G. Faulkner, D. Obrien, P. J. Skabara, I. D. Samuel, G. A. Turnbull. Novel fast color-converter for visible light communication using a blend of conjugated polymers. ACS Photon., 2, 194-199(2015).
[14] G. M. Farinola, R. Ragni. Electroluminescent materials for white organic light emitting diodes. Chem. Soc. Rev., 40, 3467-3482(2011).
[15] H. L. Minh, Z. Ghassemlooy, D. O’Brien, G. Faulkner. Indoor gigabit optical wireless communications: challenges and possibilities. 12th International Conference on Transparent Optical Networks (ICTON), 1-6(2010).
[16] J. Grubor, S. Lee, K. Langer. Wireless high-speed data transmission with phosphorescent white light LEDs. 33rd European Conference and Exhibition of Optical Communication (ECOC), 3-4(2007).
[17] Z. Ghassemlooy, S. Arnon, M. Uysal, Z. Xu, J. Cheng. Emerging optical wireless communications-advances and challenges. IEEE J. Sel. Areas Commun., 33, 1738-1749(2015).
[18] M. Strassburg, S. Mardani, J. K. Kim, A. Alexeev, M. R. Krames, J.-P. Linnartz. Modeling and compensating dynamic nonlinearities in LED photon-emission rates to enhance OWC. Light-Emitting Devices, Materials, and Applications, 30(2019).
[19] S. Mardani, A. Khalid, F. M. Willems, J.-P. Linnartz. Effect of blue filter on the SNR and data rate for indoor visible light communication system. European Conference on Optical Communication (ECOC), 1-3(2017).
[20] S. Mardani, J.-P. Linnartz. Capacity of the first-order low-pass channel with power constraint. Symposium on Information Theory and Signal Processing in the Benelux, 1-6(2020).
[21] S. Mardani, X. Deng, J.-P. Linnartz. Efficiency of power loading strategies for visible light communication. IEEE Globecom Workshops, 1-6(2019).
[22] D. Bykhovsky, S. Arnon. An experimental comparison of different bit-and-power-allocation algorithms for DCO-OFDM. J. Lightwave Technol., 32, 1559-1564(2014).
[23] H. Elgala, R. Mesleh, H. Haas, B. Pricope. OFDM visible light wireless communication based on white LEDs. IEEE Vehicular Technology Conference, 2185-2189(2007).
[24] J. Armstrong. OFDM for optical communications. J. Lightwave Technol., 27, 189-204(2009).
[25] K. Ying, Z. Yu, R. J. Baxley, H. Qian, G. K. Chang, G. T. Zhou. Nonlinear distortion mitigation in visible light communications. IEEE Wireless Commun., 22, 36-45(2015).
[26] P. A. Haigh, Z. Ghassemlooy, S. Rajbhandari, I. Papakonstantinou, W. Popoola. Visible light communications: 170 Mb/s using an artificial neural network equalizer in a low bandwidth white light configuration. J. Lightwave Technol., 32, 1807-1813(2014).
[27] S. Dimitrov, H. Haas. Information rate of OFDM-based optical wireless communication systems with nonlinear distortion. J. Lightwave Technol., 31, 918-929(2013).
[28] J. G. Smith. The information capacity of amplitude and variance constrained scalar Gaussian channels. Inf. Control, 18, 203-219(1971).
[29] C. Chow, C. Yeh, Y. Liu, Y. Liu. Digital signal processing for light emitting diode based visible light communication. IEEE Photon. Soc. Newslett., 26, 9-13(2012).
[30] E. F. Schubert. Light-Emitting Diodes(2006).
[31] D. Kwon, S. Yang, S. Han. Modulation bandwidth enhancement of white-LED-based visible light communications using electrical equalizations. Proc. SPIE, 9387, 93870T(2015).
[32] S. Mardanikorani, X. Deng, J.-P. M. G. Linnartz. Sub-carrier loading strategies for DCO-OFDM LED communication. IEEE Trans. Commun., 68, 1101-1117(2020).
[33] H. Elgala, R. Mesleh, H. Haas. Predistortion in optical wireless transmission using OFDM. 9th International Conference on Hybrid Intelligent Systems (HIS), 184-189(2009).
[34] I. Neokosmidis, T. Kamalakis, J. W. Walewski, B. Inan, T. Sphicopoulos. Impact of nonlinear LED transfer function on discrete multitone modulation: analytical approach. J. Lightwave Technol., 27, 4970-4978(2009).
[35] M. Schetzen. Nonlinear system modeling based on the Wiener theory. Proc. IEEE, 69, 1557-1573(1981).
[36] H. Qian, S. Yao, S. Cai, T. Zhou. Adaptive postdistortion for nonlinear LEDs in visible light communications. IEEE Photon. J., 6, 7901508(2014).
[37] G. Zhang, J. Zhang, X. Hong, S. He. Low-complexity frequency domain nonlinear compensation for OFDM based high-speed visible light communication systems with light emitting diodes. Opt. Express, 25, 3780-3794(2017).
[38] T. Kamalakis, J. W. Walewski, G. Mileounis. Empirical Volterra-series modeling of commercial light-emitting diodes. J. Lightwave Technol., 29, 2146-2155(2011).
[39] G. Stepniak, J. Siuzdak, P. Zwierko. Compensation of a VLC phosphorescent white LED nonlinearity by means of Volterra DFE. IEEE Photon. Technol. Lett., 25, 1597-1600(2013).
[40] Z. Peng, C. Cheng. Volterra series theory: a state-of-the-art review. Chin. Sci. Bull., 60, 1874-1888(2015).
[41] J. Kim, K. Konstantinou. Digital predistortion of wideband signals based on power amplifier model with memory. Electron. Lett., 37, 1417-1418(2001).
[42] L. Ding, G. T. Zhou, D. R. Morgan, Z. Ma, J. S. Kenney, J. Kim, C. R. Giardina. A robust digital baseband predistorter constructed using memory polynomials. IEEE Trans. Commun., 52, 159-165(2004).
[43] W. Zhao, Q. Guo, J. Tong, J. Xi, Y. Yu, P. Niu, X. Sun. Orthogonal polynomial-based nonlinearity modeling and mitigation for LED communications. IEEE Photon. J., 8, 7905312(2016).
[44] M. Kong, Y. Chen, R. Sarwar, B. Sun, Z. Xu, J. Han, J. Chen, H. Qin, J. Xu. Underwater wireless optical communication using an arrayed transmitter/receiver and optical superimposition-based PAM-4 signal. Opt. Express, 26, 3087-3097(2018).
[45] Y. Huang, Z. Liu, X. Yi, Y. Guo, S. Wu, G. Yuan, J. Wang, G. Wang, J. Li. Overshoot effects of electron on efficiency droop in InGaN/GaN MQW light-emitting diodes. AIP Adv., 6, 045219(2016).
[46] T. P. Lee. Effect of junction capacitance on the rise time of LED’s and on the turn-on delay of injection lasers. Bell Syst. Tech. J., 54, 53-68(1975).
[47] R. S. Tucker, D. J. Pope. Circuit modeling of the effect of diffusion on damping in a narrow-stripe semiconductor laser. IEEE J. Quantum Electron., 19, 1179-1183(1983).
[48] R. Nagarajan, M. Ishikawa, T. Fukushima, R. S. Geels, J. E. Bowers. High speed quantum-well lasers and carrier transport effects. IEEE J. Quantum Electron., 28, 1990-2008(1992).
[49] S. Weisser, I. Esquivias, P. J. Tasker, J. D. Ralston, B. Romero, J. Rosenzweig. Impedance characteristics of quantum-well lasers. IEEE Photon. Technol. Lett., 6, 1421-1423(1994).
[50] I. Esquivias, S. Weisser, B. Romero, J. Ralston, J. Rosenzweig. Carrier dynamics and microwave characteristics of GaAs-based quantum-well lasers. IEEE J. Quantum Electron., 35, 635-646(1999).
[51] A. David, C. A. Hurni, N. G. Young, M. D. Craven. Carrier dynamics and Coulomb-enhanced capture in III-nitride quantum heterostructures. Appl. Phys. Lett., 109, 033504(2016).
[52] D. Sizov, R. Bhat, A. Zakharian, K. Song, D. Allen, C. Zah. Impact of carrier transport on aquamarine–green laser performance. Appl. Phys. Express, 3, 122101(2010).
[53] S. Hammersley, M. J. Davies, P. Dawson, R. A. Oliver, M. J. Kappers, C. J. Humphreys. Carrier distributions in InGaN/GaN light-emitting diodes. Phys. Status Solidi B, 252, 890-894(2015).
[54] S. Karpov. ABC-model for interpretation of internal quantum efficiency and its droop in III-nitride LEDs: a review. Opt. Quantum Electron., 47, 1293-1303(2009).
[55] R. Stevenson. The LED’s dark secret. IEEE Spectr., 46, 26-31(2009).
[56] M. A. Hopkins, D. W. Allsopp, M. J. Kappers, R. A. Oliver, C. J. Humphreys. The ABC model of recombination reinterpreted: impact on understanding carrier transport and efficiency droop in InGaN/GaN light emitting diodes. J. Appl. Phys., 122, 234505(2017).
[57] Q. Dai, Q. Shan, J. Wang, S. Chhajed, J. Cho, E. F. Schubert, M. H. Crawford, D. D. Koleske, M.-H. Kim, Y. Park. Carrier recombination mechanisms and efficiency droop in GaInN/GaN light-emitting diodes. Appl. Phys. Lett., 97, 133507(2010).
[58] P. Prajoon, D. Nirmal, M. A. Menokey, J. C. Pravin. Temperature-dependent efficiency droop analysis of InGaN MQW light-emitting diode with modified ABC model. J. Comput. Electron., 15, 1511-1520(2016).
[59] J. M. Shah, Y. L. Li, T. Gessmann, E. F. Schubert. Experimental analysis and theoretical model for anomalously high ideality factors (n ≫ 2.0) in AlGaN/GaN p-n junction diodes. J. Appl. Phys., 94, 2627-2630(2003).
[60] D. Zhu, J. Xu, A. N. Noemaun, J. K. Kim, E. F. Schubert, M. H. Crawford, D. D. Koleske. The origin of the high diode-ideality factors in GaInN/GaN multiple quantum well light-emitting diodes. Appl. Phys. Lett., 94, 081113(2009).
[61] I. E. Titkov, S. Y. Karpov, A. Yadav, V. L. Zerova, M. Zulonas, B. Galler, M. Strassburg, I. Pietzonka, H.-J. Lugauer, E. U. Rafailov. Temperature-dependent internal quantum efficiency of blue high-brightness light-emitting diodes. IEEE J. Quantum Electron., 50, 911-920(2014).
[62] H. Y. Ryu, H. S. Kim, J. I. Shim. Rate equation analysis of efficiency droop in InGaN light-emitting diodes. Appl. Phys. Lett., 95, 081114(2009).
[63] D. Schiavon, M. Binder, M. Peter, B. Galler, P. Drechsel, F. Scholz. Wavelength-dependent determination of the recombination rate coefficients in single-quantum-well GaInN/GaN light emitting diodes. Phys. Status Solidi B, 250, 283-290(2013).
[64] K. Arulandu, J.-P. M. G. Linnartz, X. Deng. Enhanced visible light communication modulator with dual feedback control. IEEE J. Emerging Sel. Top. Power Electron., 9, 123-137(2019).
[65] X. Deng, K. Arulandu, Y. Wu, S. Mardanikorani, G. Zhou, J.-P. M. G. Linnartz. Modeling and analysis of transmitter performance in visible light communications. IEEE Trans. Veh. Technol., 68, 2316-2331(2019).
[66] A. David, M. J. Grundmann. Droop in InGaN light-emitting diodes: a differential carrier lifetime analysis. Appl. Phys. Lett., 96, 103504(2010).
[67] K. A. Bulashevich, O. V. Khokhlev, I. Y. Evstratov, S. Y. Karpov. Simulation of light-emitting diodes for new physics understanding and device design. Proc. SPIE, 8278, 827819(2012).
[68] S. Mardanikorani, X. Deng, J.-P. M. G. Linnartz, A. Khalid. Compensating dynamic nonlinearities in LED photon emission to enhance optical wireless communication. IEEE Trans. Veh. Technol., 70, 1317-1331(2021).
[69] H. Schneider, K. V. Klitzing. Thermionic emission and Gaussian transport of holes in a GaAs/Al
[70] A. M. Fox, D. A. B. Miller, G. Livescu, J. E. Cunningham, W. Y. Jan. Quantum well carrier sweep out: relation to electroabsorption and exciton saturation. IEEE J. Quantum Electron., 27, 2281-2295(1991).
[71] P. H. Binh, V. D. Trong, P. Renucci, X. Marie. Improving OOK modulation rate of visible LED by peaking and carrier sweep-out effects using n-Schottky diodes-capacitance circuit. J. Lightwave Technol., 31, 2578-2583(2013).
[72] J. H. Park, J. W. Lee, D. Y. Kim, J. Cho, E. F. Schubert, J. Kim, J. Lee, Y.-I. Kim, Y. Park, J. K. Kim. Variation of the external quantum efficiency with temperature and current density in red, blue, and deep ultraviolet light-emitting diodes. J. Appl. Phys., 119, 023101(2016).
[73] H. Fu, Y. Zhao. Efficiency droop in GaInN/GaN LEDs. Nitride Semiconductor Light-Emitting Diodes (LEDs): Materials, Technologies, and Applications, 299-325(2017).

Set citation alerts for the article
Please enter your email address
© Copyright 2018-2021 | Chinese Laser Press. All Rights Reserved 沪ICP备15018463号-20