
Ye Zheng, Lianzhong Deng, Jianping Li, Tianqing Jia, Jianrong Qiu, Zhenrong Sun, Shian Zhang. Controlling multiphoton excited energy transfer from Tm3+ to Yb3+ ions by a phase-shaped femtosecond laser field[J]. Photonics Research, 2019, 7(4): 486
- Photonics Research
- Vol. 7, Issue 4, 486 (2019)
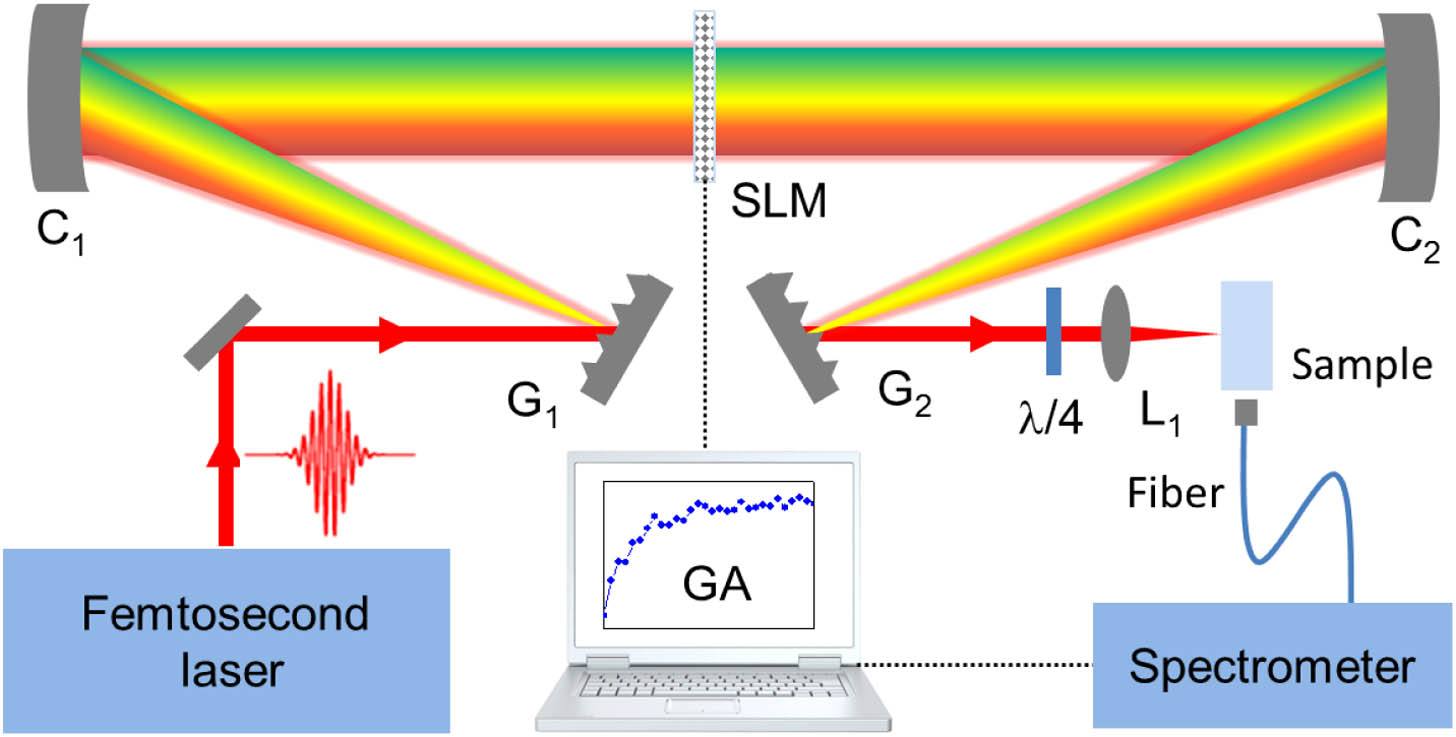
Fig. 1. Schematic of the experimental setup. G 1 G 2 C 1 C 2 λ / 4 L 1
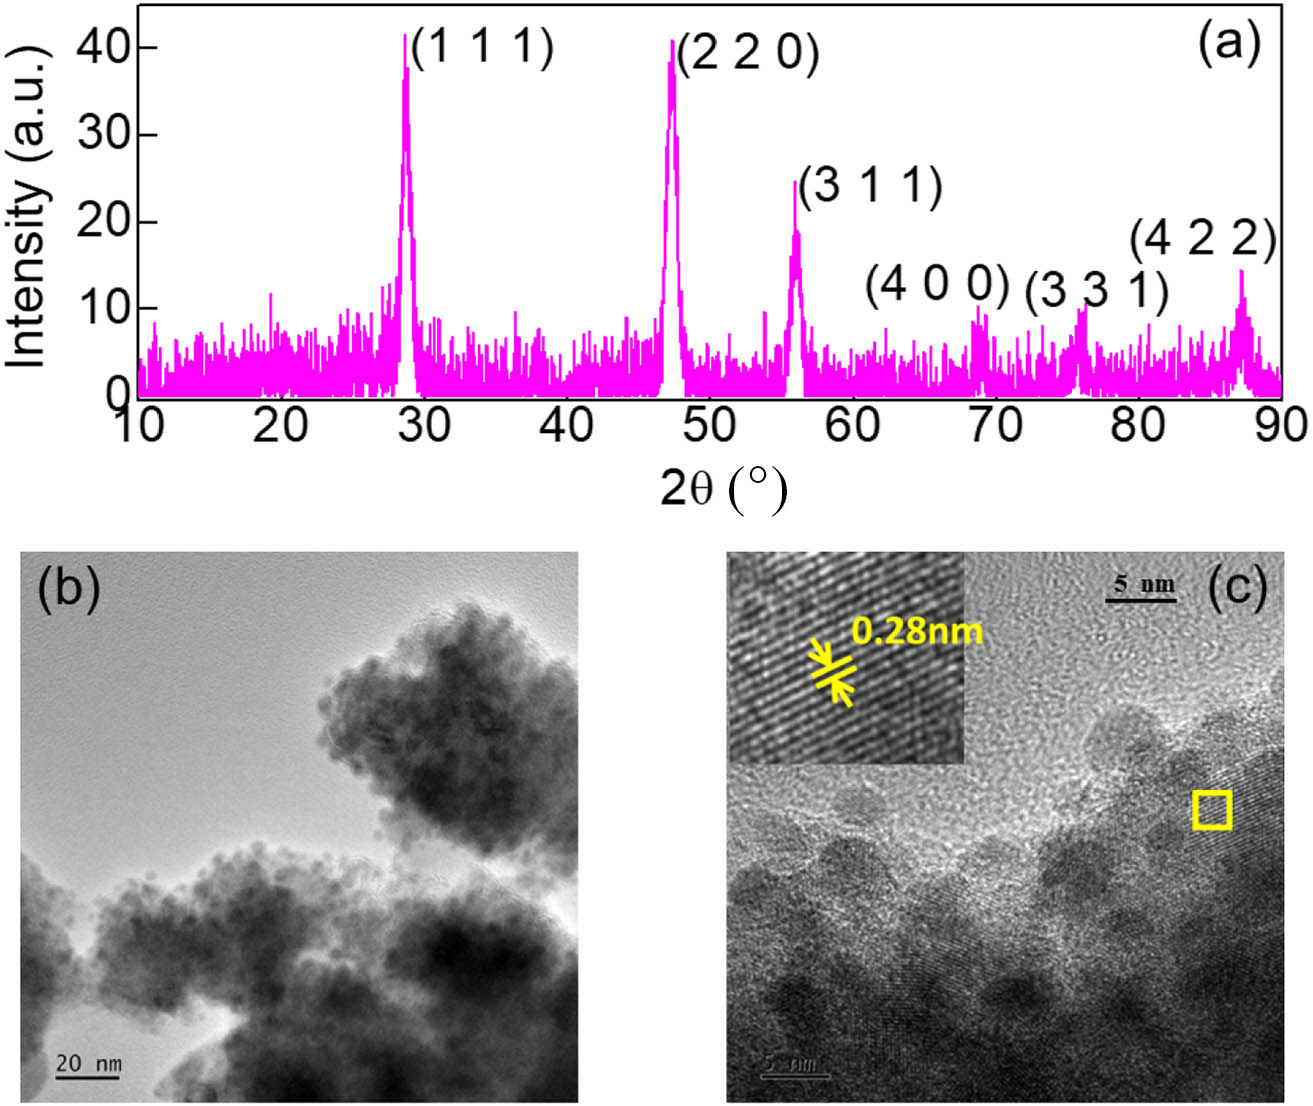
Fig. 2. Characterization of the Tm 3 + / Yb 3 +
Fig. 3. (a) Absorption spectrum of the Tm 3 + / Yb 3 +
Fig. 4. Laser peak intensity dependences of (a) luminescence intensities at 355, 454, 473, and 975 nm for the Tm 3 + / Yb 3 + Yb 3 +
Fig. 5. Energy level structures of Tm 3 + Yb 3 + Tm 3 + Yb 3 +
Fig. 6. Dependences of luminescence intensities on the value of θ λ / 4 Tm 3 + / Yb 3 + Yb 3 +
Fig. 7. Optimization processes for (a-1) enhancing and (a-2) suppressing the luminescence signal at 975 nm. Luminescence spectra of the Tm 3 + / Yb 3 +

Set citation alerts for the article
Please enter your email address
© Copyright 2018-2021 | Chinese Laser Press. All Rights Reserved 沪ICP备15018463号-20