
Bin Song, Ning Yan, Linlin Zhu, Xiaodong Zhang. A Periodic Structural Parameter Inspection Method Based on Spectrum Characteristics[J]. Laser & Optoelectronics Progress, 2020, 57(12): 121008
- Laser & Optoelectronics Progress
- Vol. 57, Issue 12, 121008 (2020)
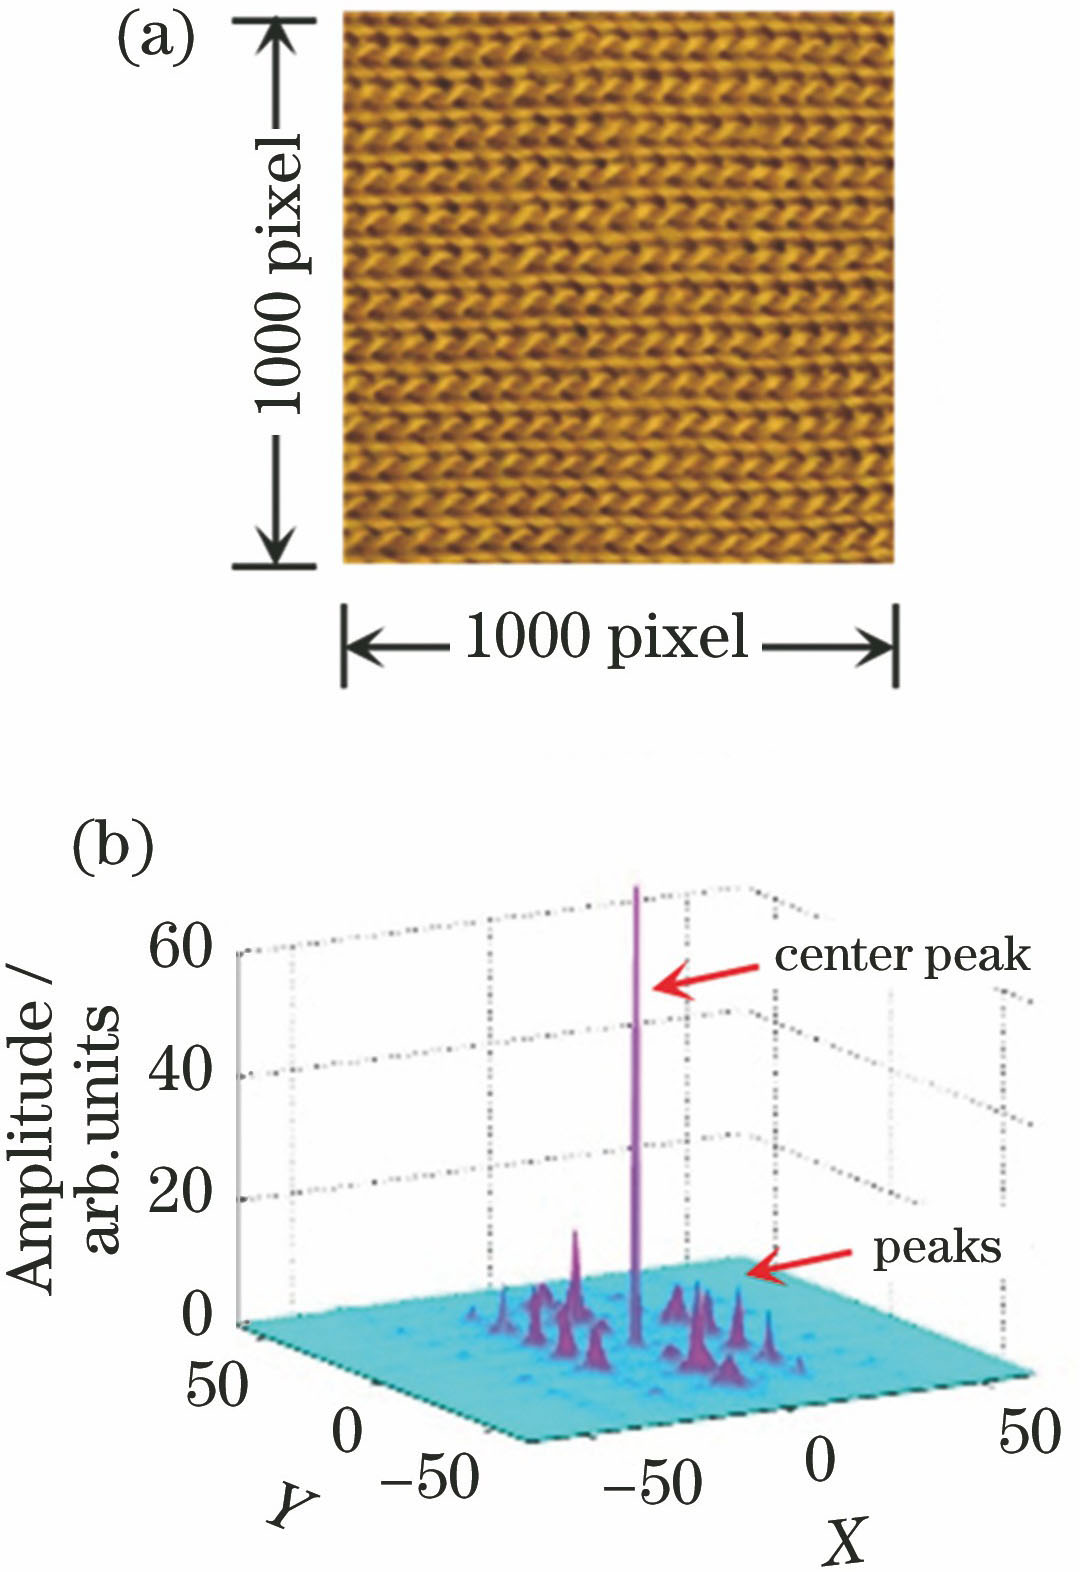
Fig. 1. Typical periodic texture image and spectrum characteristic. (a) Fabric image; (b) 3D spectrum with a series of characteristic peaks
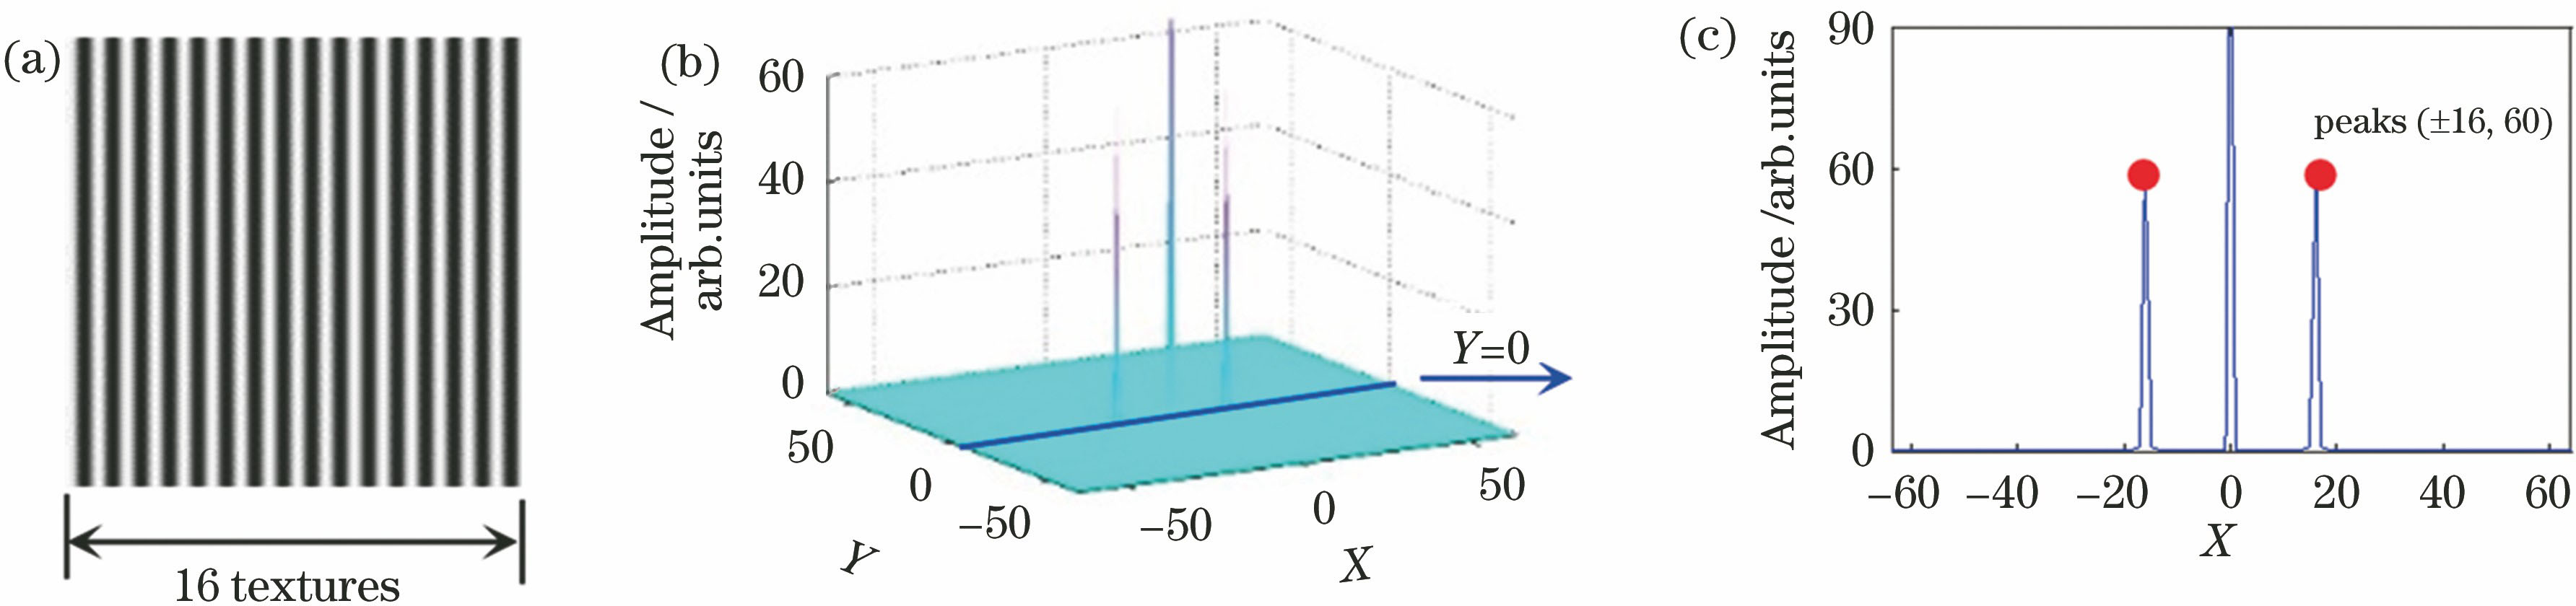
Fig. 2. Simulation texture image and spectrum characteristic. (a) Simulation texture image; (b) 3D spectrum; (c) transverse spectrum and characteristic peaks
Fig. 3. Simulation results of texture image with uniformity error and spectrum characteristic. (a) Simulation texture image; (b) 3D spectrum; (c) transverse spectrum characteristic peaks and peak diffusion
Fig. 4. Correlativity between inspected uniformity error and preseted uniformity error
Fig. 5. Analysis of the relationship between the texture inclination α and the rotation angle of spectrum characteristic point β. (a) Decomposition diagram of d; (b) spectrum characteristic analysis
Fig. 6. User interface in the static density test software. (a) Texture image to be detected; (b) 2D spectrum and feature marker; (c) rotation-corrected image; (d) feature marker in the corrected image; (e) control of execution and output texture detection results
Fig. 7. Histogram analysis of error of measurement results. (a)Data measured by proposed method; (b) data measured by the method in Ref. [20]
Fig. 8. Real-time acquisition and inspection system. (a) Structure of acquisition system; (b) display interface of inspection result
Fig. 9. Fabric uniformity inspection results. (a)~(d) Fabric of uniform texture; (e)~(h) fabric stretched along transverse direction
Fig. 10. Paper counts based on spectrum characteristics. (a) Cross-section image of paper; (b) preprocessing image; (c) 3D spectrum; (d) spectrum characteristics
Fig. 11. Wood texture inspection based on spectrum characteristics. (a) Wood texture image; (b) preprocessing image; (c) 3D spectrum; (d) spectrum characteristics
Fig. 12. Inspection of microstructural arrays based on spectrum characteristics. (a)Texture image of microstructural arrays; (b) preprocessing image; (c) 3D spectrum; (d) spectrum characteristics
|
Table 1. Statistical results of measurement errors by different optimization methods
| |||||||||||||||||||||||||||||||||||||||||||||||||||||||||||||||||||||||||||||||||||||||||||||||||||||||||||||||||||||
Table 2. Density measurement results by proposed method
| ||||||||||||||||||||||||||||||||||||||||||||||||||||||||||||||||||||||||||||||||||||||||||||||||
Table 3. Density measurement results in Ref. [20]

Set citation alerts for the article
Please enter your email address
© Copyright 2018-2021 | Chinese Laser Press. All Rights Reserved 沪ICP备15018463号-20