
Xinyu Zhao, Fuzhen Huang. Image Enhancement Based on Dual-Channel Prior and Illumination Map Guided Filtering[J]. Laser & Optoelectronics Progress, 2021, 58(8): 0810001
- Laser & Optoelectronics Progress
- Vol. 58, Issue 8, 0810001 (2021)
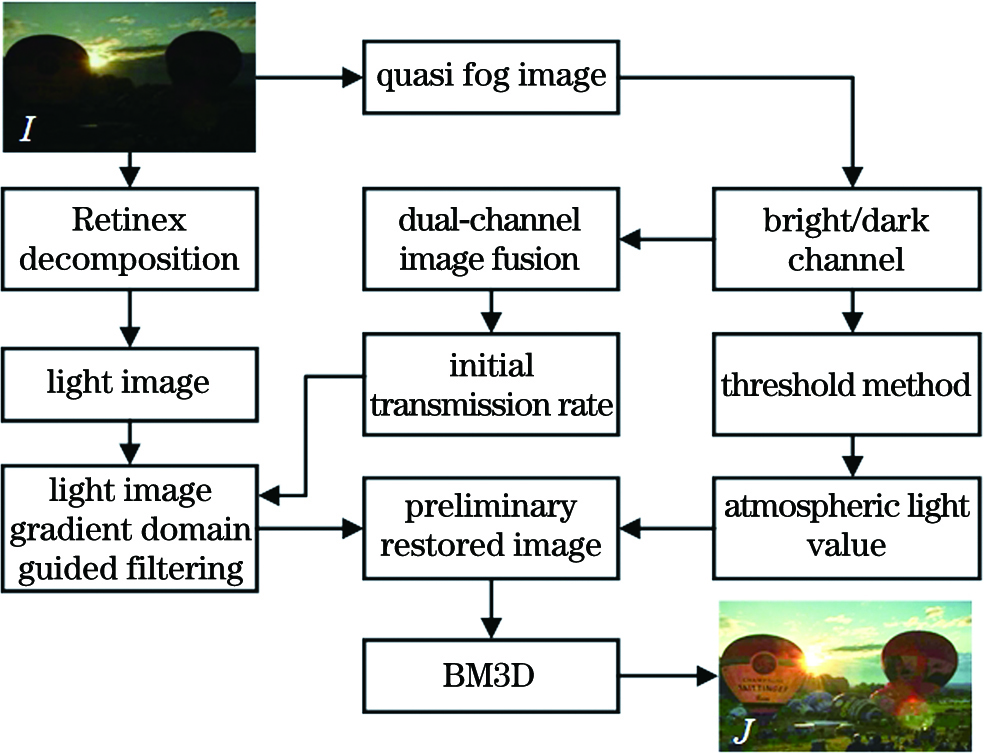
Fig. 1. Flow chart of proposed low-illumination enhancement algorithm
![Enhanced images of atmospheric light value via different methods. (a) Original image; (b) method in Ref. [11]; (c) proposed method](/richHtml/lop/2021/58/8/0810001/img_2.jpg)
Fig. 2. Enhanced images of atmospheric light value via different methods. (a) Original image; (b) method in Ref. [11]; (c) proposed method
Fig. 3. Transmittance images under different α and γ. (a) α=1, γ=0; (b) α=0.75, γ=0.25; (c) α=0.25,γ=0.75; (d) α=0,γ=1
Fig. 4. Edge-extraction images for different bootstrap images. (a) Original image; (b) gray-level inversion image; (c) dark-channel image; (d) illumination images
Fig. 5. Enhancement results after improving transmittance by different methods. (a) Original image; (b) dark-channel; (c) bright-channel; (d) transmittance fusion image; (e) method in Ref. [19]; (f) proposed method
Fig. 6. Enhancement results of low-illumination images with large sky area and obvious change in depth of field for different methods. (a1)--(a4) Original images; (b1)--(b4) method in Ref. [11]; (c1)--(c4) method in Ref. [22]; (d1)--(d4) method in Ref. [23]; (e1)--(e4) proposed method
Fig. 7. Enhancement results of low-illumination images with light source and inhomogeneous light rays for different methods. (a1)--(a3) Original images; (b1)--(b3) method in Ref. [11]; (c1)--(c3) method in Ref. [22]; (d1)--(d3) method in Ref. [23]; (e1)--(e3) proposed method
|
Table 1. Similarity between different bootstrap images and original images
|
Table 2. Information entropies of images
|
Table 3. Average gradients of images
|
Table 4. Structural similarities of images

Set citation alerts for the article
Please enter your email address
© Copyright 2018-2021 | Chinese Laser Press. All Rights Reserved 沪ICP备15018463号-20