
V. A. Gribkov, I. V. Borovitskaya, E. V. Demina, E. E. Kazilin, S. V. Latyshev, S. A. Maslyaev, V. N. Pimenov, T. Laas, M. Paduch, S. V. Rogozhkin. Application of dense plasma focus devices and lasers in the radiation material sciences for the goals of inertial fusion beyond ignition[J]. Matter and Radiation at Extremes, 2020, 5(4): 045403
- Matter and Radiation at Extremes
- Vol. 5, Issue 4, 045403 (2020)
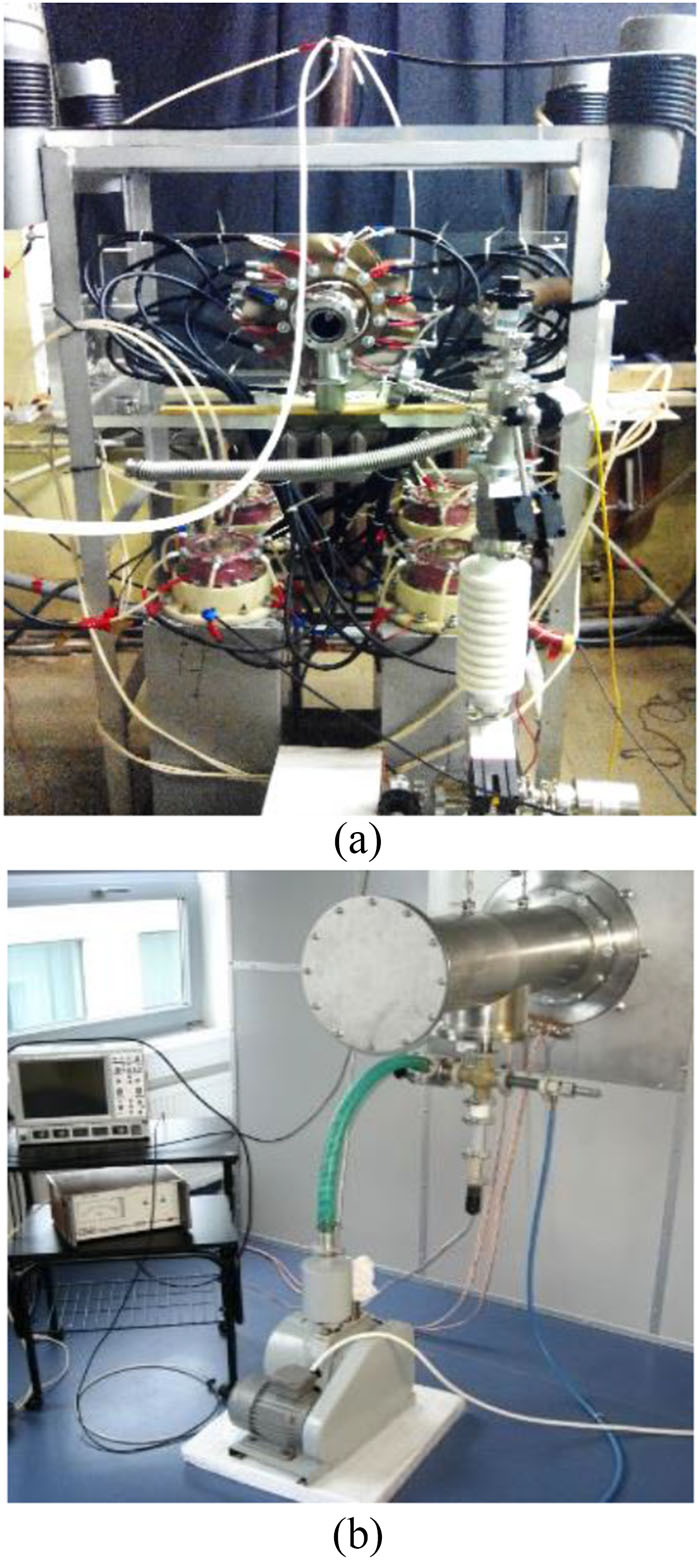
Fig. 1. (a) Vikhr’ and (b) PF-12 devices.
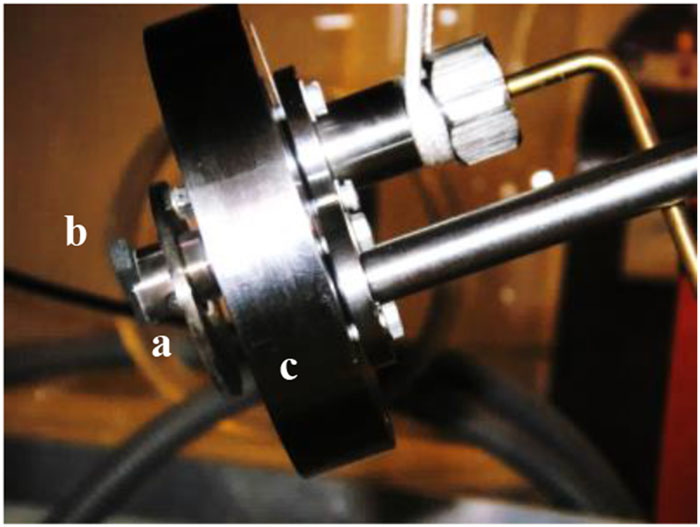
Fig. 2. (a) Specimen holder and (b) a specimen of tungsten attached to (c) the lid of a chamber for use in the PF-6 and Vikhr’ devices.
Fig. 3. Discharge chamber of the PF-1000U facility (external view).
Fig. 4. (a) Virgin tungsten specimen: 1, supporting rod; 2, holder; 3, target inside the PF-1000U chamber. (b) The same specimen after irradiation.
Fig. 5. Oscilloscope traces of the current derivatives of the discharges produced at the PF-6 device: (a) a “bad” shot; (b) a “good” shot.
Fig. 6. PMT+S oscilloscope traces of discharges produced at the PF-6 device, with generation of hard X rays (X) and neutrons (n): (a) a “bad” shot; (b) a “good” shot.
Fig. 7. GOS-1001 laser device capable of working with a pulse of about 50 ns and 20 J in the Q-switched mode.
Fig. 8. Schematic of a hot plasma stream with a shock wave pushing past it and fast ion streams spreading into space from the DPF anode and irradiating targets placed at two positions (1 and 2).
Fig. 9. Scheme for investigating the action of LR on a target using a laser working in the QS mode: CZ, central zone of LR (the focal spot); ZTI, zone of thermal influence of the laser-produced plasma (LPP).
Fig. 10. Interferometric picture of a pinch with the upper part of the current sheath (CS) and a stainless steel plate with plasma from a cumulative stream collected in front of it.
Fig. 11. (a) Interferometric image, (b) contours of electron density, and (c) and (d) the 3D electron density distribution. The secondary plasma can be seen to be propagating from the target (Z = 8 cm) toward the anode (Z = 0).
Fig. 12. Experimentally obtained propagation speed of SP from the target in the direction toward the anode as a function of atomic mass for three different materials (W, stainless steel, and SiC) irradiated under the similar conditions (P FIS ≈ 1012 W/cm2) in the PF-1000U facility.
Fig. 13. Microroughness of W alloy specimens irradiated at the PF-12 device: (a) 25 shots and power flux density P = 500 MW/cm2, giving R a = 1.87 μ m; (b) 100 shots and power flux density P = 50 MW/cm2, giving R a = 5.12 μ m.
Fig. 14. SEM images of double-forged W specimens (a) before irradiation and after several shots from a DPF in regimes with (b) high and (c) very high power flux density P FIS.
Fig. 21. Virgin Eurofer 97: 0.11 wt. % C; 9.0 wt. % Cr; 0.48 wt. % Mn; 1.1 wt. % W; 0.20 wt. % V; 0.07 wt. % Ta; 0.03 wt. % N; 0.005 wt. % P. Heat treatment was normalizing at 980 °С for 30 min plus tempering at 760 °С for 1.5 h.
Fig. 22. Eurofer 97 after irradiation in the PF-6 device without melting of the SL (deuterium, L = 18.3 cm, N = 7 pulses). Round flat droplets of copper can be seen to appear as a consequence of the use of a DPF device with an oxygen-free copper anode.
Fig. 23. Images at different magnifications of specimens of Eurofer 97 irradiated in the PF-6 device, showing surface melting (deuterium, distance L = 13.8 cm, N = 7 pulses).
Fig. 24. Images of Eurofer 97 specimens irradiated at P FIS = 1012 W/cm2 in the PF-6 device, showing strong melting of the surface (deuterium, L = 4.3 cm, 12 pulses).
Fig. 25. X-ray diffraction patterns of the SL: virgin and irradiated at two different distances.
Fig. 26. SEM imagesof areas (different magnifications) of the surface of a V–10Ti–6Cr alloy target after irradiation by LR from a laser working in the QS mode with P LR = 1012 W/cm2 and τ = 50 ns: (a) and (b) zones of the focal spots (central zone, CZ: see Fig. 9 ) and of the thermal influence (ZTI) of a laser-produced flame; (c) and (d) CZ (focal spot) of the LR effect, with a crater [shown by the rectangle in (a)] of diameter less than 100 µ m.
Fig. 27. Graphs of changes in SW pressure amplitude with depth after irradiation of W (a) by pulsed LR in the QS mode of operation with two pulse durations and (b) by plasma/ion streams in a DPF at two values of pulse duration and irradiation power flux densities P = 1012 W/cm2.
| |||||||||||||||||||||||||||||||||||
Table 1. Results of a numerical simulation of SP propagation for three materials and under dissimilar irradiation conditions.
| ||||||||||||||||||||||||||
Table 2. Irradiation conditions for ODS steel specimens in the PF-1000U device.
|
Table 4. Data on SW generation in W on irradiation by FIS and LR.

Set citation alerts for the article
Please enter your email address
© Copyright 2018-2021 | Chinese Laser Press. All Rights Reserved 沪ICP备15018463号-20