
Jinrui Gao, Dahai Li, Heng Lai, Xinwei Zhang, Ruiyang Wang, Yilang Ruan. Measurement of Wavefront Aberration of Lens Based on Phase Measuring Deflectometry[J]. Laser & Optoelectronics Progress, 2022, 59(2): 0212001
- Laser & Optoelectronics Progress
- Vol. 59, Issue 2, 0212001 (2022)
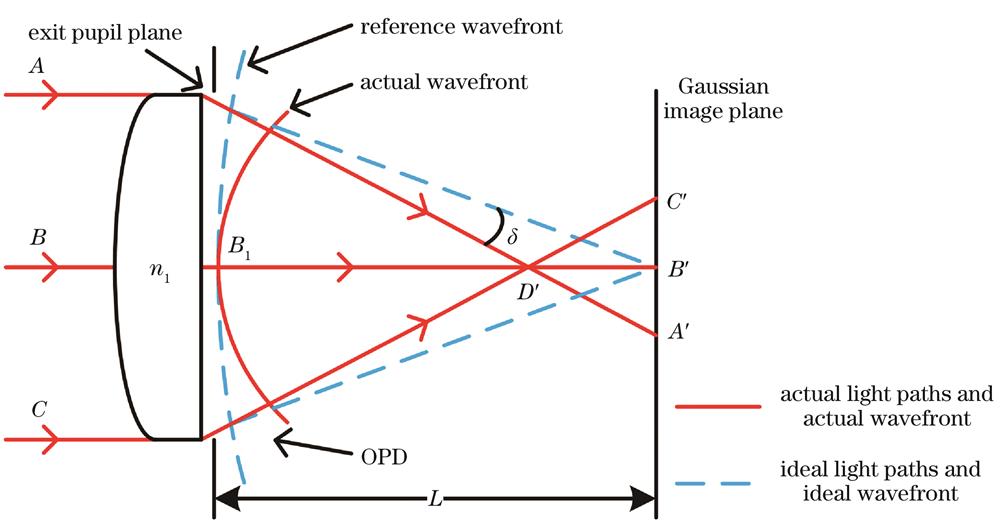
Fig. 1. Optical paths of ideal imaging and actual imaging of single lens
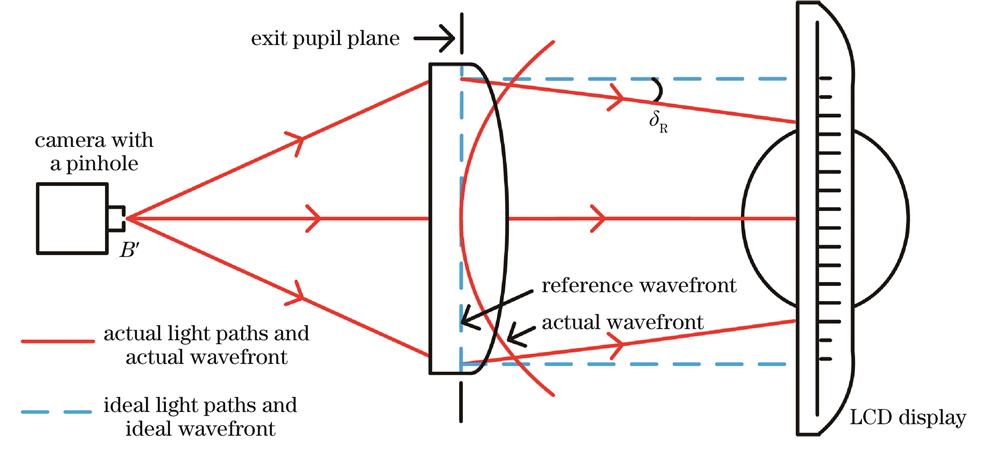
Fig. 2. Optical paths of ideal imaging and actual imaging of reverse ray tracing
Fig. 3. Schematic diagram of the prism model
Fig. 4. Optical path diagram of the prism model. (a) Ray tracing; (b) reverse ray tracing
Fig. 5. Optical path diagram of incident parallel light
Fig. 6. Simulation results of ray tracing. (a) Apex angles of the prisms in the horizontal direction on the x-axis; (b) angular aberration of ray tracing; (c) angular aberration of reverse ray tracing; (d)
Fig. 7. Wavefront aberration obtained by ray tracing. (a) Angular aberration in the horizontal direction of ray tracing; (b) angular aberration in the vertical direction of reverse ray tracing; (c) wavefront aberration of ray tracing; (d) wavefront aberration of reverse ray tracing; (e)
Fig. 8. Top view of the experimental setup
Fig. 9. Fringe patterns in experiment. (a) Patterns with lens; (b) patterns without lens
Fig. 10. Schematic diagram of calculating δR
Fig. 11. False-color plots of the measurement results of different methods. (a) Zernike 4 terms removed; (b) Zernike 10 terms removed; (c) Zernike 11 terms removed
|
Table 1. Comparison of wavefront aberrations
| |||||||||||||||||||||||||||
Table 2. RMS and PV of measurement results of different methods

Set citation alerts for the article
Please enter your email address
© Copyright 2018-2021 | Chinese Laser Press. All Rights Reserved 沪ICP备15018463号-20