• Photonics Research
  • Vol. 10, Issue 6, 1417 (2022)
Hao Yu1、2、†, Chenzhi Yuan1、†, Ruiming Zhang1, Zichang Zhang1, Hao Li3, You Wang1、4, Guangwei Deng1, Lixing You3, Haizhi Song1、4、8, Zhiming Wang1、5、9, Guang-Can Guo1、6, and Qiang Zhou1、6、7、*
Author Affiliations
  • 1Institute of Fundamental and Frontier Sciences, University of Electronic Science and Technology of China, Chengdu 610054, China
  • 2Institut national de la recherche scientifique-Centre Énergie, Matériaux et Télécommunications (INRS-EMT), Varennes, Quebec J3X 1S2, Canada
  • 3Shanghai Institute of Microsystem and Information Technology, Chinese Academy of Sciences, Shanghai 200050, China
  • 4Southwest Institute of Technical Physics, Chengdu 610041, China
  • 5Shenzhen Institute for Quantum Science and Engineering, Southern University of Science and Technology, Shenzhen 518055, China
  • 6CAS Key Laboratory of Quantum Information, University of Science and Technology of China, Hefei 230026, China
  • 7School of Optoelectronic Science and Engineering, University of Electronic Science and Technology of China, Chengdu 610054, China
  • 8e-mail: hzsong1296@163.com
  • 9e-mail: zhmwang@gmail.com
  • show less
    DOI: 10.1364/PRJ.450731 Cite this Article Set citation alerts
    Hao Yu, Chenzhi Yuan, Ruiming Zhang, Zichang Zhang, Hao Li, You Wang, Guangwei Deng, Lixing You, Haizhi Song, Zhiming Wang, Guang-Can Guo, Qiang Zhou. Spectrally multiplexed indistinguishable single-photon generation at telecom-band[J]. Photonics Research, 2022, 10(6): 1417 Copy Citation Text show less
    Principles of chip-scale LNOI-based spectrally multiplexed HSPS. (a) A view of future chip-scale LNOI-based spectrally multiplexed HSPS, in which all basic components are integrated on an LNOI photonic chip including pump laser module, (I) photon-pairs generation module, (II) filtering and detecting module, and (III) feed-forward and frequency shifting module. (b) Energy conservation graph of SHG and SPDC. (c) Illustration of multiplexing in frequency domain. Photon-pairs generation module (I) generates broadband correlated signal and idler photons through cascaded SHG and SPDC processes. Idler photons are filtered into different spectral modes and detected by SNSPDs in the filtering and detecting module (II). Detection signals are sent to the logic circuit. The logic circuit sends frequency shifting signal to the feed-forward and frequency shifting module (III), where signal photons are shifted into the common spectral mode. LNOI, lithium niobate on insulator; PPLN, periodically poled lithium niobate; LN, lithium niobate; EOM, electro-optic phase modulator; SNSPD, superconducting nanowire single-photon detector; Freq. Shif. Sig., frequency shifting signals; SHG, second-order harmonics generation; SPDC, spontaneous parametric downconversion.
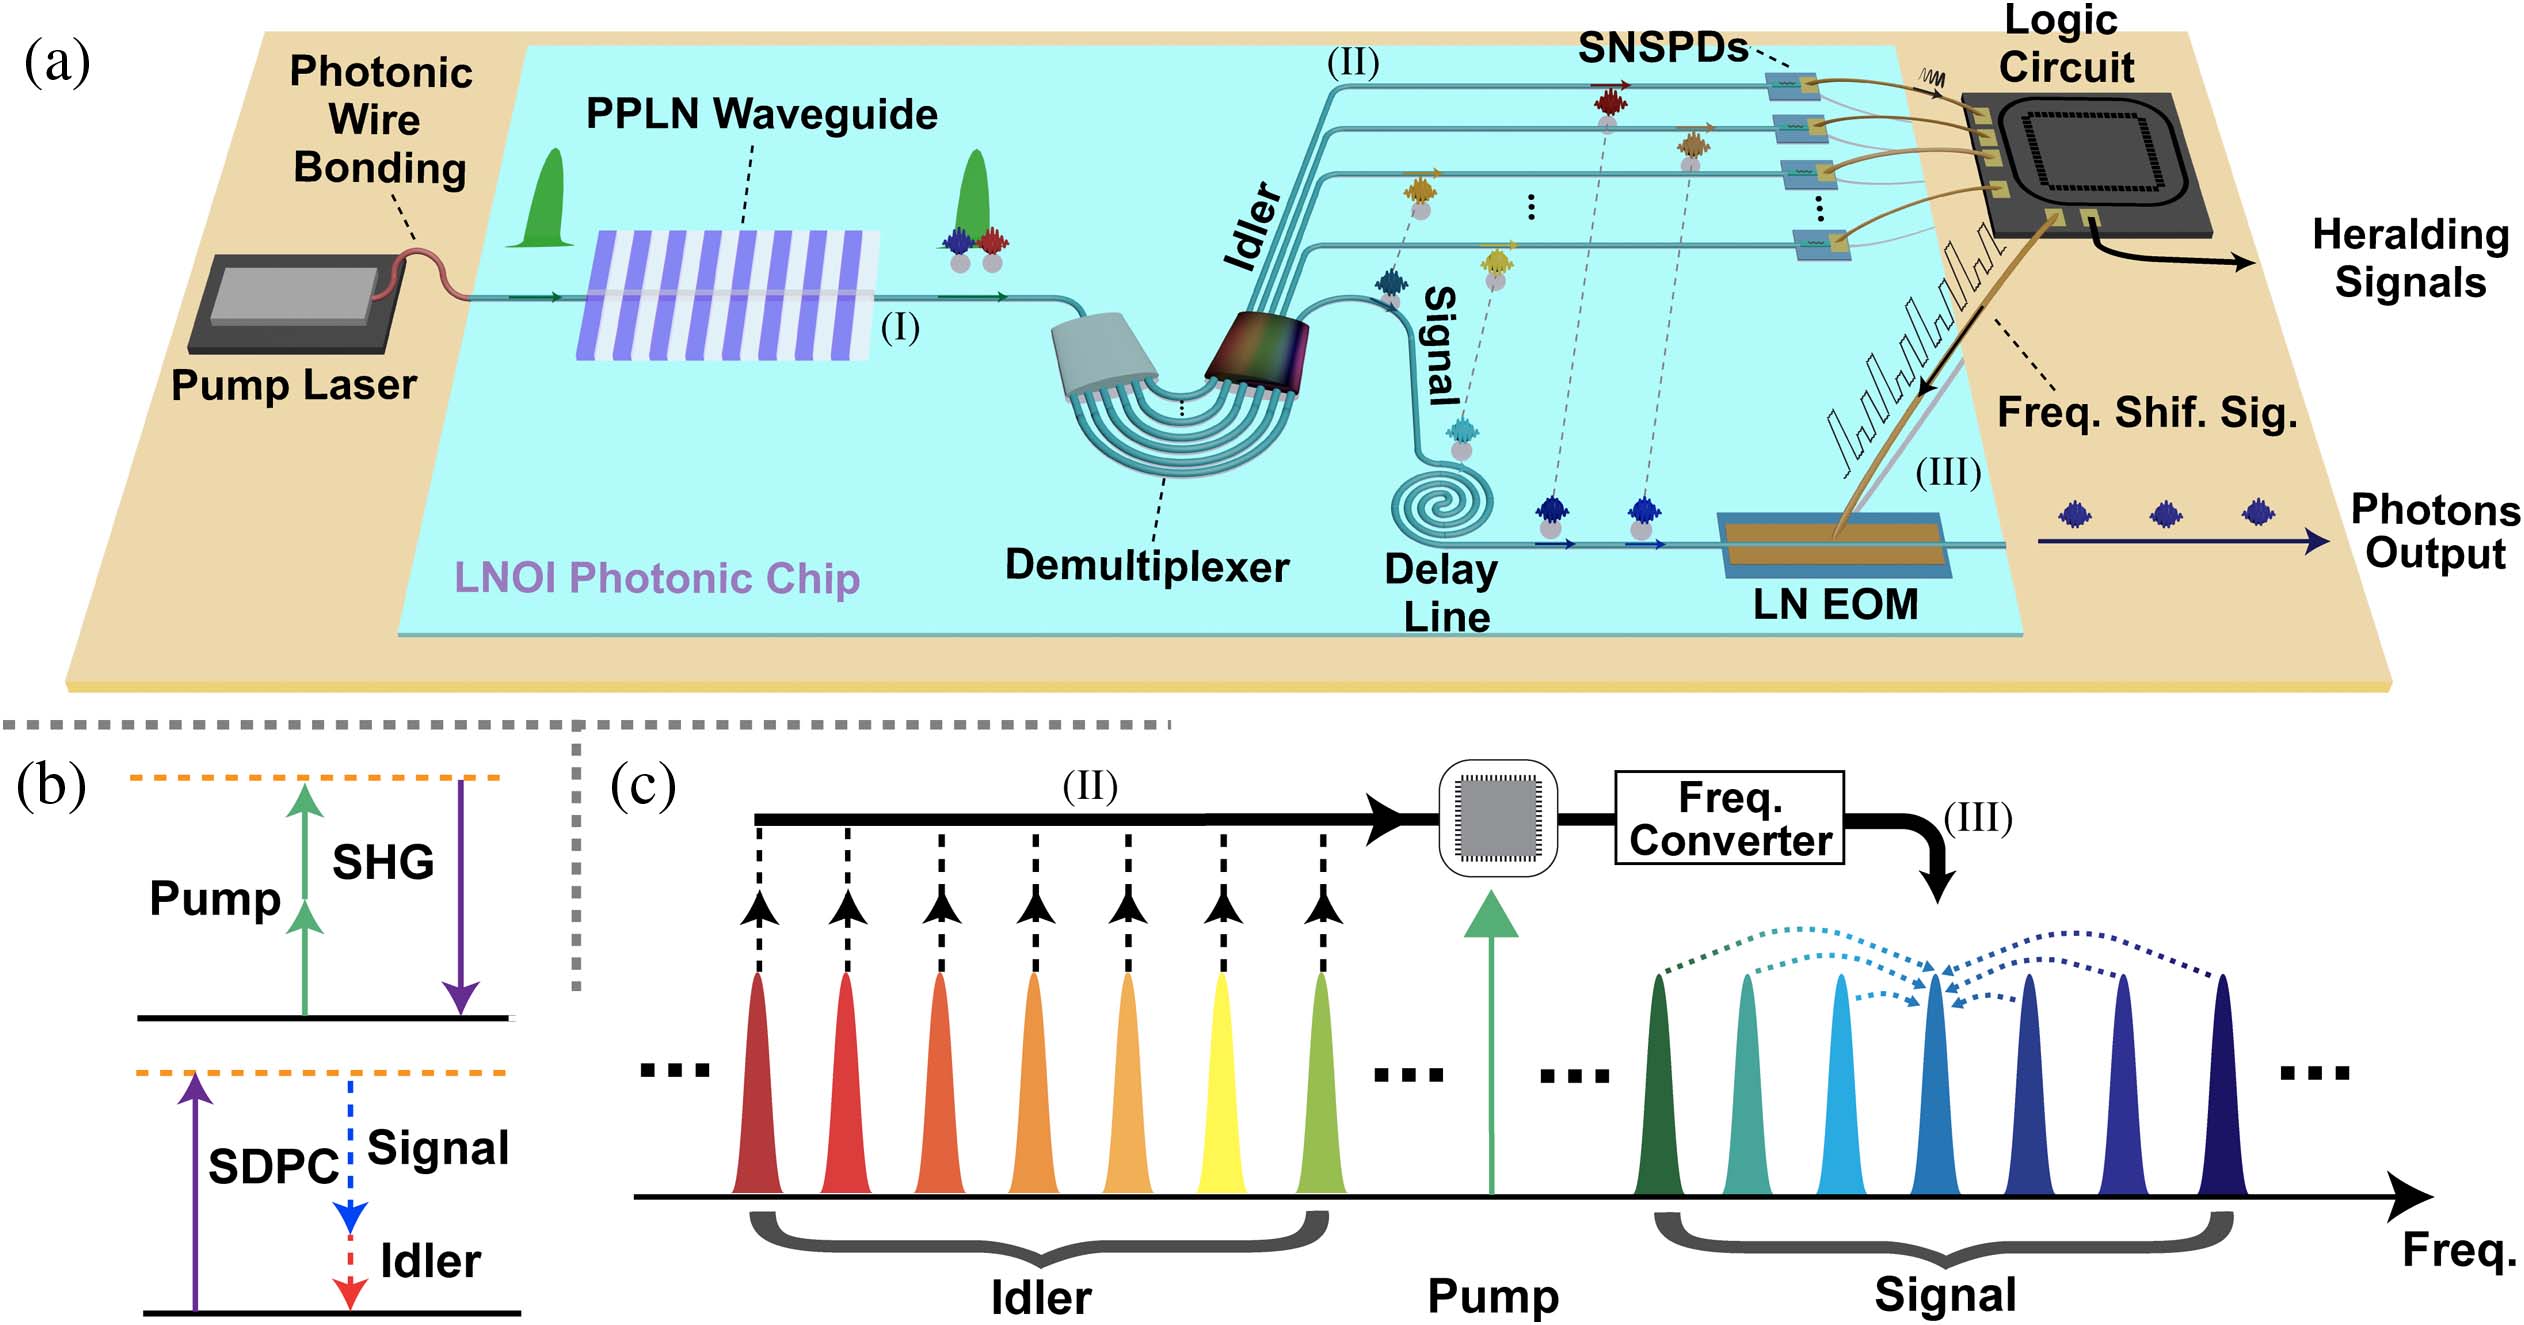
    Fig. 1. Principles of chip-scale LNOI-based spectrally multiplexed HSPS. (a) A view of future chip-scale LNOI-based spectrally multiplexed HSPS, in which all basic components are integrated on an LNOI photonic chip including pump laser module, (I) photon-pairs generation module, (II) filtering and detecting module, and (III) feed-forward and frequency shifting module. (b) Energy conservation graph of SHG and SPDC. (c) Illustration of multiplexing in frequency domain. Photon-pairs generation module (I) generates broadband correlated signal and idler photons through cascaded SHG and SPDC processes. Idler photons are filtered into different spectral modes and detected by SNSPDs in the filtering and detecting module (II). Detection signals are sent to the logic circuit. The logic circuit sends frequency shifting signal to the feed-forward and frequency shifting module (III), where signal photons are shifted into the common spectral mode. LNOI, lithium niobate on insulator; PPLN, periodically poled lithium niobate; LN, lithium niobate; EOM, electro-optic phase modulator; SNSPD, superconducting nanowire single-photon detector; Freq. Shif. Sig., frequency shifting signals; SHG, second-order harmonics generation; SPDC, spontaneous parametric downconversion.
    Experimental setup for spectrally multiplexed HSPS. PPLN, periodically poled lithium niobate; DWDM, dense wavelength-divided multiplexer; EOM, electro-optic phase modulator; TNF, tunable narrowband filter; BS, beam splitter; PC, polarization controller; TDC, time-to-digit convertor; SNSPD, superconducting nanowire single-photon detector.
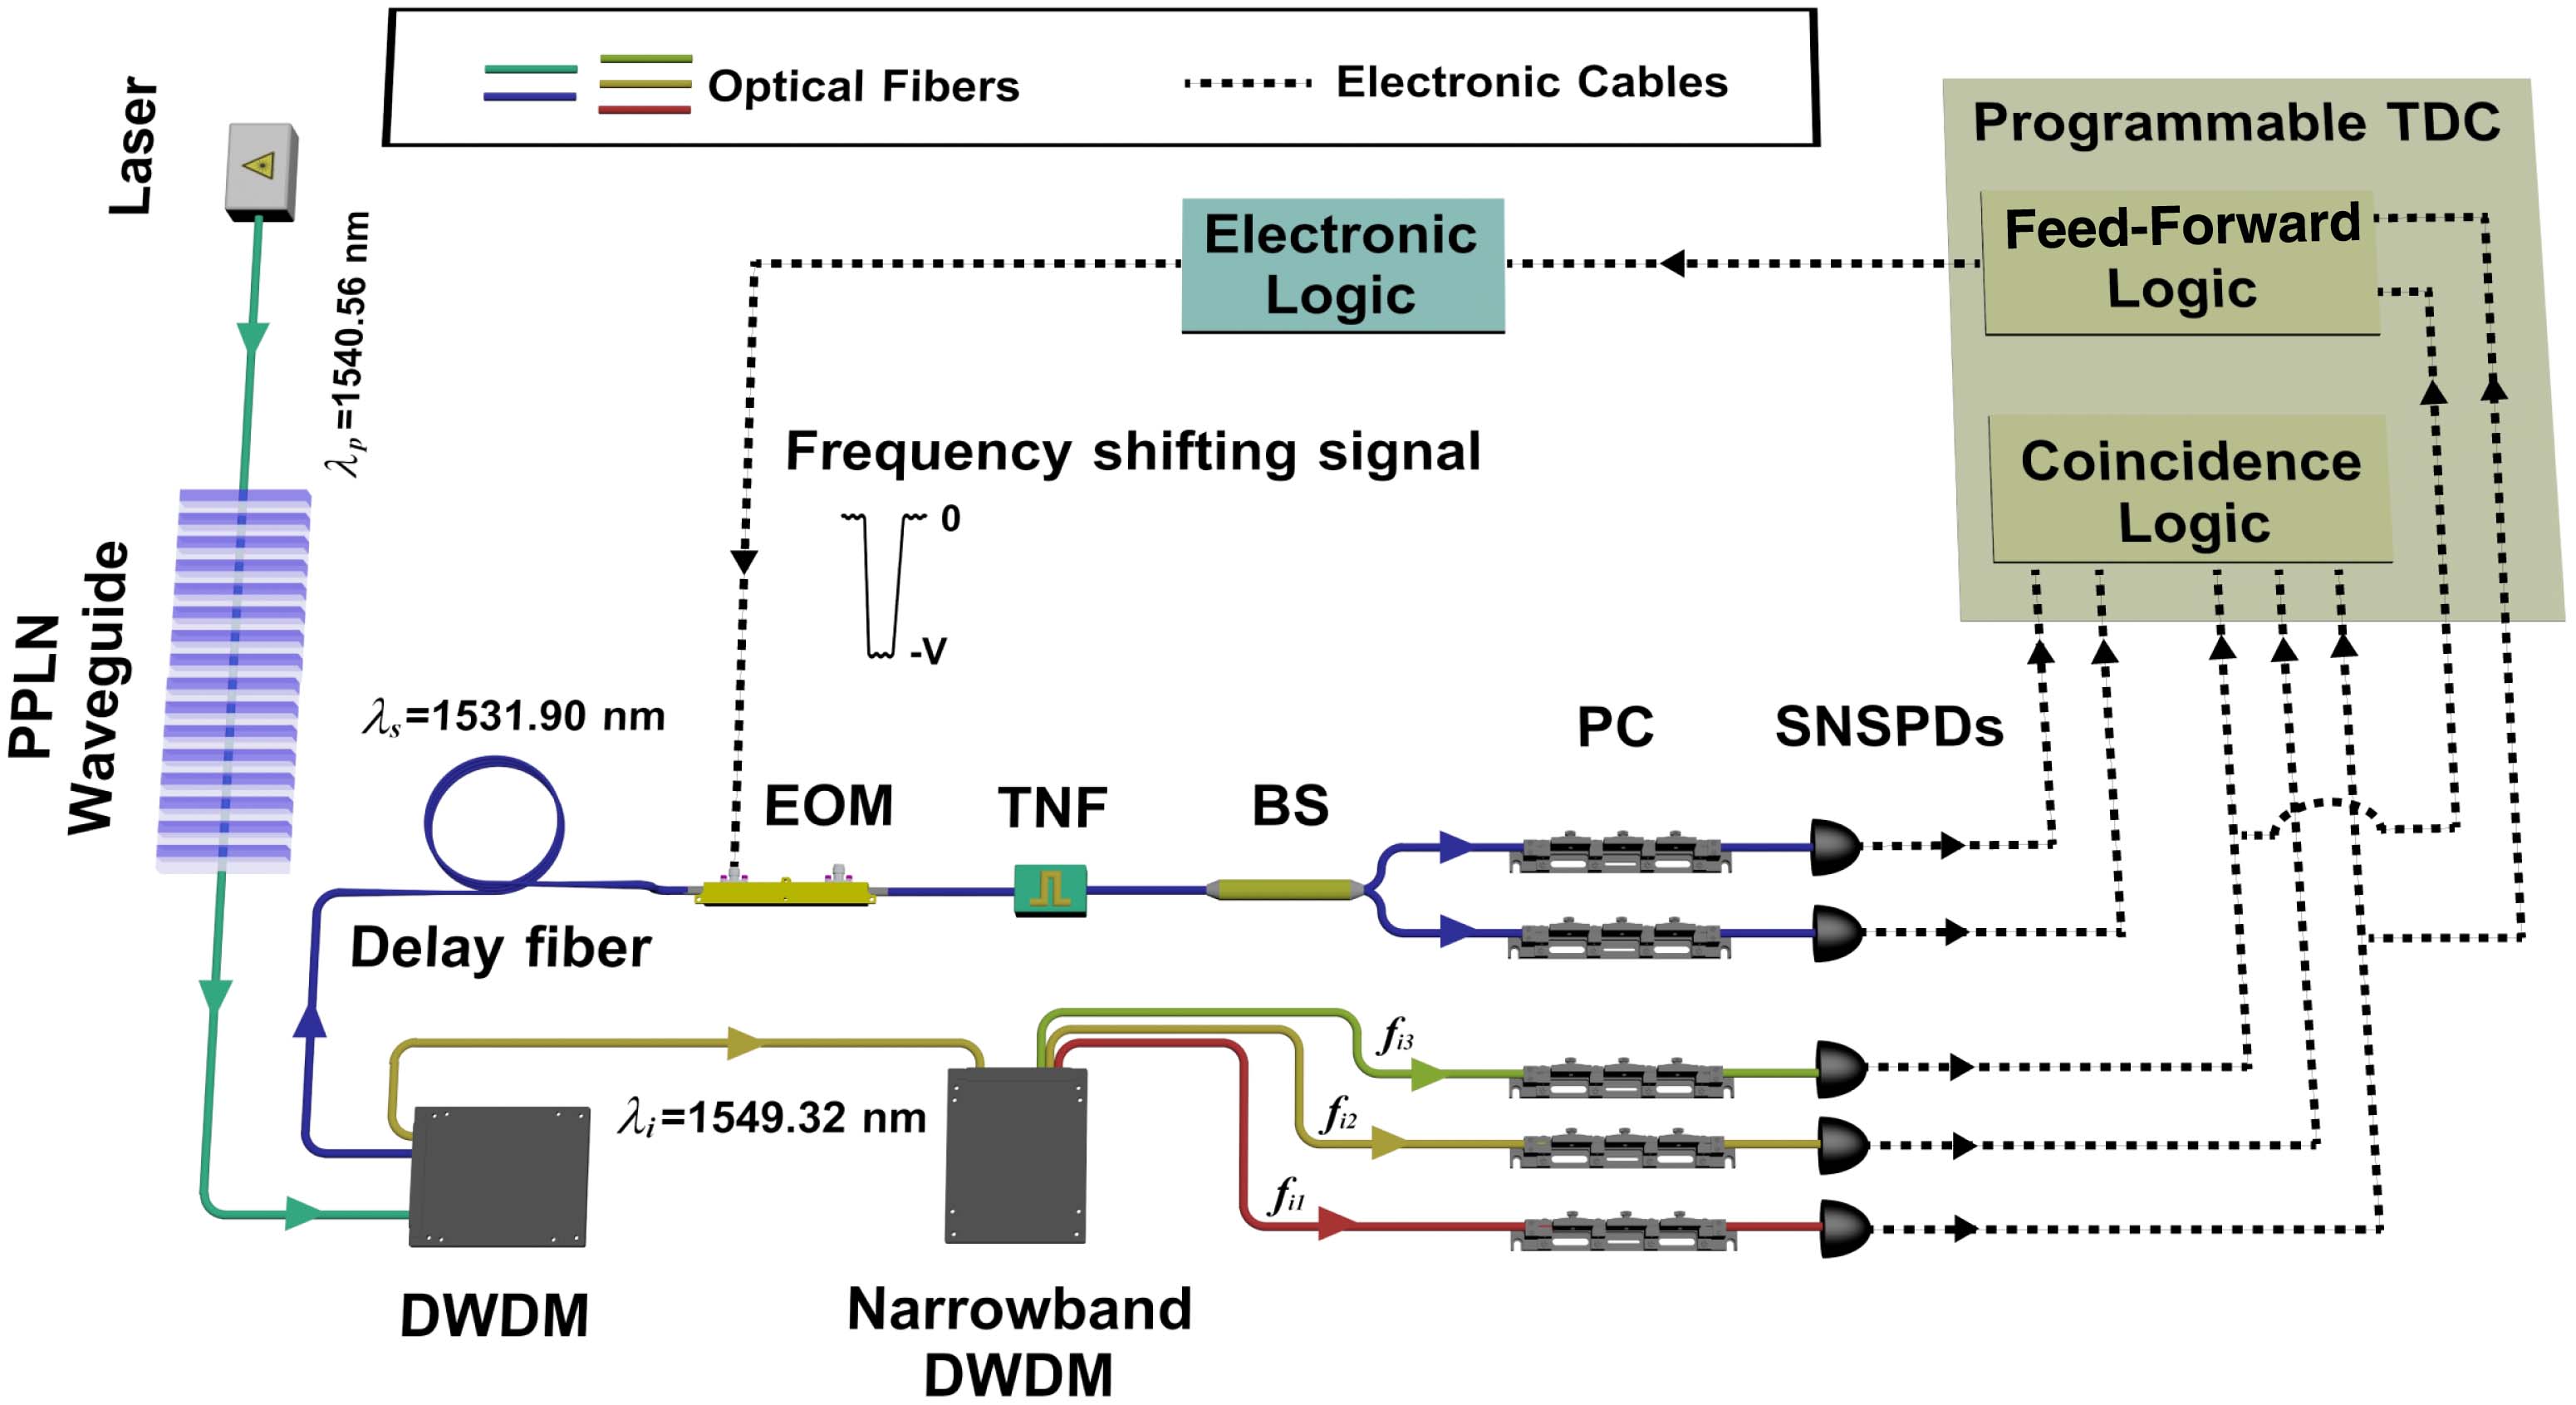
    Fig. 2. Experimental setup for spectrally multiplexed HSPS. PPLN, periodically poled lithium niobate; DWDM, dense wavelength-divided multiplexer; EOM, electro-optic phase modulator; TNF, tunable narrowband filter; BS, beam splitter; PC, polarization controller; TDC, time-to-digit convertor; SNSPD, superconducting nanowire single-photon detector.
    Coincidence count rates without and with frequency shifting. (a) and (b) are the measured coincidence count rates among three individual spectral modes without and with spectral multiplexing, respectively, under the CW pumping power of 4 mW. The horizontal axis corresponds to the relative frequency difference with respect to fs0. Red rectangles, orange circles, and yellow triangles represent the coincidence count rate of single photons to heralding photons at spectral modes fs+, fs0, and fs−, respectively. Dashed curves are fitted by Gaussian functions which describe the frequency response of individual channels from the narrowband DWDM.
    Fig. 3. Coincidence count rates without and with frequency shifting. (a) and (b) are the measured coincidence count rates among three individual spectral modes without and with spectral multiplexing, respectively, under the CW pumping power of 4 mW. The horizontal axis corresponds to the relative frequency difference with respect to fs0. Red rectangles, orange circles, and yellow triangles represent the coincidence count rate of single photons to heralding photons at spectral modes fs+, fs0, and fs, respectively. Dashed curves are fitted by Gaussian functions which describe the frequency response of individual channels from the narrowband DWDM.
    Experimental results from multiplexing of three spectral modes. Blue diamonds are multiplexed source, and red rectangles, orange circles, and yellow triangles represent individual spectral modes of fs+, fs0, and fs−, respectively. Dashed curves are fitted according to the theory model of our experiment. Dotted line is the theoretical calculation under the condition of perfect frequency response of electronic devices. (a) HSP rate versus pump power. The HSP rate of the multiplexed source is 2.80±0.12 times larger than that of individual spectral modes at low pump power. The multiplexed HSP rate reaches 23.6 kHz under the pumping power of 16.98 mW. (b) CAR versus HSP rate. The CAR of the multiplexed source shows an improved performance than that of individual HSPS under fixed HSP rate. At low count rate, the multiplexed source has a CAR exceeding 2000 along with 2.80±0.12 times enhancement while remains high at 100 for large HSP rates. (c) g(2)(0) versus HSP rate. We select the spectral mode fs0 as a contrast to its multiplexed counterpart. It shows that the g(2)(0) of the individual source increases nearly 3 times rapider than the multiplexed one in the low HSP rate region as well as theoretically. Inset: heralded single-photon autocorrelation at an HSP rate of 21.1 kHz. The black curve represents the g(2) (τ) fitting. The antibunching dip is at 0.0140±0.0009. MUX, spectral multiplexing; T-C, theoretical calculation; HPS, heralded photon rate. Error bars are estimated using Poisson statistics.
    Fig. 4. Experimental results from multiplexing of three spectral modes. Blue diamonds are multiplexed source, and red rectangles, orange circles, and yellow triangles represent individual spectral modes of fs+, fs0, and fs, respectively. Dashed curves are fitted according to the theory model of our experiment. Dotted line is the theoretical calculation under the condition of perfect frequency response of electronic devices. (a) HSP rate versus pump power. The HSP rate of the multiplexed source is 2.80±0.12 times larger than that of individual spectral modes at low pump power. The multiplexed HSP rate reaches 23.6 kHz under the pumping power of 16.98 mW. (b) CAR versus HSP rate. The CAR of the multiplexed source shows an improved performance than that of individual HSPS under fixed HSP rate. At low count rate, the multiplexed source has a CAR exceeding 2000 along with 2.80±0.12 times enhancement while remains high at 100 for large HSP rates. (c) g(2)(0) versus HSP rate. We select the spectral mode fs0 as a contrast to its multiplexed counterpart. It shows that the g(2)(0) of the individual source increases nearly 3 times rapider than the multiplexed one in the low HSP rate region as well as theoretically. Inset: heralded single-photon autocorrelation at an HSP rate of 21.1 kHz. The black curve represents the g(2) (τ) fitting. The antibunching dip is at 0.0140±0.0009. MUX, spectral multiplexing; T-C, theoretical calculation; HPS, heralded photon rate. Error bars are estimated using Poisson statistics.
    Joint spectrum intensity (JSI) between heralding and signal photons in the fs−fi plane. Three JSIs shown here are measured by placing two TNFs in the signal arm and heralding arm, respectively, and counting the coincidences by sweeping frequencies of fs and fi. The top and right graphs for each JSI represent the marginal intensity distribution of the heralding and signal sides, respectively. The vertical and horizontal white (black) dashed lines depict the bandwidth of filters for the heralding and signal arms, respectively. Here, fi1=193.4992 THz (1549.36 nm), fi2=193.5117 THz (1549.26 nm), and fi3=193.5242 THz (1549.16 nm) while fs+=195.7006 THz (1531.93 nm), fs0=195.6881 THz (1532.03 nm), and fs−=195.6756 THz (1532.13 nm). (a) Photon pairs directly out of the PPLN waveguide without filtering. The diagonal band exhibits a high frequency correlation. (b) Photon pairs with narrowband DWDM applied in the heralding arm when multiplexing disabled. The JSI is broken into islands with three spectral modes corresponding to the narrowband DWDM. The circle-like island from each spectral mode exhibits a good spectral purity. Note that spectral mode fs+ has an additional 1 dB loss from the idler arm. (c) Photon pairs with multiplexing enabled. The islands of spectral modes fs+ and fs− are shifted into the central spectral mode.
    Fig. 5. Joint spectrum intensity (JSI) between heralding and signal photons in the fsfi plane. Three JSIs shown here are measured by placing two TNFs in the signal arm and heralding arm, respectively, and counting the coincidences by sweeping frequencies of fs and fi. The top and right graphs for each JSI represent the marginal intensity distribution of the heralding and signal sides, respectively. The vertical and horizontal white (black) dashed lines depict the bandwidth of filters for the heralding and signal arms, respectively. Here, fi1=193.4992  THz (1549.36 nm), fi2=193.5117  THz (1549.26 nm), and fi3=193.5242  THz (1549.16 nm) while fs+=195.7006  THz (1531.93 nm), fs0=195.6881  THz (1532.03 nm), and fs=195.6756  THz (1532.13 nm). (a) Photon pairs directly out of the PPLN waveguide without filtering. The diagonal band exhibits a high frequency correlation. (b) Photon pairs with narrowband DWDM applied in the heralding arm when multiplexing disabled. The JSI is broken into islands with three spectral modes corresponding to the narrowband DWDM. The circle-like island from each spectral mode exhibits a good spectral purity. Note that spectral mode fs+ has an additional 1 dB loss from the idler arm. (c) Photon pairs with multiplexing enabled. The islands of spectral modes fs+ and fs are shifted into the central spectral mode.
    HOM interference between the multiplexed source and the weak coherence source. Red circles are twofold coincidences measured without the heralding procedure. Blue diamonds are threefold coincidences measured under the condition by the heralding procedure without subtracting the contribution of the multiphoton event. Both twofold and threefold coincidences are fitted by Gaussian functions with red and blue curves and have the visibility of 39.85%±1.63% and 60.99%±4.80%, respectively. Both twofold and threefold visibilities are 1000-time Gaussian fitting results with the Monte Carlo method. The red and blue bands represent the fitting variances of twofold and threefold HOM effects, respectively. The black solid curve represents the theoretically calculated upper bound of the threefold HOM interference at 66.67%. Error bars are estimated using Poisson statistics.
    Fig. 6. HOM interference between the multiplexed source and the weak coherence source. Red circles are twofold coincidences measured without the heralding procedure. Blue diamonds are threefold coincidences measured under the condition by the heralding procedure without subtracting the contribution of the multiphoton event. Both twofold and threefold coincidences are fitted by Gaussian functions with red and blue curves and have the visibility of 39.85%±1.63% and 60.99%±4.80%, respectively. Both twofold and threefold visibilities are 1000-time Gaussian fitting results with the Monte Carlo method. The red and blue bands represent the fitting variances of twofold and threefold HOM effects, respectively. The black solid curve represents the theoretically calculated upper bound of the threefold HOM interference at 66.67%. Error bars are estimated using Poisson statistics.
    (a) Experimental setup for generation of frequency shifting signals. AWG, arbitrary waveform generator; Amp., microwave amplifier. (b) Typical electronic signal for frequency shifting. (c) Enhancement of the multiplexed source versus heralding rate. Inset: Heralding efficiency of the multiplexed source versus pump power. Green circles and blue diamonds are measured data while green and blue dashed curves are the result of theoretical calculation. Error bars are estimated using Poisson statistics.
    Fig. 7. (a) Experimental setup for generation of frequency shifting signals. AWG, arbitrary waveform generator; Amp., microwave amplifier. (b) Typical electronic signal for frequency shifting. (c) Enhancement of the multiplexed source versus heralding rate. Inset: Heralding efficiency of the multiplexed source versus pump power. Green circles and blue diamonds are measured data while green and blue dashed curves are the result of theoretical calculation. Error bars are estimated using Poisson statistics.
    Threefold coincidences before (green diamonds) and after (blue diamonds) correction. Error bars are estimated using Poisson statistics.
    Fig. 8. Threefold coincidences before (green diamonds) and after (blue diamonds) correction. Error bars are estimated using Poisson statistics.
    YearTypes of SPSMUX DOFλ (nm)Modes Num.Temp.g(2)(0)Rate (kHz)EFRefs.
    2016HSPSSpace15502RT0.050.51.75[16]
    2016HSPSTime15454RT0.62[19]
    2016HSPSSpace & Time15478RT0.32.14[17]
    2016QD15508 K0.00044196[66]
    2016QD155080 K0.34[67]
    2017HSPSFreq.7953RT0.060.31[21]
    2018HSPSFreq.12803RT0.07232.2[22]
    2018QD7904 K0.00007560[68]
    2019HSPSOAM15503RT0.0484.21.47[24]
    2019HSPSTime159040RT0.00725.527.9[20]
    0.08820618.7
    0.2693349.7
    2019QD8901.5 K0.02513700[69]
    2020HSPSFreq.15653RT0.15122.7[23]
    0.010.82.7
    2021HSPSFreq.15323RT0.00063.12.8This work
    0.01421.11.2
    Table 1. Summary of Single-Photon Source (SPS) Performance among Previous Demonstrationsa
    Hao Yu, Chenzhi Yuan, Ruiming Zhang, Zichang Zhang, Hao Li, You Wang, Guangwei Deng, Lixing You, Haizhi Song, Zhiming Wang, Guang-Can Guo, Qiang Zhou. Spectrally multiplexed indistinguishable single-photon generation at telecom-band[J]. Photonics Research, 2022, 10(6): 1417
    Download Citation