• Photonics Research
  • Vol. 9, Issue 5, 722 (2021)
Jiaxin Gu1, Jie Liu1, Ziqi Bai1, Han Wang1, Xinyu Cheng1, Guanyu Li1, Menghua Zhang1, Xinxin Li1, Qi Shi1, Min Xiao1、2, and Xiaoshun Jiang1、*
Author Affiliations
  • 1National Laboratory of Solid State Microstructures, College of Engineering and Applied Science and School of Physics, Nanjing University, Nanjing 210093, China
  • 2Department of Physics, University of Arkansas, Fayetteville, Arkansas 72701, USA
  • show less
    DOI: 10.1364/PRJ.412840 Cite this Article Set citation alerts
    Jiaxin Gu, Jie Liu, Ziqi Bai, Han Wang, Xinyu Cheng, Guanyu Li, Menghua Zhang, Xinxin Li, Qi Shi, Min Xiao, Xiaoshun Jiang. Dry-etched ultrahigh-Q silica microdisk resonators on a silicon chip[J]. Photonics Research, 2021, 9(5): 722 Copy Citation Text show less
    Typical images and atomic force microscope measurement of the ultrahigh-Q wedged silica microdisk (diameter: 1 mm, thickness: 4 μm). (a) Optical micrograph showing the top view of the microdisk. (b) Side-view scanning electron microcopy image of the wedged silica microdisk. (c) 3D AFM scan of the top surface with RMS roughness of 0.72 nm and correlation length of 30 nm. (d) 3D AFM scan of the sidewall with RMS roughness of 0.67 nm and correlation length of 20 nm.
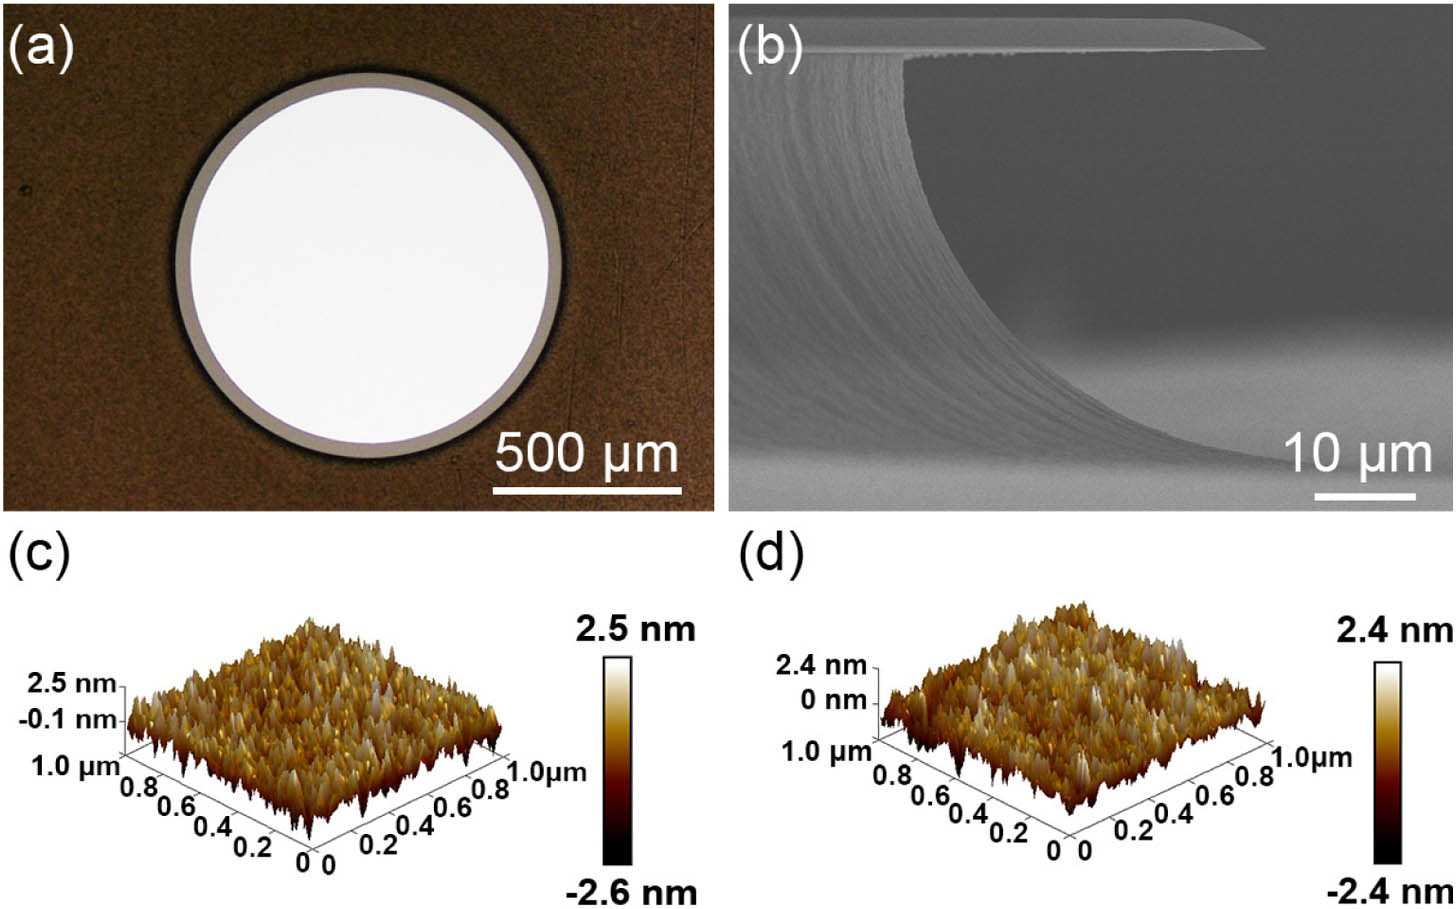
    Fig. 1. Typical images and atomic force microscope measurement of the ultrahigh-Q wedged silica microdisk (diameter: 1 mm, thickness: 4 μm). (a) Optical micrograph showing the top view of the microdisk. (b) Side-view scanning electron microcopy image of the wedged silica microdisk. (c) 3D AFM scan of the top surface with RMS roughness of 0.72 nm and correlation length of 30 nm. (d) 3D AFM scan of the sidewall with RMS roughness of 0.67 nm and correlation length of 20 nm.
    Fabrication process flow for the dry-etched wedged silica microdisk resonators. (a) Thermally grown silica layer on a silicon chip and subsequent deposition of an a-Si layer by plasma enhanced chemical vapor deposition (PECVD). (b) Pattern definition by UV lithography. (c) ICP etching to transfer the mask pattern to the silica layer. (d) Photoresist removal. (e) XeF2 etching to form the silicon pillar and remove the a-Si layer. (f) Colors used to indicate different materials.
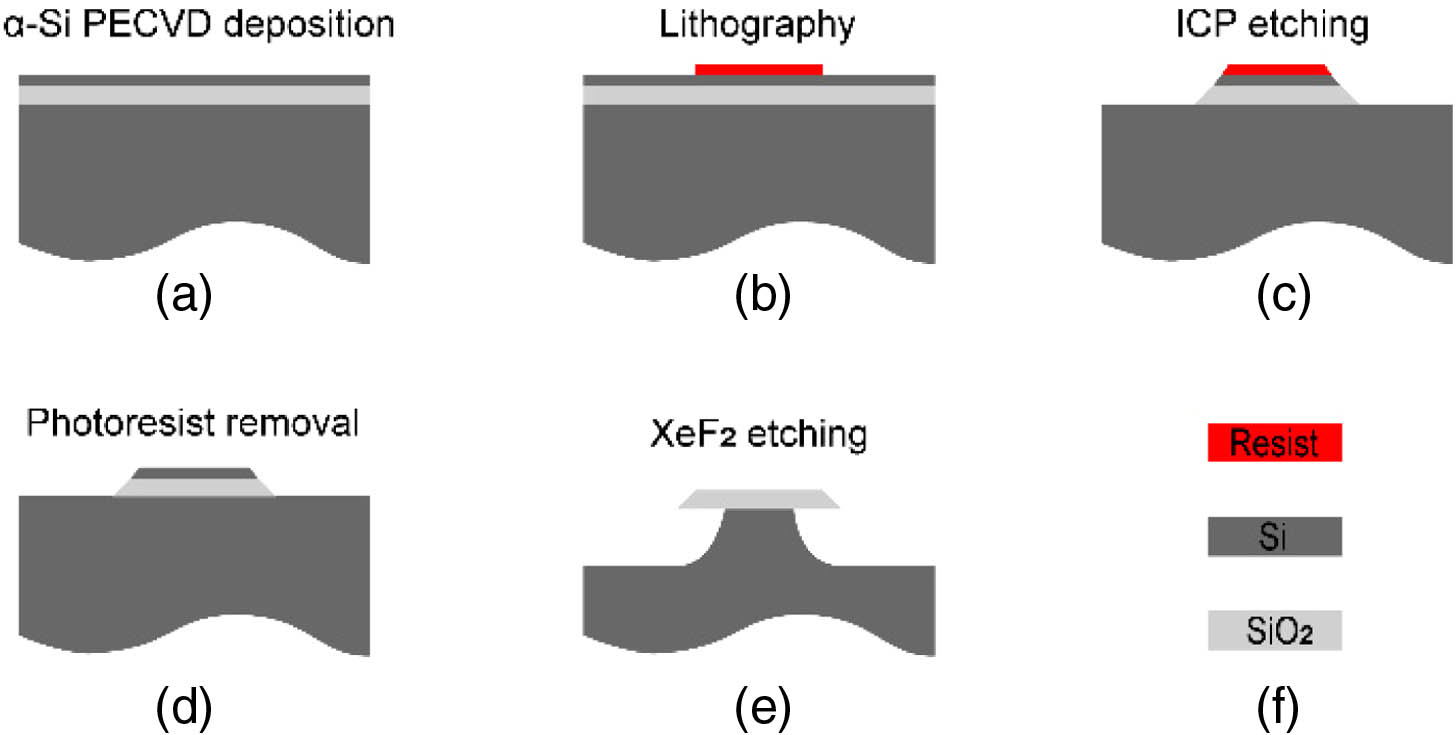
    Fig. 2. Fabrication process flow for the dry-etched wedged silica microdisk resonators. (a) Thermally grown silica layer on a silicon chip and subsequent deposition of an a-Si layer by plasma enhanced chemical vapor deposition (PECVD). (b) Pattern definition by UV lithography. (c) ICP etching to transfer the mask pattern to the silica layer. (d) Photoresist removal. (e) XeF2 etching to form the silicon pillar and remove the a-Si layer. (f) Colors used to indicate different materials.
    Comparison of intrinsic Q factors of samples from two distinct chips fabricated using different processes. Chip 1, standard process; Chip 2, optimized standard process by adding an a-Si layer, with (blue triangles) and without (red cycles) the additional thermal annealing process.
    Fig. 3. Comparison of intrinsic Q factors of samples from two distinct chips fabricated using different processes. Chip 1, standard process; Chip 2, optimized standard process by adding an a-Si layer, with (blue triangles) and without (red cycles) the additional thermal annealing process.
    Characterization of the ultrahigh-Q wedged silica microdisk. (a) Spectral scan for the case of a Q factor of 193.9 million with a full width at half-maximum (FWHM) of 0.996 MHz. The doublet feature in the transmission spectrum is caused by the mode coupling between the clockwise and counterclockwise propagation modes [33]. The sinusoidal curve accompanying the spectrum is a calibration scan using a fiber Mach–Zehnder interferometer. (b) Experimental ringing curve of the optical mode in (a) and its theoretical fit with a Q factor of 196.2 million.
    Fig. 4. Characterization of the ultrahigh-Q wedged silica microdisk. (a) Spectral scan for the case of a Q factor of 193.9 million with a full width at half-maximum (FWHM) of 0.996 MHz. The doublet feature in the transmission spectrum is caused by the mode coupling between the clockwise and counterclockwise propagation modes [33]. The sinusoidal curve accompanying the spectrum is a calibration scan using a fiber Mach–Zehnder interferometer. (b) Experimental ringing curve of the optical mode in (a) and its theoretical fit with a Q factor of 196.2 million.
    Sidebands’ power versus input pump power. The measured threshold is 1.63 mW for the silica microdisk. The inset shows the optical spectrum with the pump power of 1.66 mW.
    Fig. 5. Sidebands’ power versus input pump power. The measured threshold is 1.63 mW for the silica microdisk. The inset shows the optical spectrum with the pump power of 1.66 mW.
    Jiaxin Gu, Jie Liu, Ziqi Bai, Han Wang, Xinyu Cheng, Guanyu Li, Menghua Zhang, Xinxin Li, Qi Shi, Min Xiao, Xiaoshun Jiang. Dry-etched ultrahigh-Q silica microdisk resonators on a silicon chip[J]. Photonics Research, 2021, 9(5): 722
    Download Citation