
Weiqin Wei, Shuxin Ouyang, Tierui Zhang. Perylene diimide self-assembly: From electronic structural modulation to photocatalytic applications[J]. Journal of Semiconductors, 2020, 41(9): 091708
- Journal of Semiconductors
- Vol. 41, Issue 9, 091708 (2020)
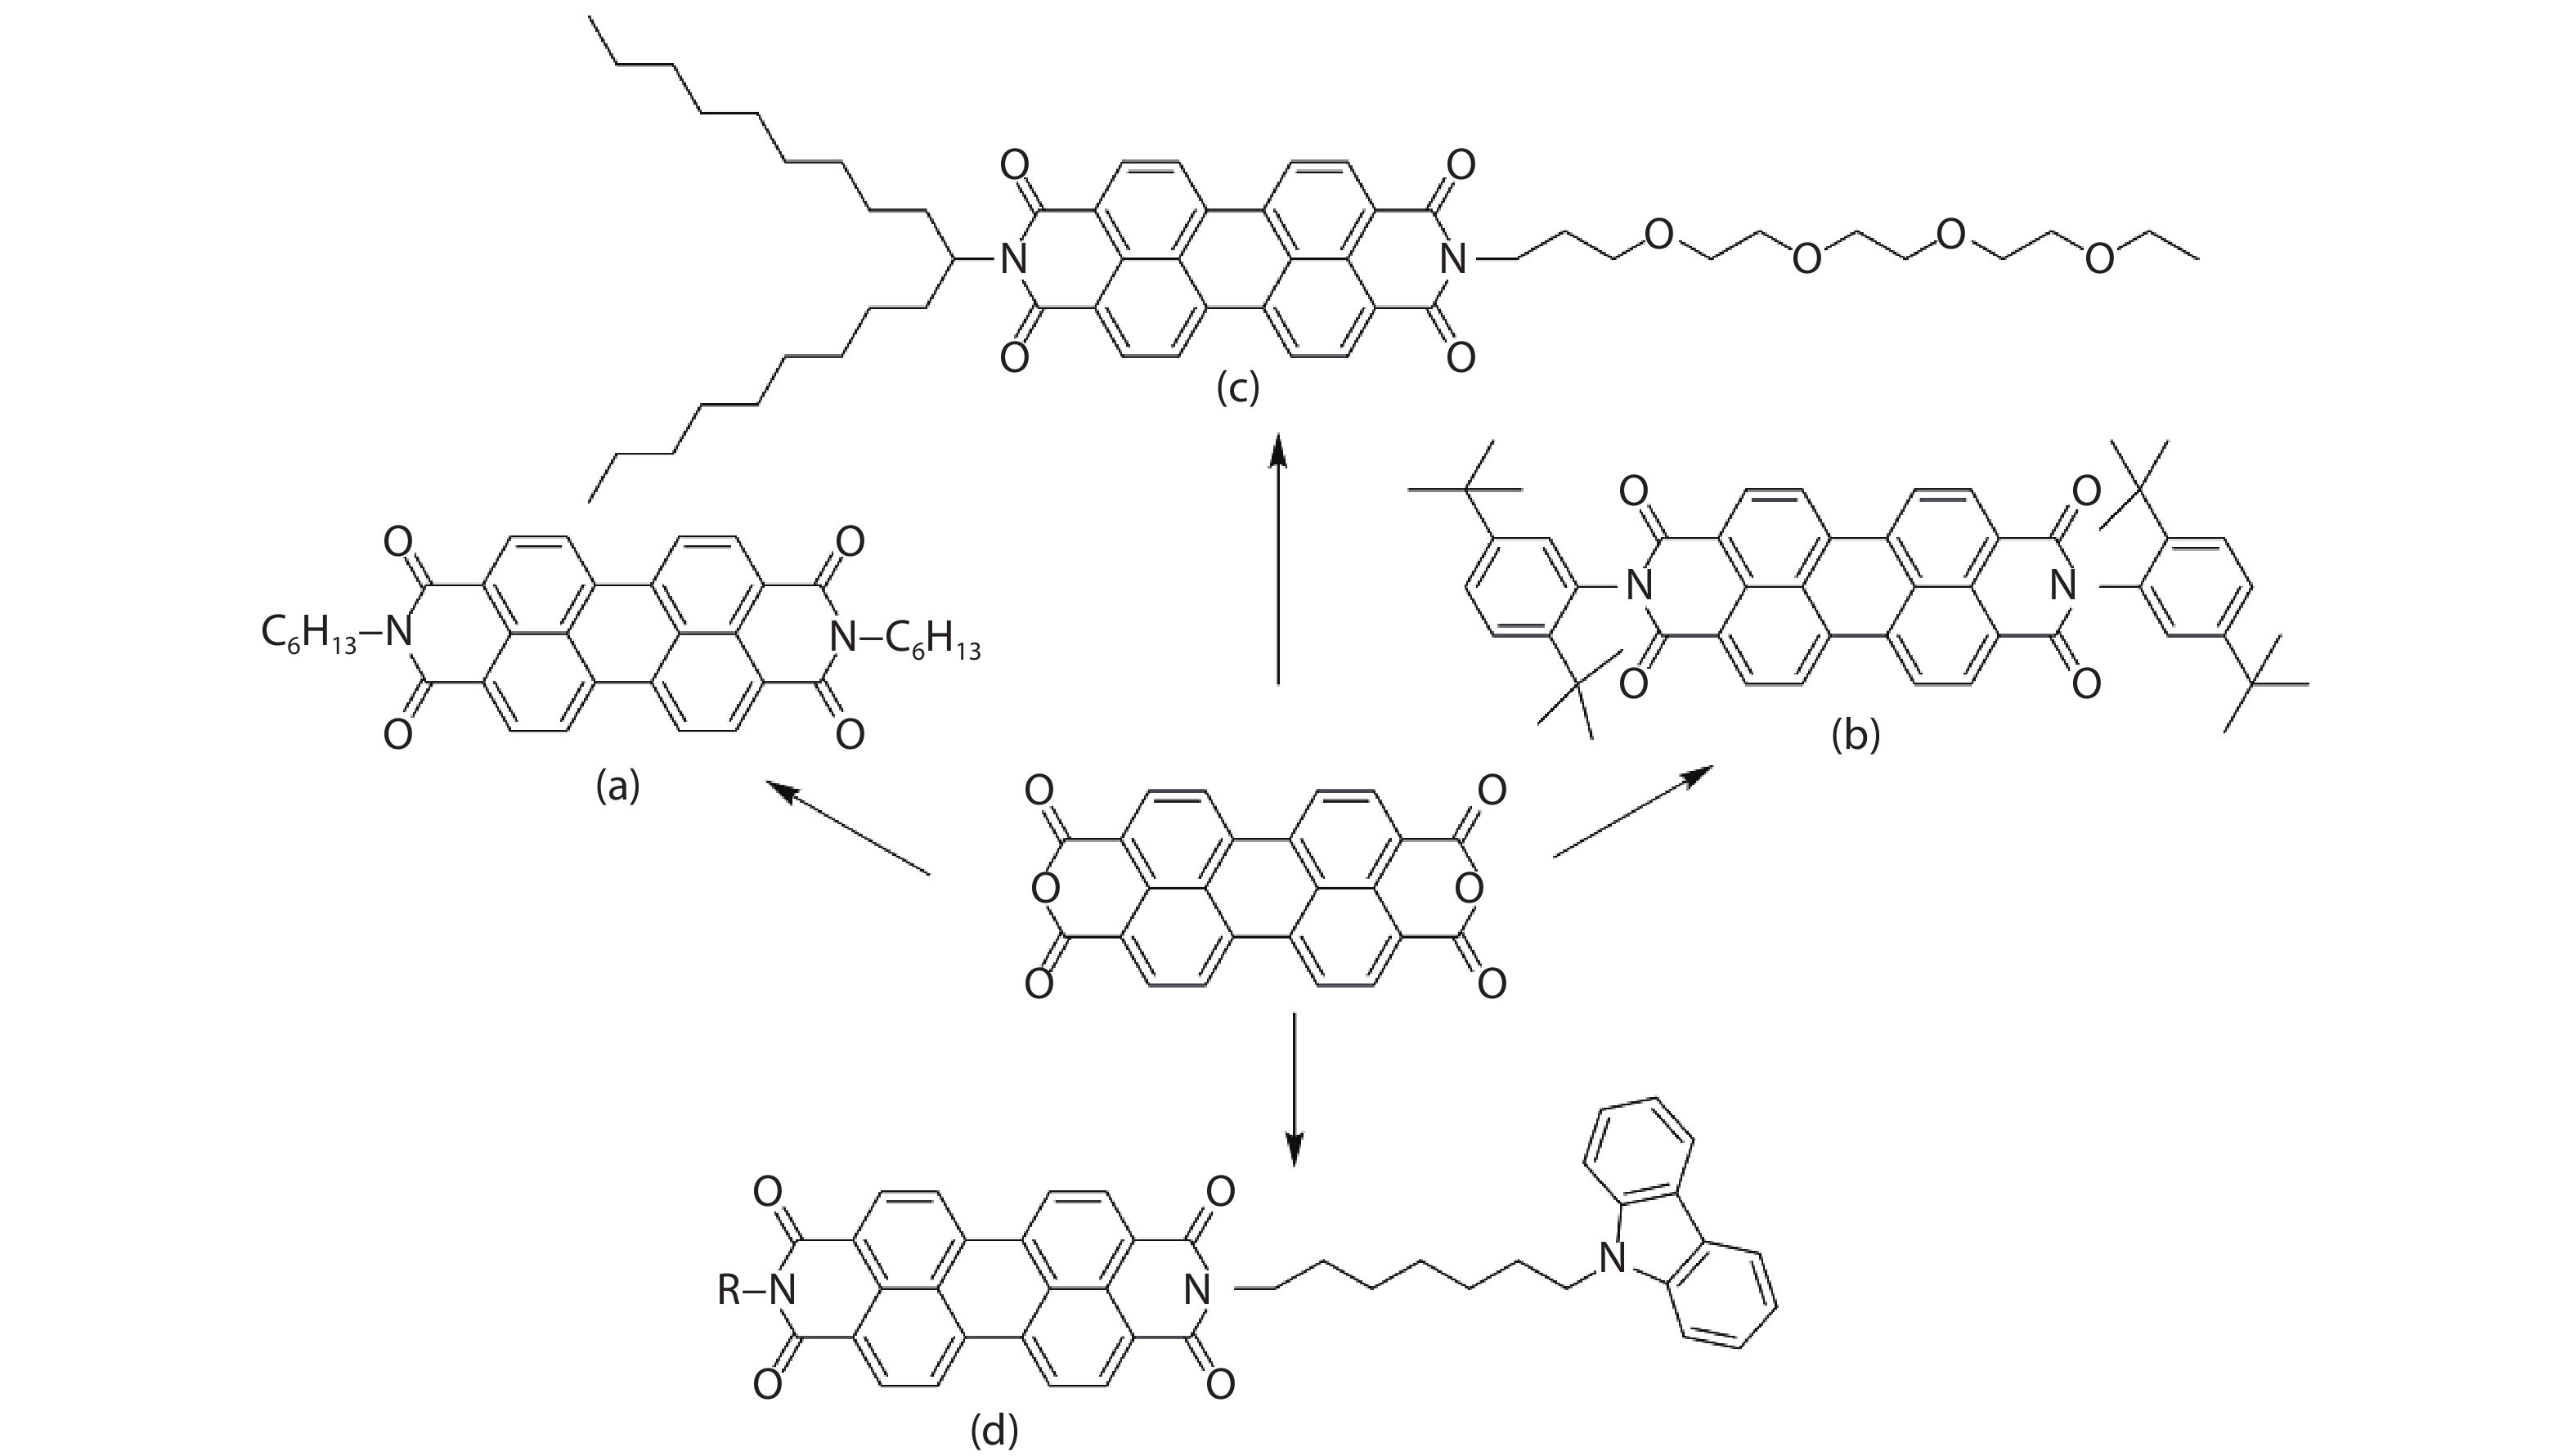
Fig. 1. (Color online) Bond lengths of PDI molecules (a) without side chains and (b) with side chains obtained via DFT calculations. (c) Frontier orbital energy levels of PDI molecules (1), (2), (3) and (4). (Method and basic set: B3LYP 6-31+G*).
Fig. 1. Symmetric and asymmetric structures of PDI molecules.
Fig. 2. (Color online) (a) Model diagram of the PDI Π–Π stacking-assembled structure with permission from Ref. [86 ]. Crystal formation of propoxyethyl-PDI in methanol: (b) absorption, fluorescence and (c) spectra recorded at different time intervals following the injection of a minimal volume of chloroform solution with permission from Ref. [75 ]. (d) A higher magnification image showing discrete particles in approximately spherical shape with permission from Ref. [72 ]. (e) A higher-magnification image showing discrete, straight nanobelts, on which another belt is piled in a twisted conformation with one edge faced up with permission from Ref. [72 ]. (f) A large-area SEM image showing the growth of long nanobelts from the central seeding particulate aggregates with permission from Ref. [98 ]. (g) SEM image of pristine nanofibers deposited on the silica with permission from Ref. [99 ].
Fig. 3. (Color online) (a) Mott–Schottky curves and (b) XPS valence-band spectrum of the self-assembled PDI supramolecular system. (c) Schematic illustration of the electronic energy level structure of PDI self-assembly with permission from Ref. [64 ].
Fig. 4. (Color online) (a) Schematic representation of the equilibrium between reduced form (PDI2–), intermediate (PDI–) and fully oxidized form (PDI). (b) Cyclic voltammograms of Br4Cl4PDI (PDI 2) and (CN)4Cl4PDI (PDI 3) in dichloromethane with permission from Ref. [151 ]. (c) Electronic circular dichroism, (b) UV-vis absorbance of WH[6] and WH[6][6] in dichloromethane (10-6 M, 1 cm path length) at room temperature with permission from Ref. [152 ]. (e) Cyclic voltammograms of 0.8 mM PDI in CHCl3/MeCN (3 : 2, v/v), 0.21 mM TDI in CHCl3/MeCN (4 : 1, v/v), and 0.1 mM QDI in CHCl3/MeCN (4 : 1, v/v). Scan rate: 0.5 V/s (electrolyte: 0.1 M TBAPF6) with permission from Ref. [153 ].
Fig. 5. (Color online) (a) Diagrams showing the approaches relative to binary solvent mixing and metal-ligand-coordination-directed method. TEM images of (b) bulk PDI and (c) nano PDI with permission from Ref. [74 ]. UV–vis absorption (black) and fluorescence excitation (blue) and emission spectra of a thin film of (d) ND-PDI and (e) DD-PDI spin-cast on glass from a chloroform solution with permission from Ref. [72 ]. (f) Calculated ratio of 0–0 and 1–0 oscillator strengths for the linear and symmetric series as a function of |J 0| using λ2 = 0.60 with permission from Ref. [162 ]. (g) Comparison of optical and electrical performance between various D/A heterojunctions with permission from Ref. [99 ]. The red and green columns denote fluorescence quenching and photocurrent measurement, respectively.
Fig. 6. (Color online) (a) Fluorescence decay transients measured at 470 nm for 2%, 8%, and 80% hybrids with permission from Ref. [8 ]. (b) Fluorescence decay transients measured at 450 nm for pure PDIH, PDI-A, TiO2/PDIH, and TiO2/PDI-A. (c) The energy levels based on different stacking arrangements between PDI molecules via DFT calculations with permission from Ref. [10 ].
Fig. 7. (Color online) Proposed mechanism of electron transmission in PDI self-assembly, wherein the HOMO and LUMO levels are obtained via DFT calculations.
Fig. 8. (Color online) (a) Photodegradation curves for phenol (5 ppm) over H-PDI and J-PDI under visible light with permission from Ref. [19 ]. (b) Kinetics of photocatalytic degradation of an aqueous PNP under visible-light irradiating various PDI/GCN and reference catalysts with permission from Ref. [196 ]. (c) The first-order kinetics curve fitting for electrocatalytic (EC), photocatalytic (PC) and photoelectrocatalytic (PEC) degradation of phenol by the PDI film (visible light, 2.1 V applied voltage) with permission from Ref. [81 ]. (d) PEC and EC degradation of phenol (5 ppm) on the PDI film at various applied voltages in Na2SO4 solution (0.1 mol/L) with permission from Ref. [81 ].
Fig. 9. (Color online) (a) The photocatalytic process with charge transfer and accumulation on the surface of PDI self-assembly. (b) H2 production histogram of CA gels prepared with NaCl, PDDA, CaCl2 and ascorbic acid compared to insoluble protonated CA with permission from Ref. [70 ]. All gel phases produce more H2 than the solid-phase CA powder. (c) Schematic of gel showing that CA nanoribbons (in red) trap solvent water molecules (not shown for clarity) within a 3D architecture with permission from Ref. [70 ].
Fig. 10. (Color online) (a) In vitro viability of HeLa cells with different concentrations of H-PDI and J-PDI at 600 ± 15 nm with permission from Ref. [19 ]. (b) Time-dependent tumor growth in a murine tumor model after treated with H-PDI and J-PDI with permission from Ref. [19 ]. (c) Thermal images of U87MG tumor-bearing mice after treatment with PBS and HMPDINs@TP upon 671 nm laser irradiation with permission from Ref. [84 ]. (d) Tumor growth curves of the mice after different treatments with permission from Ref. [89 ].

Set citation alerts for the article
Please enter your email address
© Copyright 2018-2021 | Chinese Laser Press. All Rights Reserved 沪ICP备15018463号-20