
Hao Sun, Mostafa Khalil, Zifei Wang, Lawrence R. Chen. Recent progress in integrated electro-optic frequency comb generation[J]. Journal of Semiconductors, 2021, 42(4): 041301
- Journal of Semiconductors
- Vol. 42, Issue 4, 041301 (2021)
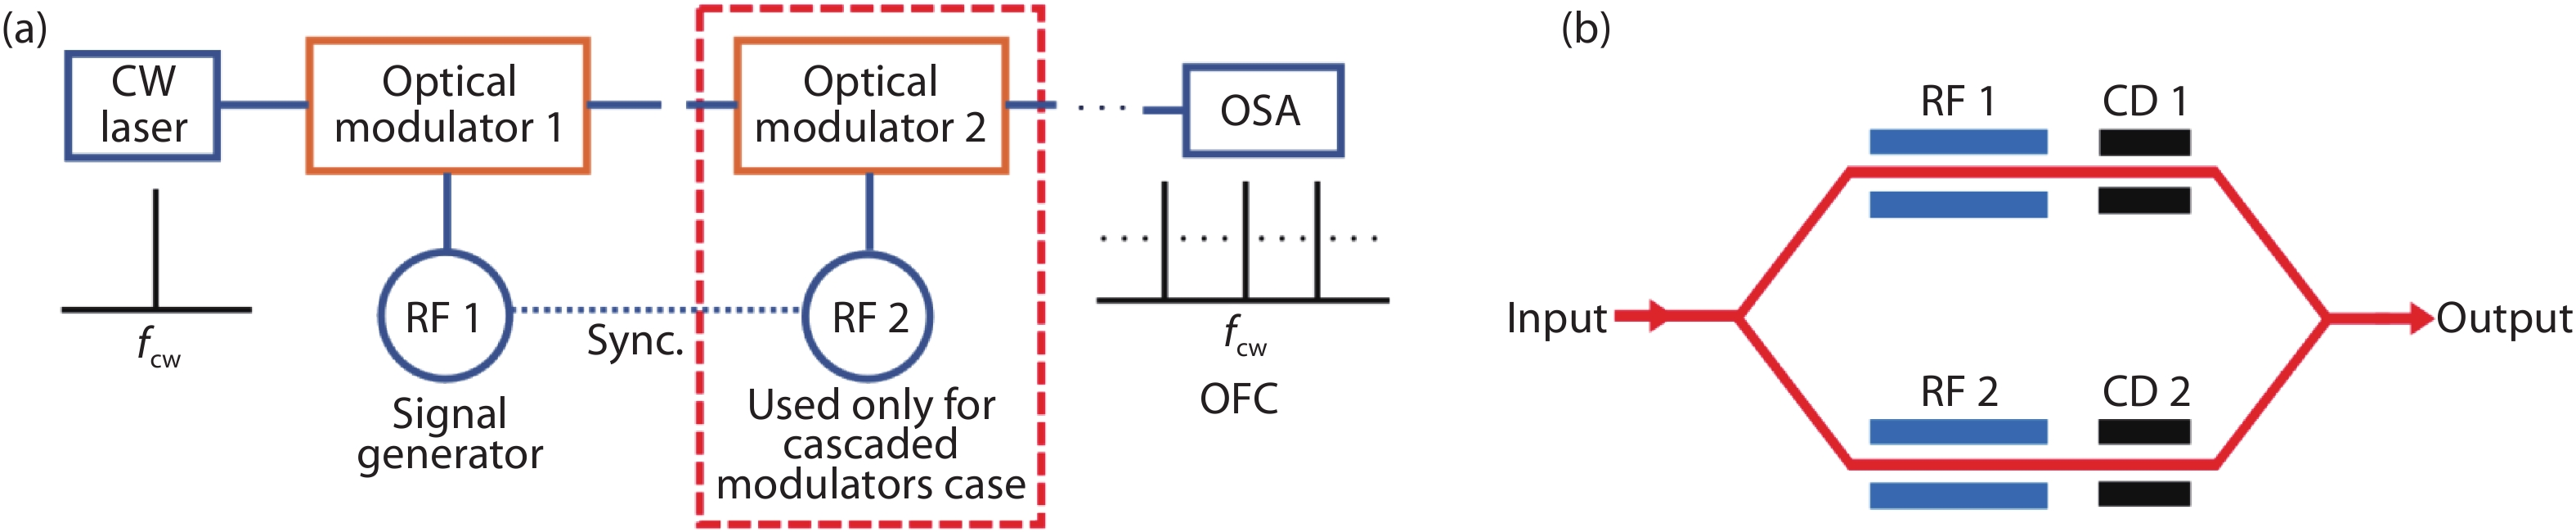
Fig. 1. (Color online) (a) Generic setup for OFC generation. (b) Schematic of a DD-MZM.
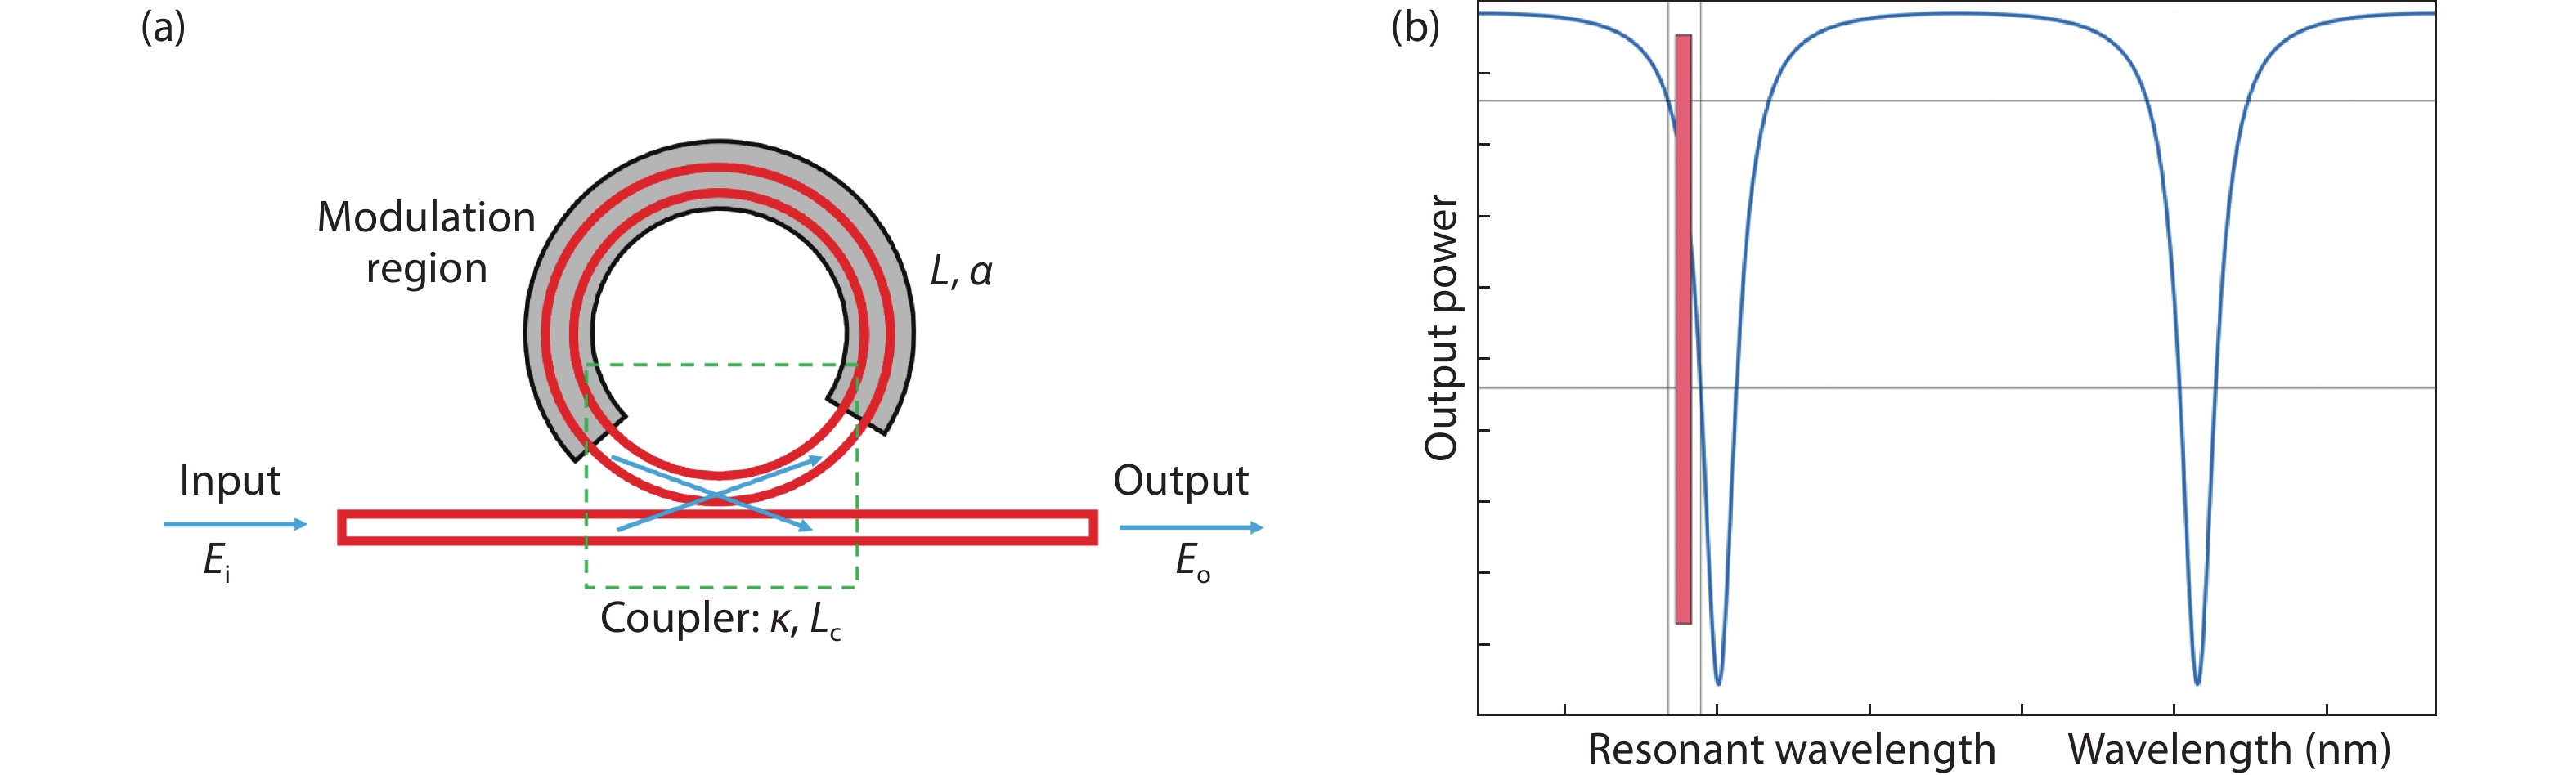
Fig. 2. (Color online) (a) Schematic of an intracavity MRM. (b) Transmission spectrum of an MRM (the input laser wavelength is shown in red for illustration).
Fig. 3. (Color online) OFC generation using different driving conditions: (a)
Fig. 4. (Color online) Schematic of the InP-based OFC generator in Refs. [44 , 45 ]. SMF: single mode fiber; MMI: multimode interferometer; DBR: distributed Bragg reflector; PM: phase modulator; SOA: semiconductor optical amplifier.
Fig. 5. (Color online) Typical experimental setup for OFC generation using (a) single MRM, (b) cascaded MRMs.
Fig. 6. (Color online) (a) Schematic of the proposed MRM. (b) Cross-section of the PN junction of the ring. (c) Microscopic image of one MRM. (d) S 11 and S 21 measurements of one MRM.
Fig. 7. (Color online) Transmission spectrum of one MRM in (a) forward bias and (b) reverse bias.
Fig. 8. (Color online) (a) Experimental setup. (b) Driving MRM 1 with 10 GHz and MRM 2 with 5 GHz. (c) Driving MRM 1 with 5 GHz and MRM 2 with 15 GHz. (d) Comb spectrum demonstrating 5 lines when driving MRM 1 at 20 GHz and MRM 2 at 10 GHz. (e) Temporal waveform of (b). (f) Temporal waveform of (c).
Fig. 9. (Color online) Schematic of cascaded MZMs for OFC generation.
Fig. 10. (Color online) Schematic of integrated cascaded MZM and PM (after Ref. [48 ]) and cascaded MZMs for EO OFC (after Ref. [53 ]).
Fig. 11. (Color online) Schematic of the OFC generator in silicon photonics.
Fig. 12. (Color online) Experimental results of the OFC in silicon photonics. (a–c) the OFCs with spacing from 5, 7.5, and 10 GHz; left: spectral profile; right: temporal signals.
|
Table 1. Parameters of the TW-MZM[51 ].
| ||||||||||||||||||||||||||||||||||||||||||||||||||||||||||||||||||||||||||||||||||||||||||||||||||||||||||||||||||||||||||||||||||||||||||||||||||||||||
Table 2. Summary of integrated EO OFC generation results.


Set citation alerts for the article
Please enter your email address

© Copyright 2018-2021 | Chinese Laser Press. All Rights Reserved 沪ICP备15018463号-20