
Lei Li, Chuandong Tan, Mingjuan Liao, Haijun Yu, Yarui Xi, Fenglin Liu. Analytic Reconstruction for Parallel Translational Computed Tomography Based on Radon Inverse Transform[J]. Acta Optica Sinica, 2021, 41(6): 0611003
- Acta Optica Sinica
- Vol. 41, Issue 6, 0611003 (2021)
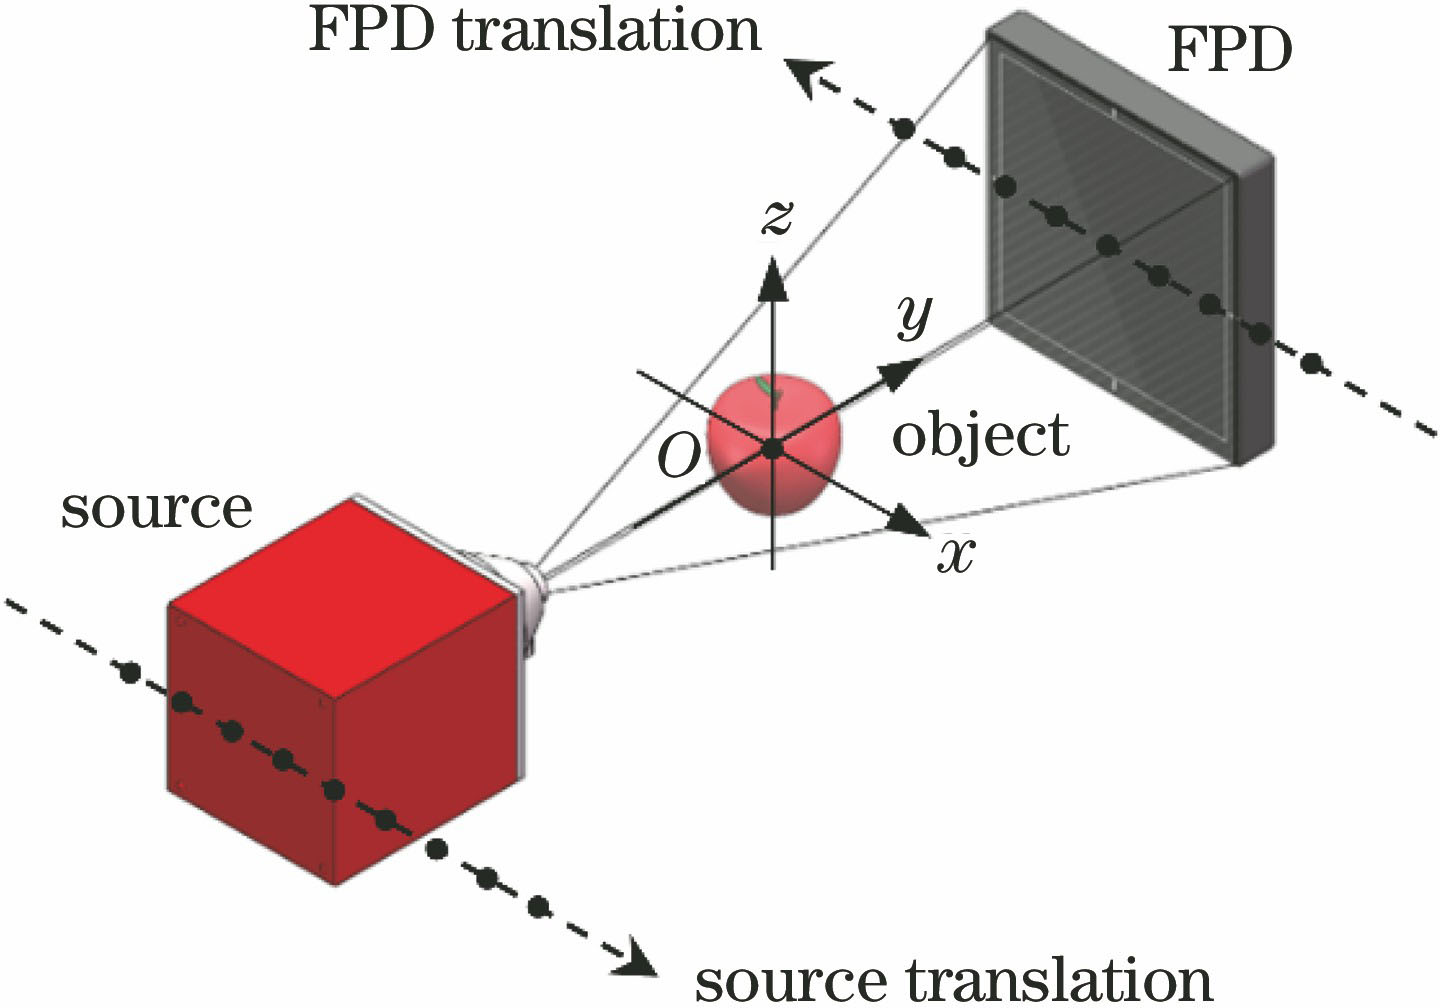
Fig. 1. Schematic diagram of PTCT scanning mode
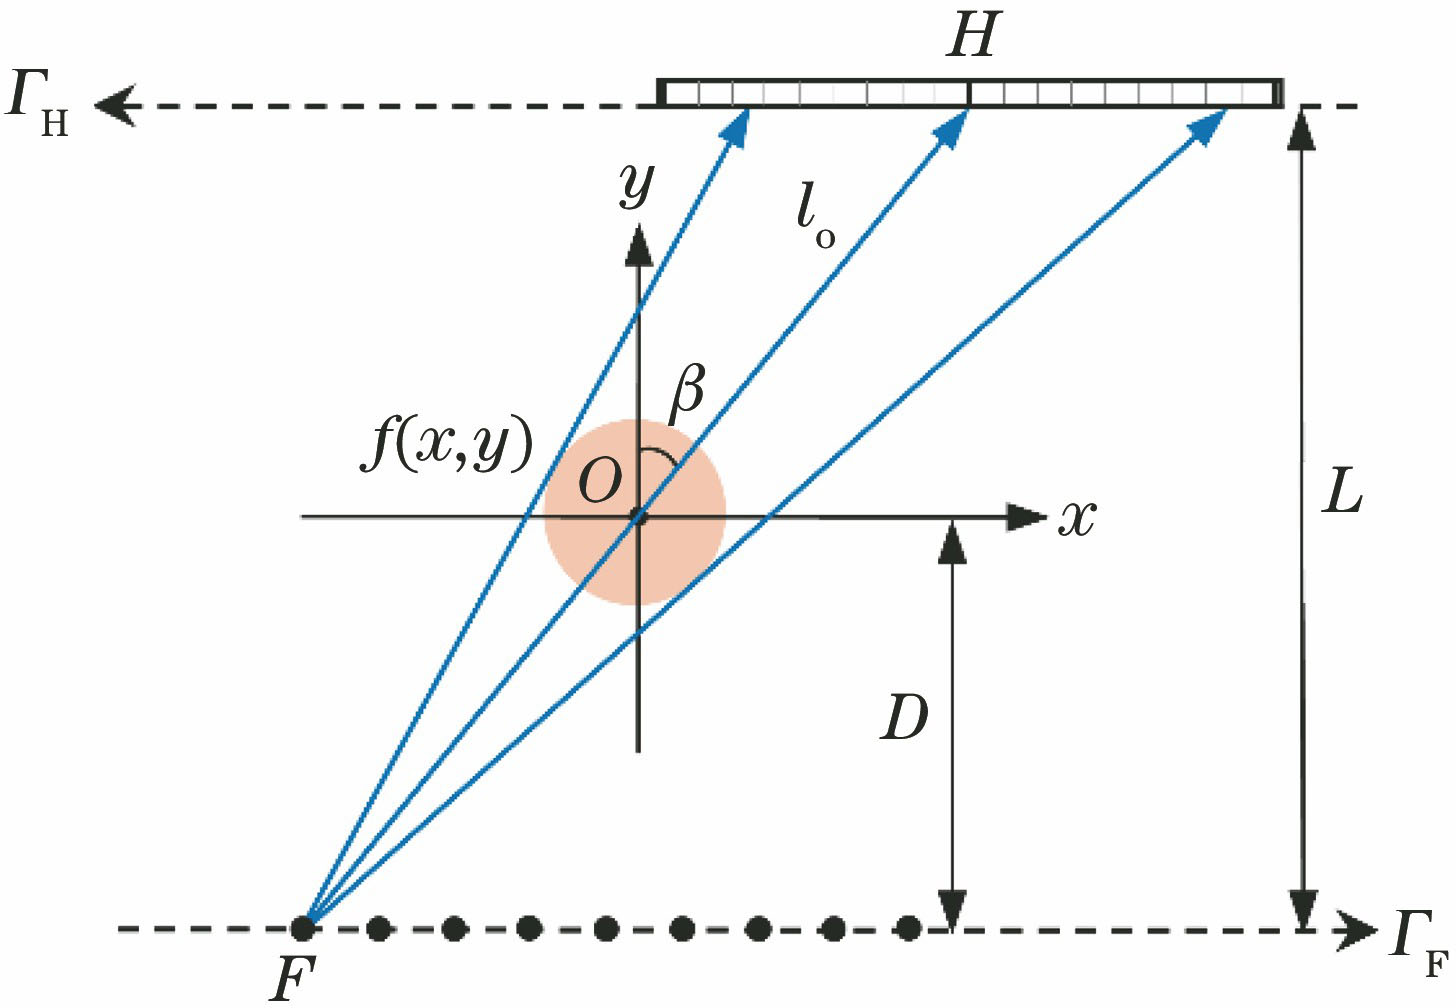
Fig. 2. Planar geometric model of PTCT
Fig. 3. Geometric model of multi-translation PTCT. (a) 4T geometric model; (b) 6T geometric model
Fig. 4. Parallel-beam geometric model of the 1T-PTCT
Fig. 5. Fan-beam geometric model of 1T-PTCT
Fig. 6. Reconstruct the geometric relationship of point M
Fig. 7. Schematic diagram of nth translation of PTCT coordinate system
Fig. 8. Reconstruction process by PTCT-DHB algorithm. (a) Original phantom image; (b) image reconstructed from the 1st translation’s projections; (c)--(e) images reconstructed from the 1st-2nd,1st-3rd, and 1st-4th translations’ projections, respectively; (f) final image reconstructed from 5T projections
Fig. 9. Images reconstructed by different algorithms. (a) Original phantom image; (b)--(d) images reconstructed by PTCT-SIRT algorithm, PTCT-FBP algorithm, and PTCT-DHB algorithm, respectively; (e)--(h) magnified images of rectangle selected regions of Fig. (a)--(d), respectively
Fig. 10. Profiles along the horizontal center of images reconstructed by different algorithms
Fig. 11. Experimental system of PTCT
Fig. 12. Images reconstructed by different algorithms. (a) PTCT-SIRT algorithm; (b) PTCT-FBP algorithm; (c) PTCT-DHB algorithm; (d)--(f) magnified images of rectangle selected regions of Fig. (a)--(c), respectively
Fig. 13. Amplitude-frequency characteristics of derivation operation and backward difference operation
|
Table 1. Parameters of numerical simulations
|
Table 2. Quantitative metrics of images reconstructed by different algorithms
|
Table 3. Parameters of the practical experiment


Set citation alerts for the article
Please enter your email address

© Copyright 2018-2021 | Chinese Laser Press. All Rights Reserved 沪ICP备15018463号-20