
A. A. Ovechkin, P. A. Loboda, A. S. Korolev, S. V. Kolchugin, I. Yu. Vichev, A. D. Solomyannaya, D. A. Kim, A. S. Grushin. Ionization balance of non-LTE plasmas from an average-atom collisional-radiative model[J]. Matter and Radiation at Extremes, 2022, 7(6): 064401
- Matter and Radiation at Extremes
- Vol. 7, Issue 6, 064401 (2022)
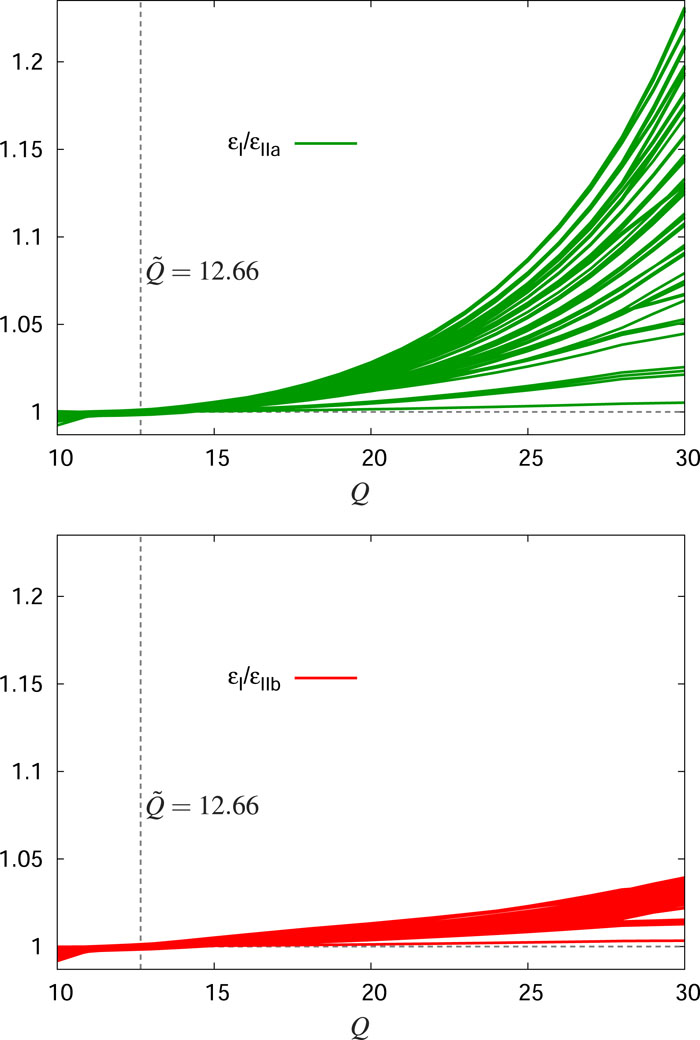
Fig. 1. Ratios of one-electron energies of subshells with principal quantum numbers n = 1, …, 8 as calculated using methods I and IIa /IIb for basic configurations of Q -electron ions occurring in a gold plasma at T e = 1 keV, ρ = 0.1 g/cm3, and various departures from LTE. The vertical dashed line indicates the relevant LTE value Q ̃ = 12.66
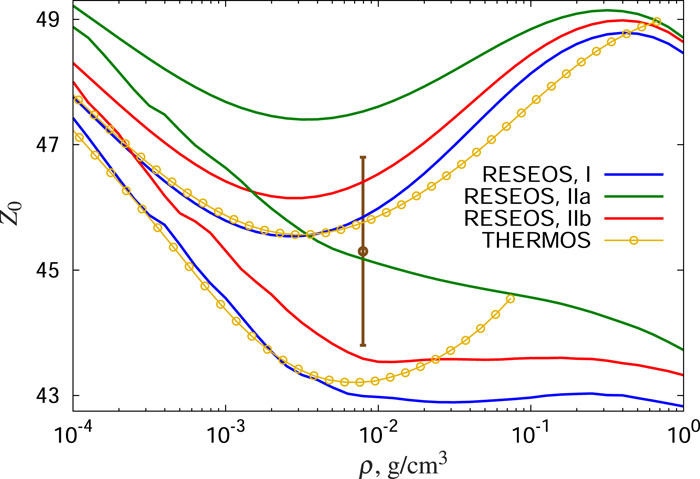
Fig. 2. Average ion charge isotherms for gold at T e = 0.8 keV and T r = 185 eV calculated using the RESEOS code in various approximations (methods I, IIa , and IIb ) and the THERMOS code with (lower curves) and without (upper curves) account being taken of two-electron processes (autoionization and dielectronic capture), compared with the experimental values from Ref. 26 (brown symbols).
Fig. 3. Average ion charge isotherms for gold at T e = 1.4 keV and T r = 0 calculated using the RESEOS code in various approximations [methods I, IIa , IIb , and IIb without the IPD term in Eq. (51) ] and the THERMOS code with (lower curves) and without (upper curves) account being taken of two-electron processes (autoionization and dielectronic capture), compared with the experimental values from Ref. 26 (brown symbols).
Fig. 4. Average ion charge isotherms for gold at T e = 1.4 keV and T r = 185 eV. The colors, lines, and symbols have the same meanings as in Fig. 2 .
Fig. 5. Average ion charge isotherms for gold at T e = 2 keV and T r = 0. The colors, lines, and symbols have the same meanings as in Fig. 2 .
Fig. 6. Average ion charge isotherms for gold at T e = 2 keV, T r = 185 eV. The colors, lines, and symbols have the same meanings as in Fig. 2 .
Fig. 7. Average ion charge isotherms for gold at T e = 1.7 keV, T r = 0. The colors, lines, and symbols have the same meanings as in Fig. 2 .
Fig. 8. Average ion charge isotherms for gold at T e = 2.4 keV, T r = 0. The colors, lines, and symbols have the same meanings as in Fig. 2 .
Fig. 9. Average ion charge isotherms for gold at T e = 2 keV and T r = 0 calculated using RESEOS by method IIb with (lower curves) and without (upper curves) account being taken of two-electron processes using bound–free oscillator strengths given by Eq. (20) (red curves), (19) (green curves), and (17) (blue curves), compared with the experimental values from Ref. 26 (brown symbols).
Fig. 10. Charge state distribution of gold at T e = 1.4 keV and T r = 185 eV calculated using the RESEOS code with method IIb and the distorted-wave approximation for the bound–free oscillator strengths (red curve, Z 0 = 47.17) and using the THERMOS code (blue curve, Z 0 = 47.24), compared with the experimental data of Ref. 26 (brown symbols, Z 0 = 47.9 ± 1.4). The calculations were carried out with account taken of two-electron processes for the experimental values of material density ρ = 6.8 × 10⁻³ g/cm3 (RESEOS) and free-electron density Z 0 n i 0 = 1 0 21
Fig. 11. Same as Fig. 10 for T e = 2.4 keV, T r = 0, ρ = 4 × 10⁻³ g/cm3, and Z 0 n i 0 = 6 × 1 0 20 Z 0 RESEOS = 48.27 Z 0 THERMOS = 48.81 Z 0 exp = 49.5 ± 0.5
Fig. 12. Emission intensity of gold for the conditions of Fig. 10 . The experimental data26 are in brown, and the THERMOS and RESEOS results are in blue and red, respectively. Note that the diagnostic lines of potassium are absent from the calculated THERMOS and RESEOS spectra.
Fig. 13. Emission intensity of gold for the conditions of Fig. 11 . The experimental data26 are in brown, and the THERMOS and RESEOS results are in blue and red, respectively. Note that the diagnostic lines of potassium are absent from the calculated THERMOS and RESEOS spectra.
Fig. 14. Ratios of specific electron internal energy to free-electron temperature for gold at ρ = 10−2 g/cm3 calculated in the LTE approximation (dashed curves) and without the use of the LTE approximation at T r = 0 (solid curves). Blue, orange, and green curves represent the calculations using method I with Eqs. (62) –(68) , method I with Eq. (74) , and method IIa with Eq. (74) , respectively. Two-electron processes are ignored.
Fig. 15. Same as Fig. 14 at T e = 1 keV.
Fig. 16. Ratios of specific electron internal energy to free-electron temperature for gold at ρ = 10−2 g/cm3 as calculated in the LTE approximation (cyan solid curve) and without the use of the LTE approximation at T r = 0. The LTE energy is obtained using method I with Eqs. (62) –(68) , while the departure of the NLTE energy from its LTE counterpart is evaluated using method I with the same Eqs. (62) –(68) (blue solid curve) or with Eq. (74) (orange dashed curve), or using method IIa /IIb with Eq. (74) (green solid/red dashed curve). Two-electron processes are ignored.
Fig. 17. Same as Fig. 16 at T e = 1 keV.
Fig. 18. Ratios of electron pressure to the product of the free-electron temperature and the material density for gold at ρ = 10−2 g/cm3 as calculated in the LTE approximation (upper curves) and without the use of the LTE approximation at T r = 0 (lower curves) using method I with Eqs. (69) –(72) (blue solid curves) and method IIa with Eq. (75) (green dashed curves). Two-electron processes are ignored.
Fig. 19. Same as in Fig. 18 at T e = 1 keV.

Set citation alerts for the article
Please enter your email address
© Copyright 2018-2021 | Chinese Laser Press. All Rights Reserved 沪ICP备15018463号-20