• Advanced Photonics Nexus
  • Vol. 2, Issue 5, 054001 (2023)
Jinge Yang1、†, Seongwook Choi1, Jiwoong Kim1, Byullee Park2、*, and Chulhong Kim1、*
Author Affiliations
  • 1Pohang University of Science and Technology, School of Interdisciplinary Bioscience and Bioengineering, Graduate School of Artificial Intelligence, Medical Device Innovation Center, Department of Electrical Engineering, Convergence IT Engineering, and Mechanical Engineering, Pohang, Republic of Korea
  • 2Sungkyunkwan University, Institute of Quantum Biophysics, Department of Biophysics, Suwon, Republic of Korea
  • show less
    DOI: 10.1117/1.APN.2.5.054001 Cite this Article Set citation alerts
    Jinge Yang, Seongwook Choi, Jiwoong Kim, Byullee Park, Chulhong Kim. Recent advances in deep-learning-enhanced photoacoustic imaging[J]. Advanced Photonics Nexus, 2023, 2(5): 054001 Copy Citation Text show less
    Representations of seven major challenges in PAI, and DL-related methods to overcome them. DAS, delay-and-sum; DL, deep learning; BF-H&E, bright-field hematoxylin and eosin staining. The images are adapted with permission from Ref. 52, © 2021 Wiley-VCH GmbH; Ref. 53, © 2020 Optica; Ref. 54, © 2022 Optica; Ref. 55, © 2020 Elsevier GmbH; Ref. 56, CC-BY; Ref. 57, © 2021 Elsevier GmbH; and Ref. 58, © 2021 Elsevier GmbH.
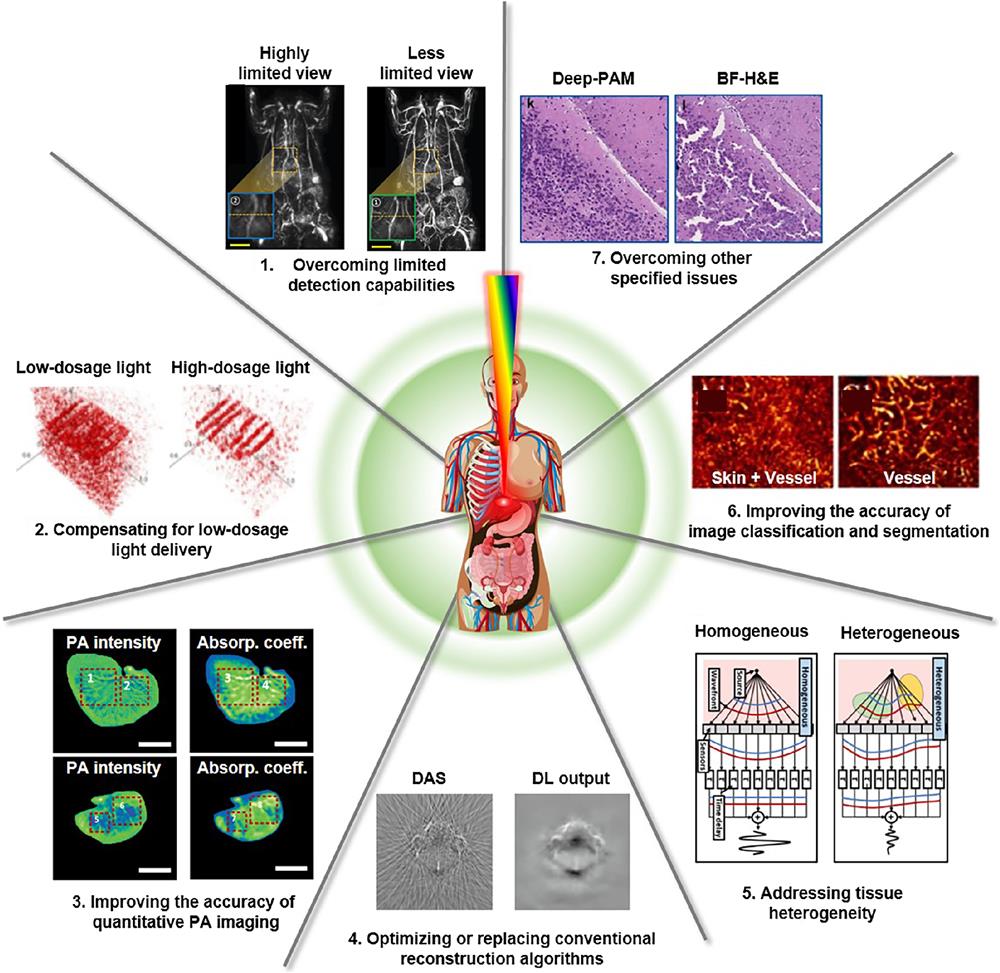
    Fig. 1. Representations of seven major challenges in PAI, and DL-related methods to overcome them. DAS, delay-and-sum; DL, deep learning; BF-H&E, bright-field hematoxylin and eosin staining. The images are adapted with permission from Ref. 52, © 2021 Wiley-VCH GmbH; Ref. 53, © 2020 Optica; Ref. 54, © 2022 Optica; Ref. 55, © 2020 Elsevier GmbH; Ref. 56, CC-BY; Ref. 57, © 2021 Elsevier GmbH; and Ref. 58, © 2021 Elsevier GmbH.
    The concept of (a) a biological neural network and (b) an ANN derived from (a). (c) Schematics of a simple neural network and a DNN.
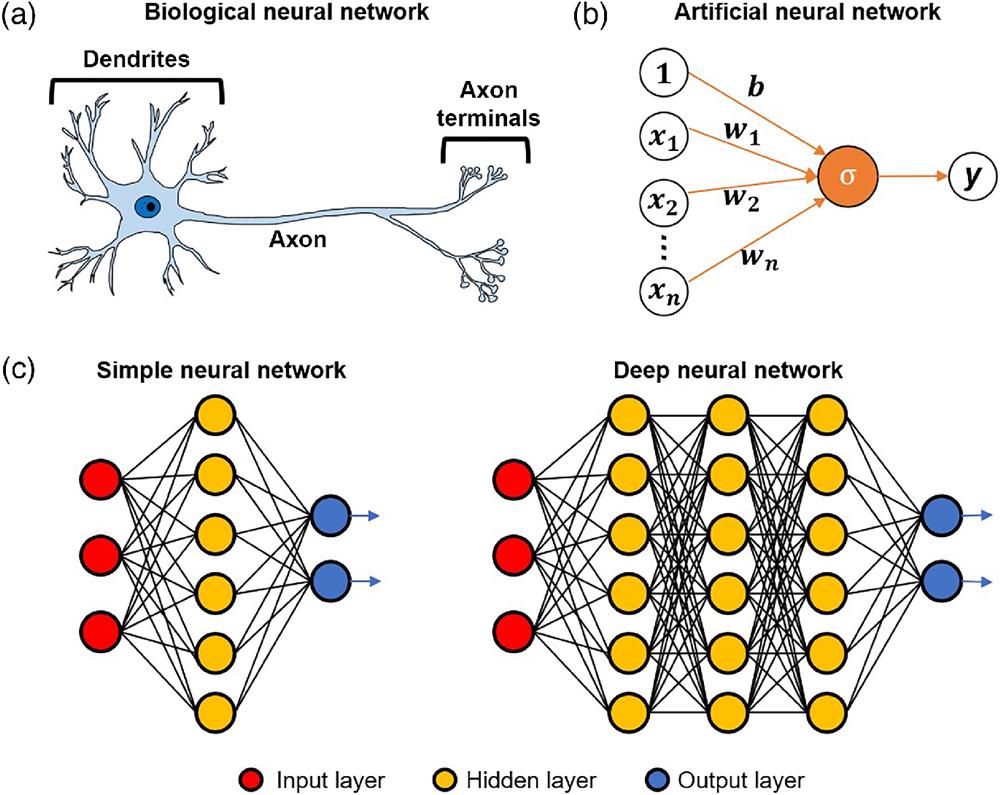
    Fig. 2. The concept of (a) a biological neural network and (b) an ANN derived from (a). (c) Schematics of a simple neural network and a DNN.
    Three typical neural network architectures for biomedical imaging. (a) CNN, (b) U-Net, and (c) GAN.
    Fig. 3. Three typical neural network architectures for biomedical imaging. (a) CNN, (b) U-Net, and (c) GAN.
    Representative studies using DL methods to overcome limited-detection capabilities. (a) A DNN with five fully connected layers enhances bandwidth. (b) LV-GAN for addressing the limited-view problem. (c) A Y-Net generates the PA images by optimizing both raw data and reconstructed images from the traditional method. (d) A 3D progressive U-Net (3D-pUnet) to diminish the effects of limited-view artifacts and sparsity arising from cluster view detection. The images are adapted with permission from Ref. 76, © 2017 SPIE; Ref. 77, © 2020 Wiley-VCH GmbH; Ref. 78, © 2020 Elsevier GmbH; and Ref. 52, © 2021 Wiley-VCH GmbH. BW, bandwidth; DNN, deep neural network; DAS, delay-and-sum; cluster, cluster view detection; full, full view detection.
    Fig. 4. Representative studies using DL methods to overcome limited-detection capabilities. (a) A DNN with five fully connected layers enhances bandwidth. (b) LV-GAN for addressing the limited-view problem. (c) A Y-Net generates the PA images by optimizing both raw data and reconstructed images from the traditional method. (d) A 3D progressive U-Net (3D-pUnet) to diminish the effects of limited-view artifacts and sparsity arising from cluster view detection. The images are adapted with permission from Ref. 76, © 2017 SPIE; Ref. 77, © 2020 Wiley-VCH GmbH; Ref. 78, © 2020 Elsevier GmbH; and Ref. 52, © 2021 Wiley-VCH GmbH. BW, bandwidth; DNN, deep neural network; DAS, delay-and-sum; cluster, cluster view detection; full, full view detection.
    Representative DL approaches compensate for low laser dosage. (a) An MWCNN that generates high-quality PA images from low-fluence PA images. (b) An HD-UNet that enhances the image quality in a pulsed-laser diode PACT system. (c) An MT-RDN that performs image denoising, superresolution, and vascular enhancement. The images are adapted with permission from Ref. 53, © 2020 Optica; Ref. 109, © 2022 SPIE; and Ref. 110, © 2020 Wiley-VCH GmbH. MWCNN, multi-level wavelet-convolutional neural network; HD-UNet, hybrid dense U-Net; MT-RDN, multitask residual dense network.
    Fig. 5. Representative DL approaches compensate for low laser dosage. (a) An MWCNN that generates high-quality PA images from low-fluence PA images. (b) An HD-UNet that enhances the image quality in a pulsed-laser diode PACT system. (c) An MT-RDN that performs image denoising, superresolution, and vascular enhancement. The images are adapted with permission from Ref. 53, © 2020 Optica; Ref. 109, © 2022 SPIE; and Ref. 110, © 2020 Wiley-VCH GmbH. MWCNN, multi-level wavelet-convolutional neural network; HD-UNet, hybrid dense U-Net; MT-RDN, multitask residual dense network.
    Representative studies to improve the accuracy of quantitative PAI by DL. (a) Convolutional encoder–decoder type network with skip connections (EDS) to produce accurate estimates of sO2 in a 3D data set. (b) Dual-path network based on U-Net (QPAT-Net) to reconstruct images of the absorption coefficient for deep tissues. (c) US-enhanced U-Net model (US-UNet) to reconstruct the optical absorption distribution. The images are adapted with permission from Ref. 124, © 2020 SPIE; Ref. 54, © 2022 Optica; and Ref. 125, © 2022 Elsevier GmbH.
    Fig. 6. Representative studies to improve the accuracy of quantitative PAI by DL. (a) Convolutional encoder–decoder type network with skip connections (EDS) to produce accurate estimates of sO2 in a 3D data set. (b) Dual-path network based on U-Net (QPAT-Net) to reconstruct images of the absorption coefficient for deep tissues. (c) US-enhanced U-Net model (US-UNet) to reconstruct the optical absorption distribution. The images are adapted with permission from Ref. 124, © 2020 SPIE; Ref. 54, © 2022 Optica; and Ref. 125, © 2022 Elsevier GmbH.
    Representative studies to optimize conventional reconstruction algorithms or replace them with DL. (a) Pixel-wise interpolation approach followed by an FD-UNet for limited-view and sparse PAT image reconstruction. (b) End-to-end U-Net with residual blocks to reconstruct PA images. (c) Two-step PA image reconstruction process with FPnet and U-Net. The images are adapted with permission from Ref. 137, © 2020 Nature Publishing Group; Ref. 138, © 2020 Optica; and Ref. 55, © 2020 Elsevier GmbH.
    Fig. 7. Representative studies to optimize conventional reconstruction algorithms or replace them with DL. (a) Pixel-wise interpolation approach followed by an FD-UNet for limited-view and sparse PAT image reconstruction. (b) End-to-end U-Net with residual blocks to reconstruct PA images. (c) Two-step PA image reconstruction process with FPnet and U-Net. The images are adapted with permission from Ref. 137, © 2020 Nature Publishing Group; Ref. 138, © 2020 Optica; and Ref. 55, © 2020 Elsevier GmbH.
    Representative DL studies to correct the SoS and improve the accuracy of image classification and segmentation. (a) Hybrid DNN model including U-Net and Segnet to mitigate SOS aberration in heterogeneous tissue. (b) Sparse-UNet (S-UNet) for automatic vascular segmentation in MSOT images. The images are adapted with permission from Ref. 153, CC-BY; Ref. 154, © Elsevier GmbH.
    Fig. 8. Representative DL studies to correct the SoS and improve the accuracy of image classification and segmentation. (a) Hybrid DNN model including U-Net and Segnet to mitigate SOS aberration in heterogeneous tissue. (b) Sparse-UNet (S-UNet) for automatic vascular segmentation in MSOT images. The images are adapted with permission from Ref. 153, CC-BY; Ref. 154, © Elsevier GmbH.
    Representative studies using DL to solve specific issues. (a) GAN-based framework (Wasserstein GAN) to enhance the spatial resolution of AR-PAM. (b) GAN with U-Net to reconstruct superresolution images from raw image frames. (c) Deep-PAM generates virtually stained histological images for both thin sections and thick fresh tissue specimens. The images are adapted with permission from Ref. 178, © 2021 Elsevier GmbH; Ref. 180, © 2022 Springer Nature; and Ref. 58, © 2021 Elsevier GmbH. BF-H&E, brightfield hematoxylin and eosin staining; DNN, deep neural network.
    Fig. 9. Representative studies using DL to solve specific issues. (a) GAN-based framework (Wasserstein GAN) to enhance the spatial resolution of AR-PAM. (b) GAN with U-Net to reconstruct superresolution images from raw image frames. (c) Deep-PAM generates virtually stained histological images for both thin sections and thick fresh tissue specimens. The images are adapted with permission from Ref. 178, © 2021 Elsevier GmbH; Ref. 180, © 2022 Springer Nature; and Ref. 58, © 2021 Elsevier GmbH. BF-H&E, brightfield hematoxylin and eosin staining; DNN, deep neural network.
    SectionTitleChallenges to be solved
    3.1Overcoming limited detection capabilitiesRestricted bandwidth, limited detection view, sampling sparsity
    3.2Compensating for low-dosage light deliveryLow SNR in the low-dosage light-delivery system
    3.3Improving the accuracy of quantitative PA imagingInaccuracy in quantitative estimates (sO2, optical absorption coefficient)
    3.4Optimizing or replacing conventional reconstruction algorithmsLimitations in conventional reconstruction algorithms
    3.5Addressing tissue heterogeneityAcoustic reflection and imaging artifacts led by tissue heterogeneity
    3.6Improving the accuracy of image classification and segmentationInaccuracy and rough classification and segmentation of PA image
    3.7Overcoming other specified issuesMotion artifacts, limited spatial resolution, electrical noise and interference, image misalignment, accelerating superresolution imaging, achieving digital histologic staining
    Table 1. Summary of challenges facing PAI.
    NetworkKey featureUse case
    CNNPerforms convolution operation for feature extraction.Image enhancement
    Exhibits outstanding performance in feature extraction.Image classification and object detection
    Captures spatial information of input data efficiently.Image segmentation
    U-NetComprises an encoder–decoder structure.Image enhancement
    Utilizes skip connections to leverage high-resolution feature maps.
    Demonstrates strong performance even with small data sets.Image segmentation
    Excels in segmentation tasks.
    GANConsists of a generator network and a discriminator network.Image generation
    Generates data that closely resembles real input data (generator).
    Discriminates between generated data and real data (discriminator).Image style transfer
    Engages in competitive training between the generator and discriminator.Image/data augmentation
    Applies for generating new data.
    Table 2. Three representative networks.
    AuthorNeural network architectureBasic networkTraining data set (if specified, validation is excluded)Test data setSpecified taskRepresentative evaluation results
    SourceData amount
    Gutte et al.76FC-DNNCNNSimulation of the breast phantom286,300 slices (from 2863 volumes)Simulation/in vitro phantomReduce limited-bandwidth artifactsCNR (versus DAS) 0.01 → 2.54
    PC 0.22 → 0.75
    Deng et al.83U-Net and VGGU-NetIn vivo mouse liver50Numerical simulation data/in vitro phantom/in vivo dataReduce limited-view artifacts from the circular US arraySSIM (versus DAS) 0.39 → 0.91
    PSNR 7.54 → 24.34
    Zhang et al.85DuDoUnetU-Netk-Wave simulation1500k-Wave simulationReduce limited-view artifacts from the linear US arraySSIM (versus U-Net) 0.909 → 0.935
    PSNR 19.4 → 20.8
    Lu et al.77LV-GANGANk-Wave simulation of absorbers and vessels/in vitro phantom of microsphere and vessel structure793 pairs (absorbers)/1600 pairs (vessels)/k-Wave simulation of absorbers and vessels/in vitro phantom (microsphere and vessel structure)Reduce limited-view artifacts from the circular US arraySSIM (versus DAS) 0.135 → 0.871
    30 pairs (microsphere)PSNR 9.41 → 30.38
    CNR 22.72 → 43.41
    22 pairs (vessel structures)
    Lan et al.78Y-Netk-Wave simulation of segmented blood vessels from DRIVE data set4700k-Wave simulation/in vitro phantom/in vivo human palmReduce limited-view artifacts from the linear US arraySSIM (versus DAS) 0.203 → 0.911
    PSNR 17.36 → 25.54
    SNR 1.74 → 9.92
    Guan et al.89FD-UNetU-Netk-Wave simulation:/k-Wave simulation of realistic vasculature phantom from micro-CT images of mouse brain1000 simulation/1000 (realistic vasculature)k-Wave simulation:/k-Wave simulation of realistic vasculature phantom (micro-CT images of the mouse brain)Reduce artifacts from sparse data in the circular US arraySSIM (versus DAS) 0.75 → 0.87
    PSNR 32.48 → 44.84
    Farnia et al.90U-NetU-Netk-Wave simulation from the DRIVE data set3200k-Wave simulation from DRIVE data set/in vivo mouse brainReduce artifacts from sparse data in the circular US arraySSIM (versus DAS) 0.81 → 0.97
    PSNR 29.1 → 35.3
    SNR 11.8 → 14.6
    EPI 0.68 → 0.90
    Guo et al.91AS-NetNonk-Wave simulation of human fundus culi vessel/in vivo fish/in vivo mouse3600/1744/1046k-Wave simulation of human fundus culi vessel/in vivo fish/in vivo mouseReduce artifacts from sparse data and speed up reconstruction from the circular US arraySSIM (versus DAS) 0.113 → 0.985
    PSNR 8.64 → 19.52
    Lan et al.92Ki-GANGANk-Wave simulation of retinal vessels from public data set4300k-Wave simulation of retinal vessels from public data setRemove artifacts from sparse data from the circular US arraySSIM (versus DAS) 0.215 → 0.928
    PSNR 15.61 → 25.51
    SNR 1.63 → 11.52
    DiSpirito et al.93FD U-NetU-NetIn vivo mouse brain304In vivo mouse brainImprove the image quality of undersampled PAM imagesSSIM (versus zero fill) 0.510 → 0.961
    PSNR 16.94 → 34.04
    MS-SSIM 0.585 → 0.990
    MAE 0.0701 → 0.0084
    MSE 0.0027 → 0.00044
    Vu et al.95DIPCNNIn vivo blood vesselsIn vivo blood vessels/non-vascular dataImprove the image quality of undersampled PAM imagesSSIM (versus bilinear) 0.851 → 0.928
    PSNR 25.6 → 31.0
    Godefroy et al.96U-Net/Bayesian NNU-NetPairs of PAI and photographs of leaves/Corresponded numerical simulation500PAI and photographs of leaves/numerical simulationReduce limited-view and limited-bandwidth artifacts from the linear US arrayNCC (versus DAS) 0.31 → 0.89
    SSIM 0.29 → 0.87
    Vu et al.98WGAN-GPGANk-Wave simulation: disk phantom and TPM vascular data4000 (disk)/7200 (vascular)k-Wave simulation: disk phantom and TPM vascular data/tube phantom/in vivo mouse skinReduce limited-view and limited-bandwidth artifacts from the linear US arraySSIM (versus U-Net) 0.62 → 0.65
    PSNR 25.7 → 26.5
    Zhang et al.100RADL-netCNNk-Wave simulation161,000 (including augmentation and cropping from 126 vascular images)k-Wave simulation/vascular structure phantom/in vivo mouse brainReduce limited-view and sparsity artifacts from the ring-shaped US arraySSIM (versus DAS) 0.11 → 0.93
    PSNR 17.5 → 23.3
    Davoudi et al.101U-NetU-NetSimulation: planar parabolic absorber and mouse/in vitro circular phantom/in vitro vessel-structure phantom/in vivo mouseNot mentioned/28/33/420Simulation: planar parabolic absorber and mouse/in vitro circular phantom/in vitro vessel-structure phantom/in vivo mouseReduce limited-view and sparsity artifacts from the circular US arraySSIM (versus input) 0.281 → 0.845
    Davoudi et al.102U-NetU-NetIn vivo human finger from seven healthy volunteers4109 (including validation)In vivo human fingerReduce the limited-view and sparsity artifacts from the US circular arraySSIM (versus U-Net) 0.845 → 0.944
    PSNR 14.3 → 19.0
    MSE 0.04 → 0.014
    NRMSE 0.818 → 0.355
    Awasthi et al.103Hybrid end-to-end U-NetU-Netk-Wave simulation from breast sinogram images1000k-Wave simulation of the numerical phantom, blood vessel, and breast/ horsehair phantoms/ in vivo rat brainSuper-resolution, denoising, and bandwidth enhancement of the PA signal from the circular US arrayPC (versus DAS) 0.307 → 0.730
    SSIM 0.272 → 0.703
    RMSE 0.107 → 0.0617
    Schwab et al.105DALnetCNNNumerical simulation of 200 projection images from 3D lung blood vessel data3000 (after cropping)Numerical simulation/in vivo human fingerReduce limited-view, sparsity and limited bandwidth artifactsSSIM (versus input) 0.305 → 0.726
    Correlation 0.382 → 0.933
    Choi et al.523D-pUnetU-NetIn vivo rat1089In vivo rat/in vivo mouse/in vivo humanReduce limited-view and sparsity artifactsMS-SSIM (versus input) 0.83 → 0.94
    PSNR 32.0 → 34.8
    RMSE 0.025 → 0.019
    Table 3. Summary of overcoming the limited detection capabilities with DL approaches.
    AuthorNeural network architectureBasic networkTraining data set (if specified, validation is excluded)Test data setSpecified taskRepresentative evaluation results
    SourceData amount
    Hariri et al.53MWCNNU-NetAgarose hydrogel phantom: LED-based PA image and Nd:YAG-based PA image229Agarose hydrogel phantom of LED-based PA image/in vivo mouseDenoise PA images from low-dosage systemSSIM (versus input) 0.63 → 0.93
    PSNR 15.58 → 53.88
    Singh et al.111U-NetU-NetLED-based and Nd:YAG-based tube phantom150LED-based phantom using ICG and MBReduce the frame averagingSNR 14 → 20
    Anas et al.112CNNIn vitro phantom4536In vivo fingersImprove the quality of PA imagesSSIM (versus average) 0.654 → 0.885
    PSNR 28.3 → 36.0
    Anas et al.114CNN and LSTMIn vitro wire phantom/in vitro nanoparticle phantom352,000In vitro phantom/in vivo human fingersImprove the quality of PA imagesSSIM (versus input) 0.86→0.96
    PSNR 32.3 → 37.8
    Rajendran et al.109HD-UnetU-Netk-Wave simulation450In vitro phantom/in vivo ratImprove the frame rateSSIM (versus U-Net) 0.92 → 0.98
    PSNR 28.6 → 32.9
    MAE 0.025 → 0.017
    Zhao et al.110MT-RDNIn vivo mouse brain and ear6696In vivo mouse brain and earImprove the quality from low dosage laser and downsampled dataSSIM (versus input) 0.64 → 0.79
    PSNR 21.9 → 25.6
    Table 4. Summary of studies on compensating for low-dosage light delivery.
    AuthorNeural network architectureBasic networkTraining data set (if specified, validation is excluded)Test data setSpecified taskRepresentative evaluation results
    SourceData amount
    Cai et al.119ResU-netU-NetNumerical simulation2048Numerical simulationExtract information from multispectral PA imagesRelative errors (versus linear unmixing) 36.9% → 0.76%
    Chang. et al.120DR2U-netU-NetMonte Carlo simulation of simulated tissue structure2560Monte Carlo simulation of simulated tissue structureExtract fluence distribution from optical absorption imagesRelative Errors (versus linear unmixing) 48.76% → 1.27%
    Luke et al.121O-Net:U-NetMonte Carlo simulation of epidermis, dermis, and breast tissue1600 pairs (one pair has two-wavelength PA data)Monte Carlo simulation of epidermis, dermis, and breast tissueEstimate the oxygen saturation and segmentRelative errors (versus linear unmixing) 43.7% → 5.15%
    Yang et al.122EDA-netMonte Carlo and k-Wave simulation from female breast phantom4888Monte Carlo and k-Wave simulation based on clinically obtained female breast phantomExtract the information from the multi-wavelength PA imagesRelative errors (versus linear unmixing) 41.32% → 4.78%
    Gröhl et al.123Nine-layer fully connected NNCNNMonte Carlo simulation of in silico vessel phantoms776In vivo porcine brain and human forearmObtain quantitative estimates for blood oxygenationNo statistical results
    Bench et al.124EDSU-Netk-Wave simulation of human lung from lung CT scans/k-Wave simulation of three-layer skin modelk-Wave simulationProduce 3D maps of vascular sO2 and vessel positionsMean difference (versus linear unmixing) 6.6% → 0.3%
    Chen et al.126U-NetU-NetMonte Carlo simulation2880In vitro phantomRecover the optical absorption coefficientRelative error less than 10%
    Gröhl et.al127U-NetU-NetMonte Carlo and k-Wave simulations of in silico tissue3600Monte Carlo and k-Wave simulation of in silicoImprove optical absorption coefficient estimationEstimation error (versus linear unmixing) 58.3% → 3.1%
    Li et al.54Two GANs: SEED-Net and QOAT-NetGANNumerical simulation of phantom, mouse, and human brain/experimental data of phantom, ex vivo, and in vivo mouse3040, 2560, and 2560/2916, 3200, and 3800Ex vivo porcine tissue, mouse liver, and kidney/In vivo mouseImprove optical absorption coefficient estimationRelative errors (versus linear unmixing) 8.00% → 4.82%
    Relative errors 8.00% → 4.82%
    Zou et al.125US-UnetU-NetMonte Carlo and k-Wave simulation/in vitro phantom2000/480In vitro blood tube/in vivo clinical data setImprove optical absorption coefficient estimationAccuracy (versus linear unmixing) 0.71 → 0.89
    Madasamy et al.132Network comparing: U-Net, FD U-Net, Y-Net, FD Y-Net, Deep ResU-Net, and GAN2D numerical simulation of retinal fundus (from Kaggle and RFMID)/3D numerical simulation of breast phantom1858 (before augmentation)/5 3D volumes (12,288 slices after augmentation)2D numerical blood vessel/3D numerical breast phantomFluence correctionPSNR (versus linear unmixing) 37.9 → 45.8
    SSIM 0.80 → 0.96
    Durairaj et al.135Two networks: initialization network and unmixing networkNIRFAST and k-Wave simulationNot mentionedNIRFAST and k-Wave simulationUnmix the spectral informationRegardless of prior spectral information
    Olefir et al.136DL-eMSOT: bi-directional RNN with two LSTMsMonte Carlo simulation10,944In vitro phantom/in vivo mouseReplace inverse problem of eMSOTMean error (versus eMSOT) 4.9% → 1.4%
    Median error 3.5% → 0.9%
    Standard deviation 4.8% → 1.5%
    Table 5. Summary of studies to improve the accuracy of quantitative PAI.
    AuthorNeural network architectureBasic networkTraining data set (if specified, validation is excluded)Test data setSpecified taskRepresentative evaluation results
    SourceData amount
    Guan et al.137Pixel-DLU-Netk-Wave simulation: circles, Shepp-Logan, and vasculature, vasculature phantom from micro-CT images of mouse brain1000 (circles),/1000 (realistic vasculature)k-Wave simulation: circles, Shepp-Logan, and vasculature, vasculature phantom from micro-CT images of mouse brainReconstruct PA images from PA signalPSNR (versus TR) 17.49 → 24.57
    SSIM 0.52 → 079
    Waibel et al.139U-NetU-NetMonte Carlo and k-Wave simulation2304Monte Carlo and k-Wave simulationReconstruct PA images from PA signalIQR (versus DAS) 98% → 10%
    Antholzer et al.140U-NetU-NetNumerical simulation of ring-shaped phantoms1000Numerical simulation of ring-shaped phantomsReconstruct PA images from PA signalMSE (versus general CNN) 0.33 → 0.026
    Lan et al.141DU-NetU-Netk-Wave simulation: disc phantom and segmented fundus oculi/vessels CT4000k-Wave simulation: disc phantom and segmented fundus oculi/ vessels CTReconstruct PA images from PA signalPSNR (versus DAS) 26.843 → 44.47
    SSIM 0.394 → 0.994
    Feng et al.138Res-UNetU-Netk-Wave simulation: disc bread, spider (from “quick draw”), simple wires, logos, natural phantom58,126 (80% of 27,000, 13,000, 10,800, 6000, 240, 15,000)k-Wave simulation: disc, PAT, vessel/in vitro phantomReconstruct PA images from PA signalVessel phantom
    PC (versus MRR) 0.41 → 0.80
    PSNR 6.57 → 13.29
    Tong et al.55FPnet+U-NetU-NetNumerical simulation: brain from MRI, abdomen from MRI, vessel from DRIVE data set/in vivo mouse brain and abdomen15,757: 2211 (brain), 8273 (abdomen), 4000 (vessel)/698 (mouse brain), 575 (mouse abdomen)Numerical simulation: brain, abdomen and liver cancer from MRI, vessel/ in vivo mouse brain and abdomenReconstruct PA images from PA signalMSOT-Abdomen
    PSNR (versus FBP) 16.0532 → 30.3972
    SSIM 0.2647 → 0.9073
    RMSE 0.4771 → 0.0910
    Yang et al.142RIMk-Wave simulation of segmented blood vessels from DRIVE data set2400k-Wave simulation of segmented blood vessels from DRIVEReconstruct PA images from PA signalPSNR (versus DGD) 42.37 → 44.26
    Kim et al.143upgUNETU-NetMonte Carlo simulation128,000 (after augmentation)Monte Carlo simulation/in vitro metal-wire phantom/in vivo human fingerReconstruct PA images from PA signalPSNR (versus DAS) 20.97 → 27.73
    SSIM 0.208 → 0.754
    Hauptmann et al.144Updated DGD (deep gradient descent)DGD (deep gradient descent)k-Wave simulation pf human lung from 50 whole-lung CT scans1024 (from 50 CT scans)k-Wave simulation pf human lung from 50 whole-lung CT scans/in vivo human palmReconstruct PA images from PA signalPSNR (versus U-Net) 40.81 → 41.40
    SSIM 0.933 → 0.945
    Hauptmann et al.145FF-PATU-Netk-Wave simulation of human lung from lung CT scans1024 (from 50 CT scans)k-Wave simulation of human lung/in vivo dataReconstruct PA images from PA signalPSNR (versus BP) 33.5672 → 42.1749
    Table 6. Summary of methods to optimize or replace conventional reconstruction algorithms.
    AuthorNeural network architectureBasic networkTraining data set (if specified, validation is excluded)Test data setSpecified taskRepresentative evaluation results
    SourceData amount
    Reiter et al.147CNNCNNk-Wave simulation19,296k-Wave simulation/in vitro vessel-mimicking target phantomIdentify point source
    Allman et al.148CNN consisting of VGG16/Fast R-CNNCNNk-Wave simulation15,993k-Wave simulation/in vivo dataIdentify and remove reflection artifactsPrecision, recall, and AUC > 0.96
    Allman et al.157CNN consisting of VGG16/fast R-CNNCNNk-Wave simulation15,993In vitro phantomCorrect reflection artifactAccuracy (phantom) 74.36%
    Shan et al.150U-NetU-NetNumerical simulation from 3 cadaver CT64,000Numerical simulation from 1 cadaver CTCorrect reflection artifactsPSNR (versus TR) 9 → 29
    SSIM (versus TR) 0.2 → 0.9
    Jeon et al.56SegU-netU-Netk-Wave simulation of in silico phantom270k-Wave simulation of in silico phantom/in vivo human forearm and footReduce speed-of-sound aberrationsIn silico phantom
    SSIM (versus pre-corrected) + 0.24
    Table 7. Summary of methods for addressing tissue heterogeneity.
    AuthorNeural network architectureBasic networkTraining data set (if specified, validation is excluded)Test data setSpecified taskRepresentative evaluation results
    SourceData amount
    Zhang et al.160AlexNet/GoogLeNetCNNk-Wave simulation from in vivo human breast (normal, cancer)98 (normal)/75 (patient)k-Wave simulation from in vivo human breastClassify and segment imagesBI-RADS rating accuracy: 83% to 96%
    Jnawali et al.163Inception-Resnet-V2Ex vivo human thyroid (normal, benign, cancer)73Ex vivo human thyroidDetect cancer tissueAUCs for cancer, benign, and normal: 0.73, 0.81, and 0.88
    Jnawali et al.1653D CNNCNNThyroid cancer tissue74 (thyroid)/74 (prostate)Thyroid and prostate cancer tissueDetect cancer tissueAUC, 0.72
    Moustakidis et al.166SkinSegIn vivo humanAbout 26,190 (unclear description)In vivo humanIdentify skin morphologyPer-class accuracy: 84.95%
    Nitkunanantharajah et al.169ResNet18In vivo human nailfold (SSc. normal)990 (from 33 subjects)In vivo human nailfoldClassify imagesIntra-class correlation: 0.902. AUC: 0.897
    Sensitivity and specificity: 0.783 and 0.895
    Chlis et al.154S-UnetU-NetIn vivo human vasculature98 pairs (one pair has 28-wavelength PA data)In vivo human vasculatureSegment human vasculatureDice coeff. (versus U-Net): 0.75 → 0.86
    Schellenberg et al.170nnU-NetU-Net/CNNPA/US images of forearm, calf, and neck from 10 volunteers144 PA and US image pairs36 images for validation and 108 images from six volunteersSegment imagesDice coeff. (versus FCNN): 0.66 → 0.85.
    Normalized surface distance: 0.61 → 0.89
    Lafci et al.171U-NetU-NetIn vivo mice brain, kidney, and liver174 images from 12 mice (brain)/97 images from 13 mice (kidney)/108 images from 14 mice (liver)In vivo mice brain, kidney, and liverSegment hybrid PA/US imageDice coeff. 0.95
    Boink et al.172L-PDRetinal blood vessels from DRIVE data set768Retinal blood vessels from DRIVE dataset/in vitro phantomReconstruct and segment imagesPSNR (versus FBP): 34 → 42.5
    Ly et al.57Modified U-NetU-NetIn vivo human palm800In vivo human palmSegment blood vessels profileGlobal accuracy: 0.9938 (SegNet-5), 0.9920 (FCN-8) → 0.9953
    Sensitivity: 0.6406 (SegNet-5), 0.6220 (FCN-8) → 0.8084
    Table 8. Summary of methods for improving the accuracy of image classification and segmentation.
    AuthorNeural network architectureBasic networkTraining data set (if specified; validation is excluded)Test data setSpecified taskRepresentative evaluation results
    SourceAmount
    Chen et al.175CNNCNNSimulation/in vivo rat brainCorrect motion artifact
    Zheng et al.176MAC-NetGANSimulation7680Simulation/in vivo IVUS and IVOCTCorrect motion artifactAIFD (versus pre-corrected) 0.1007 → 0.0075
    Cheng et al.178WGAN-GPGANIn vivo mouse ear528In vivo mouse earTransform AR-PAM images into OR-PAMPSNR (versus blind deconv.) 18.05 → 20.02
    SSIM 0.27 → 0.61
    PC 0.76 → 0.78
    Zhang et al.181AOTDL-GAN/MultiResU-NetGAN/U-NetSimulation/in vitrophantom/in vivo mouse3500Simulation/in vitro phantom/in vivo mouseTransform AR-PAM images into OR-PAMSNR (versus Deconv) 4.853 → 5.70
    CNR 6.93 → 12.50
    Lateral resolution 45  μm15  μm
    Dehner et al.182U-NetU-NetSimulated PA image/Pure electrical noise/Simulated white Gaussian noise3000/2110/—Simulated PA image/Pure electrical noise/phantom/in vivo human breast/simulated white Gaussian noiseRemove noiseSNR of sinograms (versus pre-corrected) +10.9 dB
    He et al.183GANGANLeaf phantom/in vivomouse ear236/149Leaf phantom/in vivo mouse earRemove noiseSNR (versus input) 29.08 → 90.73
    CNR 4.80 → 7.63
    Kim et al.185MS-FD-U-NetGANIn vivo mouse ear830In vivo mouse earAlign bidirectional raster scanningSSIM (versus input) 0.993 → 0.994
    PSNR 50.22 → 50.62
    MSE 1.09 → 0.99
    Gulenko et al.184Modified U-NetU-NetIn vivo rat colorectum/in vivo rabbit transurethral700In vivo rat colorectum/in vivo rabbit transurethralRemove noiseLog(RMSE) (versus Segnet) 2.9 → 2.5
    Log(SSIM) −2.2 → -0.25
    Log(MAE) 2.6 → 2.0
    Kim et al.180U-NetU-NetIn vivo OR-PAM mouse ear/in vivo PACT mouse brain3000/500In vivo OR-PAM mouse ear/in vivo PACT mouse brainAccelerate localization processPSNR (versus input) 38.47 → 40.70
    MS-SSIM 0.89 → 0.97
    Boktor et al.191Pix2Pix GANGANExperiments15,000ExperimentsPerform virtual stainingSSIM between H&E and UV-PAM: 0.91
    Cao et al.192CycleGANGANExperiments17,940 (UV-PAM)/26,565 (H&E)ExperimentsPerform virtual stainingH&E versus UV-PAM
    Cell count: 5549 and 5423.
    Nuclear area (μm2): 24.2 and 22.0.
    Internuclear dist.: 10.14 and 10.18
    Kang et al.58CycleGANGANExperiments400 (thin section)/800 (thick and fresh tissue)ExperimentsPerform virtual stainingH&E versus UV-PAM
    Cell count: 289 and 283.
    Nuclear area (μm2): 70.66 and 72.75
    Table 9. Summary of methods for addressing other specified issues.
    Jinge Yang, Seongwook Choi, Jiwoong Kim, Byullee Park, Chulhong Kim. Recent advances in deep-learning-enhanced photoacoustic imaging[J]. Advanced Photonics Nexus, 2023, 2(5): 054001
    Download Citation