• Spectroscopy and Spectral Analysis
  • Vol. 41, Issue 12, 3747 (2021)
Xue-gang LÜ1、*, Xiu-hua LI1、1; 2; *;, Shi-min ZHANG2、2;, Mu-qing ZHANG1、1;, and Hong-tao JIANG1、1;
Author Affiliations
  • 11. Guangxi Key Laboratory of Sugarcane Biology, Guangxi University, Nanning 530004, China
  • 22. School of Electrical Engineering, Guangxi University, Nanning 530004, China
  • show less
    DOI: 10.3964/j.issn.1000-0593(2021)12-3747-06 Cite this Article
    Xue-gang LÜ, Xiu-hua LI, Shi-min ZHANG, Mu-qing ZHANG, Hong-tao JIANG. A Method for Detecting Sucrose in Living Sugarcane With Visible-NIR Transmittance Spectroscopy[J]. Spectroscopy and Spectral Analysis, 2021, 41(12): 3747 Copy Citation Text show less
    Transmission spectrum acquisition platform of sugarcanes1: Probe; 2: Black sponge pad; 3: Halogen lamp;4: Sample fixing cylinder; 5: Sugarcane sample;6: Optical fiber; 7: Spectrometer; 8: Cable; 9. Laptop
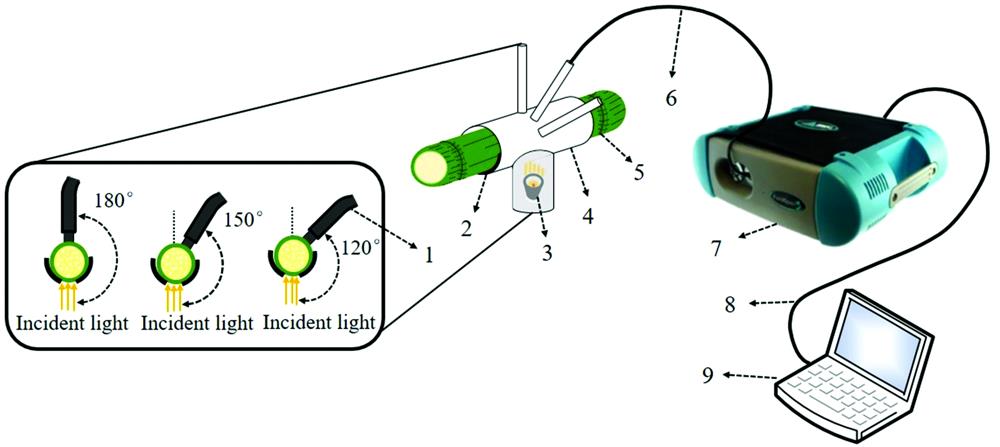
    Fig. 1. Transmission spectrum acquisition platform of sugarcanes
    1: Probe; 2: Black sponge pad; 3: Halogen lamp;4: Sample fixing cylinder; 5: Sugarcane sample;6: Optical fiber; 7: Spectrometer; 8: Cable; 9. Laptop
    The sugarcane samples before and after wax removal and the sketch of transmittance measurement positions
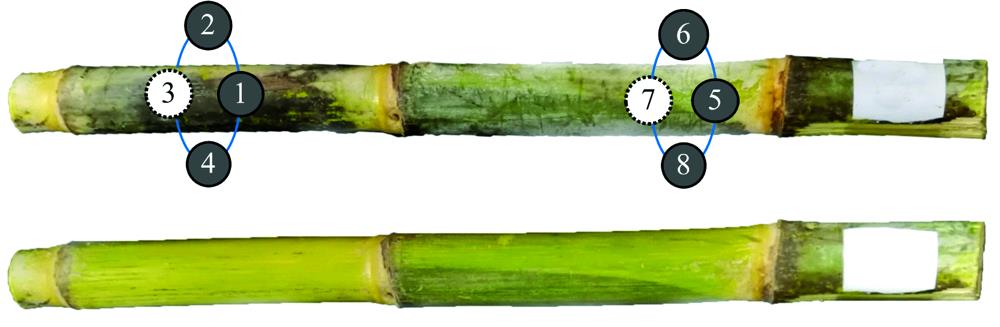
    Fig. 2. The sugarcane samples before and after wax removal and the sketch of transmittance measurement positions
    Spectral difference of sugarcane before and after wax removalCWR: Cane wax removed; OS: Original sample(a): Transmission spectra at different sampling positions of a sugarcane sample; (b): Correlation between transmittance spectra and sucrose
    Fig. 3. Spectral difference of sugarcane before and after wax removal
    CWR: Cane wax removed; OS: Original sample
    (a): Transmission spectra at different sampling positions of a sugarcane sample; (b): Correlation between transmittance spectra and sucrose
    Average spectral transmittance of samples at different angles(a): Original sample; (b): Cane wax removed
    Fig. 4. Average spectral transmittance of samples at different angles
    (a): Original sample; (b): Cane wax removed
    Frequency of each wavelength selected by VCR-ACO algorithm
    Fig. 5. Frequency of each wavelength selected by VCR-ACO algorithm
    Scatter plot of the model established by the wavelength selected by VRC-ACO algorithm(a): Calibration set; (b): Prediction set
    Fig. 6. Scatter plot of the model established by the wavelength selected by VRC-ACO algorithm
    (a): Calibration set; (b): Prediction set
    数据集样本
    数量
    最小值
    /%
    最大值
    /%
    平均值
    /%
    标准差
    校正集826.0713.7110.051.628 1
    预测集417.2313.179.991.472 8
    Table 1. Statistical characteristics of sucrose content in sugarcane samples
    样本
    类别
    预处理校正集预测集
    RcRMSEC/%*RpRMSEP/%*
    原始
    样本
    无处理0.6501.230.7231.016
    SG0.6601.2170.7131.029
    FD0.7681.0360.7041.049
    MSC0.8040.9630.7790.943
    SNV0.8090.9520.7770.949
    SG+MSC0.8040.9620.7730.955
    SG+SNV0.8080.9540.7750.954
    去蜡
    样本
    无处理0.6341.2510.7490.967
    SG0.7031.1510.7600.950
    FD0.7841.0050.7900.899
    MSC0.8110.9470.7830.947
    SNV0.8210.9250.7910.933
    SG+MSC0.8110.9470.7800.957
    SG+SNV0.8170.9340.7870.943
    Table 2. Spectral pretreatment results of sugarcane samples at 120°measurement angle
    样本
    类别
    探测
    角度
    校正集预测集
    RcRMSEC/%*RpRMSEP/%*
    原始
    样本
    120°0.8090.9520.7770.949
    150°0.8100.9490.7521.010
    180°0.7920.9890.7650.967
    去蜡
    样本
    120°0.8210.9250.7910.933
    150°0.8180.9320.7750.981
    180°0.8160.9350.7720.971
    Table 3. PLS modeling results obtained by different spectral measurement methods
    特征提
    取方法
    变量数特征波长/nm
    i-PLS19748, 749, 750, 751, 752, 753, 754, 755, 756, 757, 758, 759, 760, 761, 762, 763, 764, 765, 766
    GA16677, 697, 737, 738, 741, 763, 775, 779, 780, 788, 790, 794, 833, 922, 941, 946
    ACO15676, 703, 735, 747, 763, 768, 769, 771, 778, 786, 798, 792, 819, 821, 822
    VRC-ACO10737, 741, 760, 762, 763, 764, 765, 780, 930, 949
    Table 4. Results of selected wavelengths
    特征提
    取方法
    变量数校正集预测集
    RcRMSEC/%*RpRMSEP/%*
    None2800.8210.9350.7910.933
    i-PLS190.7461.0820.7621.167
    GA160.8440.8690.8430.790
    ACO150.8480.8580.8400.798
    VRC-ACO100.8520.8490.8620.747
    Table 5. Modeling results of selected wavelengths by different algorithms
    Xue-gang LÜ, Xiu-hua LI, Shi-min ZHANG, Mu-qing ZHANG, Hong-tao JIANG. A Method for Detecting Sucrose in Living Sugarcane With Visible-NIR Transmittance Spectroscopy[J]. Spectroscopy and Spectral Analysis, 2021, 41(12): 3747
    Download Citation