Yitian Tong1,†,*, Xudong Guo1, Mingsheng Li1..., Huajun Tang1, Najia Sharmin1, Yue Xu1, Wei-Ning Lee1, Kevin K. Tsia1,2,3 and Kenneth K. Y. Wong1,3,*|Show fewer author(s)
Highly sensitive and broadband ultrasound detection is important for photoacoustic imaging, biomedical ultrasound, and ultrasonic nondestructive testing. The elasto-optical refractive index modulation induced by ultrasound arouses a transient phase shift of a probe beam. Highly sensitive phase detection with a high Q factor resonator is desirable to visualize the ultraweak transient ultrasonic field. However, current phase-sensitive ultrasonic detectors suffer from limited bandwidth, mutual interference between intensity and phase, and significant phase noise, which become key to limiting further improvement of detection performance. We report a phase-sensitive detector with a bandwidth of up to 100 MHz based on dual-comb multiheterodyne interferometry (DCMHI). By sensing the phase shift induced by the ultrasound without any resonators in the medium, the DCMHI boosted the phase sensitivity by coherent accumulation without any magnitude averaging and extra radio frequency amplification. DCMHI offers high sensitivity and broad bandwidth as the noise-equivalent pressure reaches 31 mPa / √Hz under 70 MHz acoustic responses. With a large repetition rate difference of up to 200 MHz of dual comb, DCMHI can achieve broadband acoustic responses up to 100 MHz and a maximum possible imaging acquisition rate of 200 MHz. It is expected that DCMHI can offer a new perspective on the new generation of optical ultrasound detectors.
Highly sensitive ultrasonic detection with a wide bandwidth up to the tens of MHz range underpins techniques such as biomedical photoacoustic tomography and microscopy,1–3 clinical ultrasound imaging,4 and ultrasonic nondestructive testing and evaluation.5,6 Various kinds of piezoelectric-material-based ultrasound transducers represent the current state-of-the-art for ultrasound detection and are widely used.7,8 However, their sensitivity, element size, and bandwidth play a trade-off relation. The limited acoustic numerical aperture limits the ultrasound collection efficiency while increasing the element size deteriorates the bandwidth. In addition, due to the bulky size, the long working distance makes the piezoelectric transducer unable to sense the near-field ultrasound, resulting in loss of sensitivity.
Optical ultrasound detectors, using optical methods to detect ultrasound and optoacoustic signals, offer an attractive and advantageous alternative to piezoelectric detectors.9–32 The ultrasound field is encoded in the intensity or phase change of the optical probe beam via the elasto-optical refractive index modulation, which can be demodulated via optics. For the intensity detection method, the optical reflection schematic demodulates the time-resolved ultrasound field via a single photodiode. Such methods feature a broad detection bandwidth. However, the sensitivity is seriously deteriorated by intensity noise and direct-current noise. In comparison, the phase-sensitive detection method is more popular due to its advantageous potential in sensitivity. Early reported ultrasonic phase-sensitive detectors were developed by detecting the scattered and deflected probe beam affected by ultrasound in a charge-coupled device (CCD) or complementary metal-oxide semiconductor (CMOS).9,10 These applications are severely limited in terms of sensitivity, bandwidth, and imaging rate. Improved ultrasonic phase-sensitive detectors based on optical interferometry have been widely studied in depth. This applies particularly to combining with the devices based on highly sensitive optical resonators, such as Fabry–Pérot interferometers,11–13-phase-shifted fiber Bragg gratings,14–17 and microring resonators.18–21 Some resonant structures have proved to realize both high sensitivity and broadband frequency response with miniaturized acoustic element sizes close to the micrometer-scale optical diffraction limit.22,23 However, these special microstructures are still challenging to further improve the sensitivity, due to the noise of the probe beam.22 Additional complex chirped and stabilized systems are required to match the resonators. Optical interferometry without optical resonators is used to record the photoacoustic pressures, such as line detectors24–26 and optical coherence tomography methods.27–30 These homodyne-like detection systems are sensitive to both the complex amplitude and phase of the probe beam. This makes the systems unable to achieve the highest sensitivity but will have the counter-productive effect of degrading imaging sensitivity and contrast. A noninterferometric scheme with a low-coherence probe beam can preclude any phase-modulation sensitivity to enable the detection of intensity variations.31,32 Unfortunately, the intensity noise of the probe beam will degrade the image signal-to-noise ratio (SNR) and need a long average time to improve the SNR. Therefore, an optimal detection scheme that takes into account the noise of the probe beam is not effectively addressed and discussed in most relevant studies. These factors can also greatly affect the sensitivity of ultrasonic detection as well as the imaging speed.
To address these issues, we report a coherent multiwavelength heterodyne interferometry based on dual-electro-optics frequency combs (EOCs) to sense the transient phase shift induced by the ultrasound. Thanks to the optical coherence of the individual comb tones and the radio-frequency coherence of the beating signals, our method can achieve ultrafast optical transient phase-sensitive ultrasonic detection via multiheterodyne interferometry by a coherent accumulation of a pair of slightly detuned frequency combs. To our knowledge, this is the first time combining ultrasound measurements with optical heterodyne interferometry based on dual comb. We demonstrate theoretically and experimentally that superior probe beam detection and noise optimization can achieve sensitive and broadband ultrasonic measurements without using any optical resonant cavities and extra radio frequency (RF) amplification. In addition to the excellent acoustic properties, two key properties of the dual-comb multiheterodyne interferometry (DCMHI) compared to existing methods are detection flexibility and ultrafast acquisition rate, so that it can provide a flexible acoustic bandwidth and transient phase sensing to satisfy a wide range of applications. The proposed DCMHI can also be applied to resonator-based interferometers or noncontact optoacoustic approaches to further improve their performances.26,33,34 This enables widely applicable ultrasonic sensors with a high sensitivity and broadband, as well as multifunctional transducers in biomedical and industrial ultrasound.
Sign up for Advanced Photonics Nexus TOC. Get the latest issue of Advanced Photonics Nexus delivered right to you!Sign up now
2 Method
2.1 Theoretical Aspect, Optical Coherent Detection of Phase Shift Induced by the Ultrasound in Media
The phase shift, also called optical path difference, will occur when light propagates through a transparent medium. The basic principle of interferometric measurement of phase shift relies on two separated light beams: one propagates through the medium and carries the information (signal beam), whereas another (local oscillator beam) waits to beat with the signal beam for the coherent detection in a balanced photodiode (BPD). The phase shift between the signal and local oscillator (LO) beams will be caused by subtle variations in the refractive index and thickness of the medium. In ultrasound and photoacoustics, the refractive index of the medium can be modulated due to significant pressure changes. According to the elasto-optic relation,35 the modulated refractive index of the medium can be expressed as where is the elasto-optic coefficient, is the acoustic pressure, is the mass density, and is the speed of ultrasound in the medium. Generally, water is always used as an ultrasonic transmission medium in ultrasonic and photoacoustic applications, since it has a broadband ultrasonic response. Thus it can be directly used as a sensing medium for the signal beam in ultrasonic detection. If the signal beam of the interferometer travels in the water with a length affected by the pressure wave, this leads to a transient phase shift modulation : where is the angular frequency of the signal beam and is the wave speed. The complex analytical signal is used to describe the time domain electric field of the optical beam. The output current of the BPD in the interferometer is shown as where is the responsivity of a single photodiode (PD) in the BPD, denotes the modulus of complex signal, is the angular frequency of the LO beam, represents the phase difference between the signal beam and LO beam after the transmission, and is the sum of phase noise including the source phase noise, link phase noise induced by the temperature drift, or mechanical vibration. The phase noise of the laser dominates the phase noise, which dependends on the linewidth. According to Eq. (3), we can get two different detection methods in interferometry.
Homodyne detection: the frequencies of the signal and LO beams are the same (). Thus the phase shift modulation induced by the pressure wave is transferred to the amplitude variation of the BPD output signal. By optimizing the power, the receiver can work in the condition dominated by shot noise, that is, the shot-noise power density grows at the same rate with increasing LO power, whereas the shot-noise power exceeds the thermal noise power by far.36 The SNR of the homodyne detection is given as where represents the elementary charge and denotes the receiver bandwidth (equal to the maximum detectable ultrasonic bandwidth). Thus the phase term of the beat note can be derived from Eq. (3): It is clearly shown that the system is sensitive to both the complex amplitude and phase. In addition, the phase term will exceed the phase-shift modulation lack of phase locking of the dual-arm signals, which further deteriorates the SNR.
Heterodyne detection: the frequencies of the signal and LO beams have a certain difference (). The phase shift modulation induced by the pressure wave will be modulated to the intermediate frequency (IF). In a heterodyne receiver, the IF of several times the data rate (i.e., ) exists between the two optical beams. The average signal amplitude in a heterodyne receiver amounts to And the SNR becomes which is 3 dB less than the SNR of the homodyne receiver given by Eq. (4). The reason for the above results is that optical heterodyning suffers from a 3-dB power penalty compared to optical homodyning. Further, the transient phase of IF can be extracted by in-phase/quadrature () demodulation in the coherent heterodyne interferometry as follows: Details of the demodulation for the coherent detection are given in the Supplementary Material. This means that the optical heterodyne interferometry excludes the intensity modulation effect to just obtain the phase variations.
For an ideal interferometric system, the other phase terms in Eqs. (5) and (8) can be treated as a constant. Thus we can get The obtained transient phase value from the coherent interferometry is quantitatively related to the acoustic pressure.37–39 The above analysis shows that optical coherent detection can achieve shot-noise limited performance to get the potential to detect very weak ultrasonic signals that are currently hard to observe due to the limits of laser intensity noise.
2.2 Theoretical Aspect, DCMHI Measurement of Phase Shift and Sensitivity Improvement
Although the optical homodyne has an improved sensitivity compared to optical heterodyning, the optical homodyne is sensitive to both the complex amplitude and phase that are hard to distinguish. This fails to highlight the 3-dB sensitivity improvement brought by the homodyne detection but also drastically deteriorates the sensitivity, which is fatal for detecting phase shifts caused by weak sound pressure. Here we describe the mathematical formulation for directly estimating the phase shift induced by the acoustic pressure based on DCMHI with a higher sensitivity than optical homodyning. For multiheterodyne detection, we use a dual comb based on two EOCs40–42 with different repetition rates as the signal beam and LO beam, respectively. The advantages of using EOCs are twofold: first, the repetition rates of dual comb are flexible and large, which allows the acquisition of large repetition rate differences. That means achieving large IF bandwidths and ultrafast transient phase sensing after multiheterodyne beating with the corresponding comb pairs. It is suitable for detecting flexible acoustic bandwidths of a wide detected range. Second, thanks to the high coherence of dual comb based on EOCs, the low phase noise of each beating signal can be guaranteed to greatly improve the detected sensitivity for ultraweak signals.
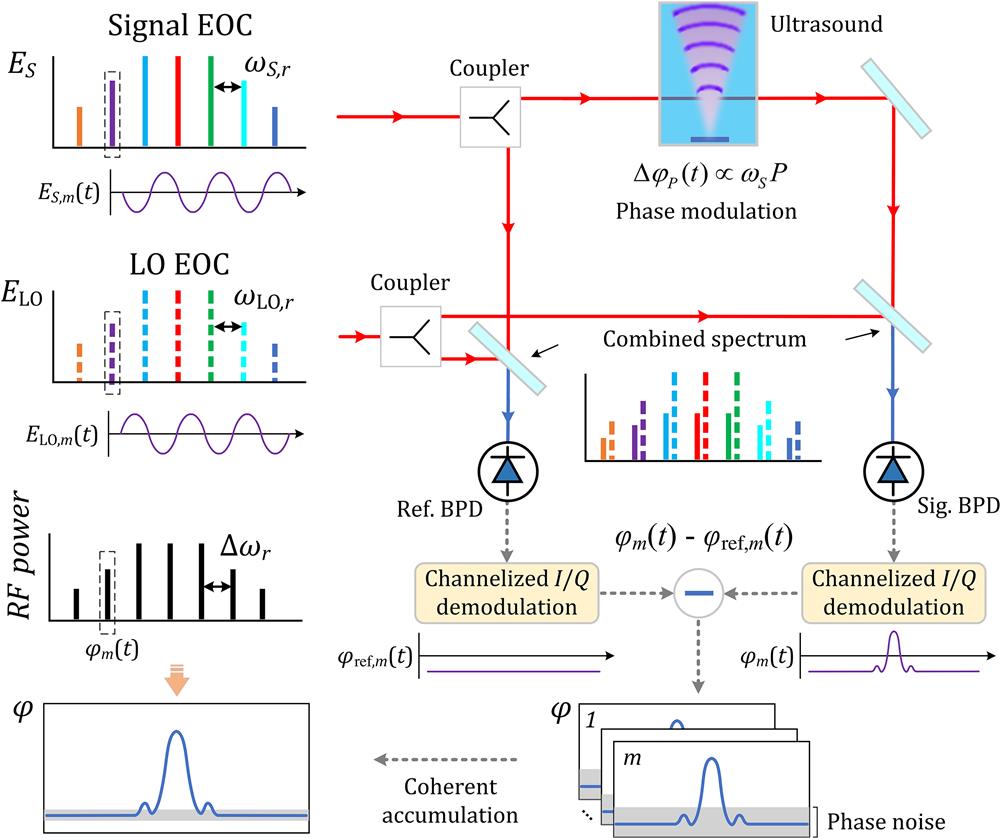
Figure 1 illustrates the concept of DCMHI. The signal EOC and the LO EOC consist of discrete comb tones with frequencies and , respectively. Here is the center angular frequency of the signal EOC, is the comb tone order relative to the center, and is the repetition rate of the signal EOC, whereas and shown in LO EOC are defined in the same manner as the signal EOC. Both combs are separated into two paths by an optical coupler. One part of the signal EOC is sent to the medium and traverses the ultrasound area generated by the sample. The modulated signal beam is collected and combined with a part of the LO comb in an optical beam combiner. The superimposed beams are fed into the signal BPD. The output current of the signal BPD in the DCMHI is changed to Since the two EOCs have different repetition rates, the beat signals of the corresponding comb pairs have different frequencies in the RF domain to achieve spectrum separation. Meanwhile, the maximum demodulated acoustic bandwidth is equal to . The digital channelized demodulation given in the Supplementary Material is used to obtain these transient phases at the same time. The frequency of each down-converter LO is equal to , and the bandwidths of all digital low bandpass filters (3-dB bandwidth equals to ) are equivalent to the desired demodulated sound pressure frequency. After the digital channelized demodulation, expressions for these phases of each beat note in the BPD can be derived as follows:
The interested modulated refractive index of the medium can be extracted from the phase of the various beat notes in the signal BPD. However, these phases also depend on the phase of the source and noise. Therefore, a reference measurement is also required that is obtained by superimposing separate parts of the same DCMHI in a separate reference BPD. The other part of signal EOC does not pass through the medium and is directly combined with the second part of LO EOC, as shown in Fig. 1. The phase values demodulated from the signal BPD are subtracted from the corresponding phase values obtained by the same demodulation in the reference BPD as follows: where is the residual phase noise. These residual phase noises equal to noise accumulation with the same bandwidth in different frequency domains are noncoherent at the same moment. In contrast, the phase shifts demodulated by different comb pairs are coherent and related to the frequency of signal comb tones with a fixed relationship. After normalizing the frequency to the first-order comb tone pair and accumulating the phase values of the multiple tone pairs, the SNR of in the phase domain can be obtained as where is the one-side power spectral density of in the detectable ultrasonic bandwidth and is the number of comb teeth that can be accumulated with . Since the center frequency of the signal EOC is much larger than the repetition frequency, the frequency normalization () can be approximated to 1 at the low-order comb tooth. Thus the coherent accumulation in the phase domain with several comb tones can improve the SNR. That is, the sensitivity improvement can be more obvious than homodyne detection when accumulating more than two comb tones. Meanwhile, the accumulation process also reduces the influence of the residual phase noise of the system on the sensitivity.
We can briefly summarize this section as the following. In addition to ultrasound detection, our technique might also be reminiscent to readers of dual-comb photoacoustic spectroscopy, which combines dual-comb spectroscopy and photoacoustic measurement.43 However, dual comb in Ref. 43 is used as an excitation beam to generate an ultrasonic spectrum. The generated ultrasonic signals are still detected by a traditional transducer. Here we use the dual comb as a probe beam to indirectly detect the ultrasonic signals. Meanwhile, the demodulation method is also different from dual optical comb spectroscopy. By accumulating multiple comb-tooth pairs in DCMHI, the SNR improvement relative to the first-order traditional superheterodyne demodulation phase can be achieved, which can not only compensate for the reduced SNR of homodyne detection but also obtain higher detection sensitivity than homodyne detection. Theoretically, the proposed DCMHI method can further improve the ability to detect ultraweak ultrasound.
2.3 Experimental Setup
The experimental setup of DCMHI for ultrasound detection is depicted in Fig. 2. For EOC generation, we use the cascaded phase modulator and intensity modulator. The EOC is derived from a 1555-nm continuous wave (CW) fiber laser with a linewidth of by electro-optic phase and intensity modulation driven by a dielectric resonant oscillator (DRO) that is locked to a rubidium clock. A more detailed description of the EOC devices can be found in the Supplementary Material. In the DCMHI, two EOCs are used that have slightly different repetition rates of and , respectively. The generated comb spectra are shown in Fig. 2(a). Since the spectrum of the EOC is symmetrical relative to the optical carrier, the multiheterodyne beating signals of dual-EOCs will have spectral aliasing. To avoid the spectrum aliasing and fully utilize the effective spectral range, an acoustic-optic frequency shifter (AOFS) is added before the LO EOC to achieve a 40-MHz up-frequency shift. The power differences in corresponding comb tones of dual-EOCs shown in Fig. 2(a) are caused by the insertion loss of AOFS. The signal EOC and LO EOC are amplified by polarization maintaining (PM) low-noise erbium-doped fiber amplifier to power levels of 16 and 10 mW, respectively. Two optical bandpass filters are used to filter out the amplifier spontaneous emission noise after the dual-EOCs. These details are not shown in Fig. 2.
Figure 2.Experimental demonstration of the DCMHI for detecting the ultrasound. EOC, electro-optics frequency comb; AOFS, acoustic-optics frequency shifter; COL, collimator; BPD, balanced photodiode; and UT, ultrasound transducer. (a) The optical spectrum of the signal EOC (red) and the LO EOC (blue). (b) The ultrasound distribution of the 10 MHz ultrasound transducer measured by hydrophone. (c) The ultrasound signal generated by the ultrasound transducer in the time domain. (d) The beat notes of dual-EOCs measured by the spectrum analyzer. (e) The demodulated phase values of different beat notes by channelized demodulation from the recorded time domain signals.
For ultrasound detection, the signal EOC is split by a PM fiber-based 10:90 coupler, and the low-power part is directly fed to the reference BPD after passing through an optical PM attenuator. The high-power part is coupled to a spatial light path through a collimator (Thorlabs, TC12FC-1550). To detect high-frequency ultrasound signals, the requirement of the signal beam diameter should be constantly small over a length exceeding the ultrasound area. A pair of the chromatic doublet is used to focus the beam with a minimum diameter of in a chamber. The chamber is filled with heavy water (deuterium oxide, ) to ensure minimal loss of light energy at 1555 nm while guaranteeing the same acoustic coupling as water. Two optical windows are affixed to two large holes on either side of the chamber. An ultrasonic transducer is employed to evaluate the system’s acoustic detection performance, and is placed inside the chamber and located directly above the optical path at a flexible distance. It is driven by a pulser receiver (Olympus Panametrics 5800) to generate ultrasonic signals with different powers. The reason for using the transducer is that it produces an acoustic field with a defined distribution and controllable acoustic pressure, which makes it easy to measure the system performance quantitatively. First, the standard immersion transducer with a center frequency of 10 MHz with a bandwidth of 70% (Olympus NDT Panametrics V311) is used for the measurement in the setup. The transducer has a focal point with about 2-cm focal distance where the signal with the maximum amplitude is located. The pressure distribution of the transducer is measured by a calibrated golden lipstick hydrophone with a broadband preamplifier from Onda Corporation (HGL-0200, AH-2010-100). The hydrophone is located vertically directly below the transducer in the chamber, as shown in Fig. 2(b). The generated ultrasound signal in the time domain is recorded by the hydrophone and shown in Fig. 2(c). Thus the focused signal beam passes through the acoustic field at the focal distance and is perpendicular to the direction of the ultrasound propagation by adjusting the position of the transducer. The focal depth of light interacting with the sound in heavy water is about 2 cm. Meanwhile, the sound-absorbing material is placed 1 cm below the focal depth to prevent acoustic reflection signals.
After passing through the chamber and lens, the signal EOC is coupled into the fiber by another collimator and sent to the signal BPD. The function of the optical PM attenuator is to balance the input power of signal EOC in the signal BPD and LO BPDs due to the power loss of the detection optical path. Thanks to the heavy water and precisely aligned spatial light path, the power loss is about 12 dB. Similarly, the LO EOC is split into two portions by a PM fiber-based 50:50 coupler that is routed to the signal BPD and LO BPD, respectively. In order to achieve shot-noise limited detection in the BPD, the LO EOC fed into the BPD is guaranteed the power of around 1 dBm. The resulting RF signals contain discrete beating notes, which are sampled by a 33-GHz real-time sampling oscilloscope. During the receiving and sampling process, there is no RF amplification and magnitude averaging, except for transimpedance amplification of the BPD to provide signal gain. The microwave instruments and devices are all synchronized to the rubidium clock to achieve a stable phase relationship and minimize the phase noise.
Figure 2(d) shows the beating notes measured by a spectrum analyzer in the frequency domain. Due to the frequency shift induced by AOFS, the beat notes of the order comb tones are folded into the real frequency domain and separated from one of the order comb tones. In this case, we can use all the comb teeth for the analysis while a certain demodulation bandwidth is just sacrificed (40 MHz). If the ultrasound signal with a higher bandwidth is required for demodulation, half of the comb teeth of the EOC can be filtered out by an optical bandpass filter. Thus the spacing of the beat notes is equal to the difference of the repetition rate of the signal and LO EOC and amounts to . Therefore, a maximum demodulated bandwidth for ultrasound can be up to 100 MHz, and a maximum possible acquisition rate can be 200 MHz.
Data processing including channelized demodulation is performed offline. The details of the algorithm are seen in the Supplementary Material. The phase shift induced by the ultrasound can be extracted from the phase of each beat note. The phase shift values of some beat notes are shown in Fig. 2(e). Thus the ultrasound signal is mapped to the phase value.
3 Results
3.1 SNR Improvement
The pulser receiver is used to drive the ultrasound transducer to generate stable ultrasound with a fixed pressure. The focal signal EOC beam passes through the point of strongest sound pressure. The phase modulation induced by the ultrasound will be inflicted on each comb tone. After multiheterodyne detection and channelized demodulation, the acoustic phase variation can be extracted from each beat note between the signal EOC and LO EOC. Figure 3(a) shows the demodulated phase change values of the first-order comb tone (, black dot line) without any amplitude averaging. Compared to the ultrasonic signal measured by the hydrophone, we can achieve a good mapping of the ultrasound to the phase domain. After frequency normalization to the first-order comb tone, we coherently accumulate the phase values obtained from the demodulation of multiple beat notes. The phase result shown with a red line in Fig. 3(a) is the phase coherent accumulation of four beat notes corresponding to to 4 order comb tones. It can be seen that the phase noise floor (NF) is reduced by accumulation, whereas the amplitude of the detected ultrasonic signal is kept essentially unchanged. Further, we measured the different SNR values synthesized with several comb tones in the phase domain. Figure 3(b) shows the accumulated phase SNR values with the respective standard deviations indicated as error bars, which are demodulated values collected 10 times.
Figure 3.(a) The comparison diagram of demodulated phase values of the first-order comb tone () and synthesized 4 comb tones ( to 4) in the time domain. (b) The accumulated phase SNR values with the respective standard deviations indicated as error bars, which are demodulated values collected ten times.
The SNR improvement in the phase domain enables near-perfect coherent accumulation ( in dB) under the cumulative number of comb tones . In this range, the improvement of SNR is the most efficient. When more comb teeth ( to 7) are accumulated further, the efficiency of the improved SNR will be decreased, and noncoherent accumulation or video accumulation will be performed (less than in dB).44 Despite the drop in efficiency, SNR can still be improved. The main reason why the accumulation becomes noncoherent is that after a certain point, uncorrelated phase noise between comb teeth dominates the NF. After accumulating more demodulated phase results of comb tones, the SNR cannot be improved anymore and entered the gain compression stage. During the gain compression stage, the NF is nearly equal to the system NF and it cannot be lowered any further. Meanwhile, excessive accumulation of comb tones causes the noncorrelation between signals, which reduces the signal energy equivalent to a reduction in the SNR. That is, more accumulations of comb tones will take up more computing resources but also deteriorate the detection sensitivity. Therefore, it is necessary to flexibly choose the number of accumulated comb tones to account for the trade-off between sensitivity and computing resources. The best accumulation number in our system is from 4 to 7. A maximum SNR improvement of 8.2 dB can be achieved, which is much higher than the homodyne coherent demodulation sensitivity.
3.2 Sensitivity
Sensitivity was evaluated by measuring the noise equivalent pressure (NEP), which was estimated for the DCMHI based on several ultrasound transducers producing different frequencies of ultrasound signals. The NEP is the minimum detectable pressure at the minimum SNR of unity in the low-frequency limit and is defined as22where PS is the system phase/pressure sensitivity in rad per kPa, and NF is the system root-mean-squared (RMS) phase NF in rad.
The pressure output of each transducer under different driving powers was measured by the calibrated golden lipstick hydrophone at the focal point. Meanwhile, the obtained phase values in the DCMHI are also measured at the focal point of each transducer. The pressure values were mapped to the demodulated phase values measured by the DCMHI. Figure 4 shows that the demodulated phase value of synthesized six comb tones has a linear dependence on the transducer pressure in the focus in which frequency is 10 MHz and generated ultrasound pressure is up to 35 kPa. The error bars on measured data are standard deviations after 10 measurements. Thus the slope obtained by linear fitting is the system pressure sensitivity under the current frequency. The phase NF was measured by calculating the RMS phase value from a long segment of the extracted waveform after performing coherent accumulation. Notice that the extracted waveform was taken out before the arrival of the acoustic pulse without any amplitude averaging in the time domain, which ensured accurate capture of the phase NF in the case of each measurement. Thus the NEP was obtained using Eq. (14).
Figure 4.The measured phase values of synthesized six comb tones in the DCMHI as a function of acoustic pressure; the solid line is the linear fit, and dots are measured data. The error bars on measured data are standard deviations after 10 measurements.
We used multiple immersion ultrasound transducers with different frequencies to equivalently describe the broadband response sensitivity of the system including the center frequencies at 1, 10, and 50 MHz (Olympus NDT Panametrics V303, V311, and V3193). The specific setting parameters are shown in Table 1.
Ultrasound transducer
Demodulation parameter
Center frequency (MHz)
Bandwidth ()a(%)
Focal beam width ()b(mm)
Equivalent working distance of acoustic wave (mm)
Demodulation bandwidth () (MHz)
Equivalent acoustic bandwidth (MHz)
1
70
1.52
1.52
3
3
10
70
0.29
0.29
30
30
50
70
0.15
0.15
70
70
Table 1. Setting parameters in the NEP measurement.
In order to ensure the coverage of the tested frequency band, the demodulation bandwidth is larger than the center frequency of the acoustic pressure, which is equal to the equivalent acoustic bandwidth. For the sake of comparison, we normalize the working distance of the acoustic wave in the measurement of system pressure sensitivity. Figure 5 shows the measured NEP under different acoustic frequencies. The NEP with a 70 MHz measurement bandwidth is 311.52 Pa (37 mPa per ), and that with a 3-MHz measurement bandwidth is lower at 144.43 Pa (83 mPa per ). The reason for this result is the distribution of phase noise. At low frequencies (basically within 1 MHz bandwidth), the phase noise includes reference flicker noise, phase-locked loop NF, and high-frequency phase noise of DRO,45 which is relatively large. At relatively high frequencies, the phase noise is a white phase noise with a flat and smaller power spectral density. This results in the deterioration of NEP with frequency distribution at low bandwidths. As expected, the NEP value increases linearly with the demodulation bandwidth, while having a certain initial value caused by phase noise at low frequencies. Of course, we can improve the NEP value by adding a high-pass filter (e.g., stop frequency is at 1 MHz) during demodulation to suppress the phase noise at low frequencies, which is a trade-off in specific applications. After adding the high-pass filter during the channelized demodulation, we can find that the NEP values can be improved to 147 Pa at a 30 MHz measurement bandwidth (29 mPa per ) and 249 Pa at a 70 MHz measurement bandwidth (31 mPa per ) in the case of white phase noise dominance. It is comparable to that reported for ultrasensitive optical microresonators.22 Meanwhile, the proposed DCMHI can provide flexible and broadband acoustic bandwidth demodulation capability by constructing digital filters without any amplitude accumulation and RF amplification.
Figure 5.The measured RMS NEP under different acoustic frequencies. Insets show segments extracted from the different sampled waveforms (original length is ). The vertical axis is the respective normalized amplitude value. The dash shows the trend of NEP increasing with the demodulation bandwidth.
In addition to high sensitivity, the frequency response of the DCMHI is further verified. We evaluate the system frequency response using ultrasonic signals generated by three ultrasound transducers as broad-spectrum input in the NEP measurement. To ensure the power consistency of the input spectrum, the acoustic pressures generated by different ultrasound transducers are normalized to the 1-MHz one with the same driving power from the pulser receiver. The phase values with normalized working distance measured by the DCMHI are the relative responses under different frequency ranges. Figure 6 shows the measured frequency response of the DCMHI. The inset of Fig. 6 demonstrates the relative response of the 1-MHz transducer measured by the DCMHI and the hydrophone, respectively. The frequency response of the DCMHI at low frequencies is similar to that of a hydrophone. That is, other frequencies can be normalized to 1 MHz to measure the wideband response of the system. The response bandwidth of the DCMHI is more than 50 MHz. The results shown in Fig. 6 demonstrate that the DCMHI system has a sufficient broadband and smooth response to capture all relevant frequencies up to 50 MHz in the acoustic pulse.
Figure 6.The measured frequency response of the DCMHI. The inset demonstrates the relative response of the 1 MHz transducer measured by the DCMHI and hydrophone, respectively.
To reconstruct the instantaneous ultrasonic pressure distribution that induces transient phase dynamics, we proceed with a measurement of the ultrasonic pulse generated by the 10-MHz transducer with the DCMHI method. The transducer was mounted on an translation stage, and raster scanning was conducted along the focal plane of the lens, over an area of with a step size of . Demodulation is performed at each scanning point to obtain corresponding transient phase variations. Because the acoustic field generated by the transducer is well-defined, the propagating ultrasonic wavefront can be captured and reconstructed by DCMHI. The phase result of each sampling point for the ultrasound field by DCMHI is similar to Fig. 3(a) with the same number of accumulated comb teeth. The time delay denotes the ultrasound arrival time. The raw data are applied the Hilbert transform to acquire the envelope. We reconstruct the ultrasound field and the result is shown in Fig. 7. In addition, the DMHI can capture the transient refractive index change induced by the propagated ultrasound wave in the medium. We also can get the ultrasound field with positive and negative pressure changes, shown in Fig. 8. It should be noted that the maximum acquisition rate of the data point for imaging is limited by the scanning speed of the stage, and it can be further improved using a galvanometric mirror to achieve high-speed scanning.
We have demonstrated that our DCMHI technique is capable of capturing a transient phase event with high sensitivity and broadband frequency response, which is promising for various ultrafast phase related applications including photoacoustic imaging and quantitative phase imaging.
4 Discussion and Conclusion
Coherent multiheterodyne interferometry based on dual-EOC for detecting the phase modulation induced by the ultrasound is demonstrated in this paper. The concept offers a new perspective in the area of optical ultrasound detectors. It exploits the dual-EOC and coherent accumulation to deliver ultrafast phase sensing and high sensitivity for ultrasonic detection that distinguishes it from existing techniques. The coherent multiheterodyne interferometry can achieve a high SNR with shot-noise limitation, which is of crucial importance to photoacoustic tomography or synthetic aperture ultrasound. Moreover, achieving very low NEP values using only heavy water as the sensing medium shown in Fig. 5 demonstrates the ability of the DCMHI to achieve high sensitivity through probe detection and noise optimization.
We discussed a variety of existing optical ultrasound detection methods and summarized their key characteristics in Table 2. The proposed method offers broadband and flexible acoustic detection bandwidth. In this study, the maximum response bandwidth of 50 MHz was demonstrated by testing different transducers, while the theoretical demodulation bandwidth was up to 100 MHz. The measured bandwidth can accommodate most biological and industrial applications. In addition, the flexible acoustic detection bandwidth can be achieved by digitally constructing the filters of different bandwidths without any hardware replacement. Finally, the DCMHI can achieve an ultrafast acquisition rate. Thanks to the large repetition rate difference of dual-EOC, the maximum possible acquisition rate is up to 200 MHz. Since coherent phase detection does not require additional RF amplification and time domain averaging, which also facilitates high-speed imaging. Higher demodulation bandwidth can be achieved by increasing the repetition rate difference of dual comb. We acknowledge that the implementation of this repetition rate difference requires a higher demodulation bandwidth, which increases the sampling bandwidth and data throughput.
Categoy 1
Category 2
Method
Sensing element size
Detection bandwidth (MHz)
NEP
Complexity
Comments
Sensor part
Detection part
Directly intensity detection
Optical interface
Optical multilayer51
Prism sensing area
25
30 kPa
Medium
Medium
Intensity noise of probe beam
500 Pa
High
High
Bandwidth limitation of lock-in amplifier
Plasmonic metamaterials52
Pump–probe
Remote sensing31
Beam diameter
60
—
High
Low
Intensity noise of probe beam
Integrated photonic circuits
Polymer waveguide53
20
100 Pa
Medium
Low
Large optical loss, high noise of APD
MRR19
140
6.8 Pa
Medium
Low
Requires chirped process and frequency stabilization systems
Bragg grating waveguide23
220/500 nm
230
High
High
40
Medium
High
End-type fiber FPI22
Phase sensitivity detection
Phase to intensity conversion
Laser beam MZI25
17.5
100 Pa·mm
Low
Low
Phase-modulation sensitivity to enable the detection of intensity variations; additional feedback loop
FBG MZI54
—
16
—
Medium
High
Tapped fiber MZI26
14
150 Pa
Medium
Medium
Laser beam FPI55
5
130 Pa·mm
Low
Medium
PVDF56
—
80
31.2 mPa·mm
Medium
Low
Phase detection
DCMHI
100
a
Low
High
High sampling bandwidth and data throughput
Table 2. Summary of the performances of the optical ultrasonic detectors.
The proposed concept provides a high-performance optical ultrasonic detection method. Combined with other existing technologies, it can further enhance performance to extend the capabilities of a wide range of biomedical and industrial photoacoustic and ultrasound imaging and sensing techniques.