
Miao LI, Zai-Ping LIN, Jian-Peng FAN, Wei-Dong SHENG, Jun LI, Wei AN, Xin-Lei LI. Point target detection based on deep spatial-temporal convolution neural network[J]. Journal of Infrared and Millimeter Waves, 2021, 40(1): 122
- Journal of Infrared and Millimeter Waves
- Vol. 40, Issue 1, 122 (2021)
Abstract
Keywords
Introduction
Infrared Search and Track(IRST)systems were developed to automatically search,capture and track small incoming targets from infrared sequences. They have been wildly applied to many important fields,including unmanned aerial vehicle(UAV)defense,territory surveillance,space situation awareness(SSA),precise guidance,and so on[
Many methods have been presented in the past decades,such as mean subtraction filter [
Generally,those assumptions often adopted to support hand-crafted filters include:(1)point target can be modeled as 2D Gauss model[
In this paper,a deep spatial-temporal convolution neural network based on deep learning theory is proposed to detect point targets intelligently. To detect targets from any image size,the fully convolution is adopted. Thus,the proposed network and be trained by small-size images,and tested by large-size images without any modification. In order to meet the requirement of real time,the 3D convolution in the proposed method is factorized into 2D spatial convolution and 1D temporal convolution,fewer parameters are needed and the computing burden is greatly decreased. Additional,the specified loss function is introduced to take the number imbalance and error imbalance into account simultaneously. Simulation results demonstrate that the proposed approach can robustly and effectively suppress background clutters and detect weak point targets in infrared sequences.
The rest of the paper is organized as follows:Section 1 reviews the related work about point target detection and deep learning based methods. Section 2 shows the deep spatial-temporal convolution neural network. The network architecture,factorized 3D convolution,fully convolution and novel loss function are introduced in detail. The overall performance of the proposed method and comparison results with other methods are presented in Section 3. Finally,conclusions are drawn in Section 4.
1 Related Work
Benefiting from the enhancement of computer,deep learning techniques have been recently used in object detection,visual recognition,and time series classification. Especially,the deep convolutional neural network(CNN)achieved impressive results at 2015 ImageNet contest. After that,many deep learning based methods are proposed in the field of target location and identification,such as R-CNN [
Although many deep learning based methods are studied in recent years,the targets involved in the above methods are large targets,called as area targets,such as human face,vehicle,and animal. The features of area targets are distinctly different from point targets in IRST. In fact,the area target may extend to hundreds of pixels with abundant texture information,geometry information,and color information,which can provide plenty of details for processing. However,the point target is extremely not obvious in shape,size and color characteristics,because they are generated from point source at long distance,and only gray information is obtained by infrared sensor. As a result,the existing detection methods based on deep learning for area targets are not suitable for point target detection in IRST.
Some methods inspired by deep neural networks to detect point targets have been proposed recently. In brief,these methods can be divided into three categories.
(1)Some methods simply convert the detection problem into pattern recognition problem. Ming LIU used traditional 2D CNN networks to judge whether there are infrared small targets in infrared patches [
(2)Many researchers try to combine traditional pre-detection and deep learning based recognition. At May 2018,DDP-CNN was proposed based on data-driven proposal and deep learning-based classification by Ryu [
(3)2D CNN networks based on spatial features are used to detect small targets by some researchers. Lin’s method is designed to detect infrared targets in oversampling images [
This work will focus on detecting point targets with high performance and less runtime by deep spatial-temporal convolution network.
2 Proposed method
2.1 Network architecture
For some reasons,exiting CNN networks cannot be directly used to detect point targets. Firstly,the traditional CNN networks are used to detect large area targets,and accurate spatial coordinates are thrown away due to pooling layers and fully connected layers. However,the targets in IRST are point targets,which must be located precisely by the pixel or sub-pixel. Secondly,for point target detection,each pixel may present a small target,and infrared image should be processed pixel by pixel. Thus,batch detection method is wanted. Thirdly,the input of traditional networks usually is fixed-size because of fully connected layers,which limits the flexibility in practical application. Thus,the special network must be designed based on the characters of point target.
Fortunately,we have found some characters of point target,and they can make it possible to overcome the above shortcomings. For example,the main features of point target can be obtained by statistical analysis based on its small neighboring region. Thus,smaller receptive filed(RF)of network is enough for point targets in comparison with area targets. As a result,one hand,fewer stacked layers in network are needed,which can reduce the complexity and computation. On the other hand,pooling layers and fully connected layers,used to enlarge receptive filed by image compression and feature integration,can be given up.
For the above reasons,the proposed network is hierarchically constructed by stacking different convolutional layers. The network architecture is shown in
![]()
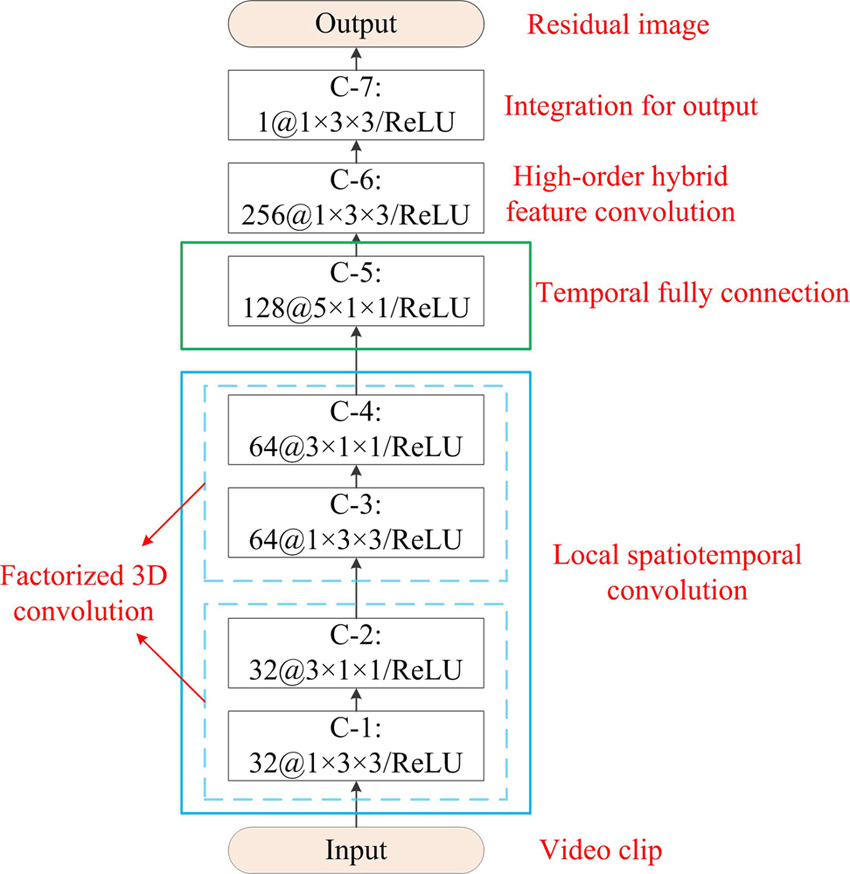
Figure 1.The proposed network architecture.
The proposed point target detection network takes video clip as input,and produces a residual image with the same size of the input. The residual image represents the estimated point target intensity after background suppression. The final target index can be obtained by threshold segmentation easily.
In
This method consists of three parts. Firstly,the bottom of this network(C-1 to C-4)is a stack of 3D convolutional layers,which are focus on low-order spatiotemporal features. To improve their efficiency,the factorized 3D convolution is adopted,as introduced in Section 2.2. In second part,the 3D spatiotemporal feature maps generated from video clip are compressed into one 2D hybrid feature map. This operation is carried out by the convolution over the whole video clip in time dimension. In third part,the high-order hybrid features are intensively learned by more convolution kernels. Finally,feature fusion across different channels is achieved by
The process is modeled with a fully convolutional network. Convolutional layer is architecture with shared parameters,so all pixels can be processed by the same operation. The feature maps,input and output of each convolutional layer,can be modeled as feature results with size
where
2.2 Factorized 3D convolution
Point target can be detected by 2D convolutional neural networks under smooth background. However,these methods do not provide robust detection in complex background,especially when the clutters are strong as shown in Section 3.2. The reason is that only spatial information is not enough to discriminate true or false targets. Thus,both spatial and temporal information must be fully utilized.
2D convolution is performed only spatially,and temporal information of the input is lost. 3D convolution is done spatiotemporally,and both spatial information and temporal information of the input are preserved. Thus,3D convolution is well-suited for spatiotemporal feature learning,and it is adopted in the proposed method.
Traditional 3D convolution can be regarded as that 2D spatial convolution and 1D depth projections are performed simultaneously. Thus,the cost of computational complexity is exceptionally high,even higher than the peak of common computers. Although many studies have proven that deep 3D convolutional neural networks can obtain spatiotemporal features even better than human level accuracy,it is beyond the applicable level. To solve the problem of real time and limit memory space in applicable application,the factorized 3D is adopted,which unravels spatial and temporal convolutions apart[
![]()
Figure 2.The sketches of 3D covolution and factorized 3D convolution: (a) 3D covolution; (b) factorized 3D convolution.
As shown in
where
The computation comparison of 3D convolution and factorized 3D convolution is listed as
| Item | Flops(G) | Parameters(K) |
|---|---|---|
| 3D Conv. | 0.06 | 28.67 |
| Factorized 3D Conv. | 0.03 | 9.38 |
Table 1. Computation comparison of different convolutions.
2.3 Fully convolution
Pooling layer and fully connected layer take important role in traditional deep-learning methods for area target detection.
Typical pooling operations include average pooling and max pooling. They can be considered as non-linear down-sampling. For example,the size of feature map is reduced to a quarter of original after
Furthermore,the fully connected layer brings multiple local features from different regions together,but it limits the input size. It means that the size(height and width)of train image must be same as the size of test image.
To overcome those shortages,the proposed network only consists of many convolution layers,called fully convolution method. The 2D convolution layers with
Additionally,it has been demonstrated that small receptive fields of
2.4 Multi-weighted loss function
The multi-weighted
where
The sample imbalance encountered in training of point target detection may bring extreme error. The imbalance between target samples and background samples can overwhelm training and lead to degenerate model,especially when background samples are far more than target samples. In fact,the background samples generally belong to majority class,while the target samples are in the minority. In practical application,the background images can be easy and often obtained,however the true targets are relatively rare. If the sample imbalance cannot be solved,the training is inefficient. For example,the extreme sample imbalance may lead to true target can be completely ignored. In order to alleviate the bias in performance caused by imbalanced sample distribution,the number-balance weight
where
For point target,the detection result can be obtained by threshold segmentation based on the output after background suppression. Although the error sum may be same for different predicted results,the detection results are obviously different as shown in
![]()
Figure 3.The example of different error distributions: (a) the ground truth; (b) 1th predicted result with uniform error; (c) 2th predicted result with concentrated error.
In this work,the intensity-balance weight is represented by
The calculation of
![]()
Figure 4.The function of intensity weighting parameter.
As described in
3 Simulation results
3.1 Experiment scheme and evaluation metrics
In this section,three experiments are performed to evaluate the performance of the proposed method. A large amount of infrared samples are generated based on point target model and real background images shown as
![]()
Figure 5.The example of samples: (a) the target samples; (b) the background samples.
In this paper,the weak target is regarded as point target,because of long-range observation. The point targets are generated by 2D Gaussian function as following [
where
Furthermore,the observation of optical image embedded with dim point target can be obtained as following [
where
For the background samples,the ground truth is a fully zero-value image. If there are target pixels and background pixels at the same time in the training sample,the ground truth only contains the gray values of target pixels,and the others are set to zeros. The preprocessing before entering the network is necessary for all training and testing samples. In this work,the preprocessing is carried out by de-averaging and normalization. It should be noted that the same average is used for all samples,because the sequences are obtained by same sensor. As a result,the absolute intensity of point targets can be better preserves to support distinction. Besides,
In the first experiment,the point targets are detected by the proposed method,Lin’s method[
In the second experiment,the availability of the proposed method with different input size is proved. It demonstrates the advantage inheriting from fully convolution.
In the third experiment,the detection performance of the proposed method is evaluated under different conditions including original signal-to-clutter ratio(SCR)and jitter of sensor.
In order to measure the performance,the following evaluation metrics are introduced.
To measure the ability of removing background,the background suppression factor(BSF)is introduced[
where
The quality of image can also be indicated by SCR. It is defined as
where
The comprehensive detection result is evaluated by Receiver Operating Characteristic(ROC). The ROC curve can describe the detection result by a function with the probability of detection(
where
where
The simulation environment in this work is shown in the
| Item | Parameter |
|---|---|
| CPU | Intel i7,2.8GHz×12 |
| GPU | Nvidia-1080Ti |
| RAM | 64GB |
| System | Ubuntu 18.04 |
| Disk | 2TB |
| Software | Pytorch 1.1 |
| Language | Python 3.6 |
Table 2. The simulation environment.
3.2 Comparison with other methods
In this simulation,10000 training samples are obtained based on 10 real background sequences. Meanwhile,10000 testing samples are obtained from another 10 real background sequences. The point taregets in samples are randomly added based on point target model. Mean SCR of original image is about 6. The jitter of sensor is simulated as random Gaussian distribution with
![]()
Figure 6.The original image and results of different methods for 1th Background.: (a) the original input; (b) the result of our method; (c) the result of Lin’s method; (d) the result of Max-Mean; (e) the result of TopHat; (f) the result of STDA.
![]()
Figure 7.The original image and results of different methods for 2th Background.: (a) the original input; (b) the result of our method; (c) the result of Lin’s method; (d) the result of Max-Mean; (e) the result of TopHat; (f) the result of STDA.
![]()
Figure 8.The original image and results of different methods for Target 1: (a) the original input; (b) the result of our method; (c) the result of Lin’s method; (d) the result of Max-Mean; (e) the result of TopHat; (f) the result of STDA.
![]()
Figure 9.The original image and results of different methods for Target 2: (a) the original input; (b) the result of our method; (c) the result of Lin’s method; (d) the result of Max-Mean; (e) the result of TopHat; (f) the result of STDA.
The original image and standard deviation in the time domain of Target 2 are shown in
![]()
Figure 10.The display of Target 2: (a) the original gray image; (b) the standard deviation in the time domain.
In order to intuitively show the background suppression performance,the comparisons of SCR and BSF for two point targets are listed in
| Proposed | Lin’s | Max-Mean | TopHat | STDA | |
|---|---|---|---|---|---|
| Target 1 | 20.4061 | 16.8253 | 20.9308 | 20.0394 | 19..8378 |
| Target 2 | 19.0953 | 11.9228 | 3.4410 | 3.0623 | 16.5872 |
| Mean | 19.7507 | 14.3741 | 12.1859 | 11.5509 | 18.2125 |
Table 3. Background suppression comparison by SCR in output.
| Proposed | Lin’s | Max-Mean | TopHat | STAD | |
|---|---|---|---|---|---|
| Target 1 | 1.3527 | 1.0293 | 1.2477 | 1.1210 | 1.3375 |
| Target 2 | 7.1815 | 4.3218 | 1.2520 | 1.0431 | 5.5936 |
| Mean | 4.2671 | 2.6755 | 1.2498 | 1.0821 | 3.4656 |
Table 4. Background suppression comparison by BSF.
The ROC curves of different methods are depicted in
![]()
Figure 11.The ROC curves of different methods.
For IRST application,the high real time is required. The comparison of average runtime is listed in
| Proposed | Lin’s | Max-Mean | TopHat | STDA | |
|---|---|---|---|---|---|
Average runtime(s)/sample | 5.84×10⁻⁴ | 3.38×10⁻⁴ | 3.30×10⁻³ | 1.33×10⁻² | 4.51×10⁻³ |
Table 5. Average runtime comparison.
3.3 Evaluation with different input size
In the above experiment,the input size is set to
The image of
![]()
Figure 12.The result of different input size: (a) the input image with 35×35 pixels; (b) the result of image with35×35 pixels; (c) the input image with 45×45 pixels; (b) the result of image with45×45 pixels.
3.4 Comparison under different conditions
In order to illustrate the detection performance of the proposed method under different conditions,the infrared sequences with different jitters and original SCRs are tested.
In
![]()
Figure 13.The ROC curves with different jitters.
The detection performances of the proposed method for point targets with different original SCRs are analyzed,and jitter is fixed to 0.2.
![]()
Figure 14.The ROC curves with different mean original SCRs.
4 Conclusions
In IRST,point detection is still a great challenge for some reasons. Traditional methods can’t robustly and intelligently detect point targets in complex background. In this work,a deep spatial-temporal convolution neural network is proposed to address this problem. The network is built based on fully convolution without pooling layer and fully connected layer,factorized 3D convolution and multi-weighted loss function are adopted to enhance the performance. The proposed method is compared to other four methods,including traditional methods(e.g.,Max-Mean filter TopHat filter and Spatial-Temporal Accumulative Difference method)and deep learning based method(e.g.,Lin’s method). The detection performance is evaluated by different metrics,such as signal-to-clutter ratio,background suppression factor. Meanwhile,ROC curves are drew to confirm the robustness of the proposed approach. Additionally,the comparison under different conditions is carried out for the proposed method,and the affections of original SCR and sensor’s jitter are demonstrated in detail. Consequently,the deep spatial-temporal convolution neural network can effectively detect point targets using less runtime.
References
[1] R Junhwan, K Sungho. Small infrared target detection by data-driven proposal and deep learning-based classification, 10621J-10624J(2018).
[2] X Sui, Q Chen, L Bai. Detection algorithm of targets for infrared search system based on area infrared focal plane array under complicated background. Optik, 123, 235-239(2012).
[3] J Zhao, Z Tang, J Yang et al. Infrared small target detection using sparse representation. Journal of systems engineering and electronics, 22, 897-904(2011).
[4] M Li, Z Lin, Y Long et al. Joint detection and tracking of size-varying infrared targets based on block-wise sparse decomposition. Infrared Physics and Technology, 76, 131-138(2016).
[5] J Gao, Z Lin, W An. Infrared small target detection using a temporal variance and spatial patch contrast filter. IEEE Access, 7, 32217-32226(2019).
[6] W Zhang, M Cong, L Wang. Algorithms for optical weak small targets detection and tracking: Review, 643-647(2003).
[7] C Chen, H Li, Y Wei, T Xia et al. A local contrast method for small infrared target detection. IEEE transactions on geoscience and remote sensing, 52, 574-581(2014).
[8] R Warren. Detection of distant airborne targets in cluttered backgrounds in infrared image sequences(2002).
[9] J Barnett. Statistical analysis of median subtraction filtering with application to point target detection in infrared backgrounds, 10-18(1989).
[10] V Tom, T Peli, M Leung, J Bondaryk. Morphology-based algorithm for point target detection in infrared backgrounds, 2-11(1993).
[11] S D Deshpande, H E Meng, R Venkateswarlu et al. Max-mean and max-median filters for detection of small targets, 74-83(1999).
[12] Q Yu, S Huang, W Zhao et al. A fusion detection algorithm of small infrared target based on spatial-temporal accumulative difference. Journal of projectiles, rockets, missiles and guidance, 34, 181-189(2014).
[13] W Schmidt. Modified matched filter for cloud clutter suppression. IEEE transactions on pattern analysis and machine intelligence, 12, 594-600(1990).
[14] C Gao, D Meng, Y Yang et al. Infrared patch-image model for small target detection in a single image. IEEE transactions on image processing, 22, 5996-5009(2013).
[15] R Girshick, J Donahue, T Darrell. Region-based convolutional networks for accurate object detection and segmentation. IEEE Transactions on pattern analysis and machine intelligence, 38, 142-158(2016).
[16] R Girshick. Fast R-CNN, 1440-1448(2015).
[17] S Ren, K He, R Girshick et al. Faster RCNN: Towards real-time object detection with region proposal networks, 91-99(2015).
[18] K He, G Gkioxari, P Dollar. Mask R-CNN, 2980-2988(2017).
[19] J Redmon, S Divvala, R Gishick. You only look once: Unified, real-time object detection, 779-788(2016).
[20] R Joseph, A Farhadi. YOLO3: An incremental improvement. ArXiv preprint, 1-6(2018).
[21] M Liu, H Du, Y Zhao et al. Image small target detection based on deep learning with SNR controlled sample generation, 211-220(2017).
[22] L Lin, S Wang, Z Tang. Using deep learning to detect small targets in infrared oversampling images. Journal of Systems Engineering and Electronics, 5, 947-952(2018).
[23] G Ian, B Yoshua, C Aaron. Deep learning(2017).
[24] M Wang, B Liu, F Hassan. Factorized convolutional neural networks, 1-10(2017).
[25] L Sun, K Jia, D Yeung et al. Human action recognition using factorized spatio-temporal convolutional networks, 4597-4605(2015).
[26] K Simonyan, A Zisserman. Very deep convolutional networks for large-scale image recognition. ArXiv preprint, 1409-1556(2014).
[27] J Long, S Evan, D Trevor. Fully convolutional networks for semantic segmentation, 1-10(2015).
[28] S Kim. Double layered-background removal filter for detecting small infrared targets in heterogenous backgrounds. Journal of infrared, millimeter and terahertz waves, 32, 79-101(2011).
[29] C Guo, M Deyu, Y Yi et al. Infrared patch-image model for small target detection in a single image. IEEE transactions on image processing, 22, 4996-5009(2013).
[30] Y He, M Li, J Zhang et al. Small infrared target detection based on low-rank and sparse representation. Infrared physics & technology, 68, 98-109(2015).

Set citation alerts for the article
Please enter your email address
© Copyright 2018-2021 | Chinese Laser Press. All Rights Reserved 沪ICP备15018463号-20