A surface defect evaluation system can combine microscopic scattering dark-field imaging with sub-aperture scanning and stitching. Thousands of sub-apertures are involved; mechanical errors will cause stitching dislocation, leading to defect cracks. In this Letter, we propose standard line coordinate error adjustment dealing with consistency error between coordinates of the scanning and imaging system, and defocus depth estimation leveling method dealing with high-cleanliness fine optics defocuing caused by the surface which is not perpendicular to microscope’s optical axis. Experiments show defect cracks are effectively solved and the defocus of components can be controlled within depth of field 20 μm.
In inertial confinement fusion (ICF) high-power laser projects, such as SG-II system in China[1], NIF in the United States[2], and LMJ in France[3], thousands of large-aperture optics are used for guiding, amplifying, and tightly focusing hundreds of beamlines onto a tiny laser hohlraum target[4]. For purpose of high-power optical performance, fine surface quality of individual large-aperture optical components should be well-ensured. Besides roughness and waviness, surface defects are also one of the important features of surface quality[5]. The presence of surface defects even on the micron scale will result in harmful scattering, local energy absorbing, and harmful diffraction, which is the main reason for reducing the laser-induced damage threshold (LIDT) leading to component breakdown[6,7]. Hence, accurate detection of large-aperture surface defects is crucial for preventing the laser-induced damage and securing high-power optical performance and many researchers had done great efforts on it. Baker[5] proposed comparative microscopy inspection of surface scratches, but it is a visual comparison method which cannot give quantitative results. Behzad et al.[8] classified and quantified the defects in optical fiber connectors, but it is not suitable for large-aperture detection. Alan et al.[9] proposed the total internal reflection (TIR) method for optics damage inspection of large-aperture optics. But in TIR, the surface is detected by capturing only a single image, so the spatial resolution is no better than 110 μm. For filling the gap of large-aperture micron-scale defects via quantitative detection, a surface defect evaluation system (SDES)[10] was proposed. The detection diameter of SDES is up to with a resolution of 0.5 μm and the defect information such as length, width, and position could be quantitatively extracted.
In SDES, high-magnification microscopic imaging and image stitching are necessary to achieve micron-scale resolution in large-aperture optical defect detection. The challenge associated with large-aperture optics is under-detection; hundreds or even thousands of frames of sub-aperture images need to be sampled and stitched. Mechanical errors may be introduced to sub-aperture array and accumulate as the amount of the sub-apertures increases, leading to stitching dislocation to some degree. Even worse, defect cracks may appear and the evaluation results may be ruined considerably. On the other hand, a high-magnification microscopic imaging system usually has very short depth of field (DOF; about tens of micrometers) and defocus may easily occur in sampled images. Blurring the defocus image would directly lower the precision of evaluation result. So the large-aperture test surface should be leveled to ensure the whole aperture of test surface in the scope of DOF. But leveling high-cleanliness fine optics quickly and accurately is still very difficult.
To solve the previously mentioned two problems, standard line coordinate error adjustment (SLCA) and large-aperture defocus depth estimation leveling (DDEL) methods are proposed in this Letter. SLCA maintains the coordinate error below 1 pixel and makes stitching dislocation and defect cracks vanish in stitched full-aperture image. DDEL guarantees the defocus of each sampled sub-aperture of test surface in tens of micrometers, ensuring that sharp images can be sampled at high magnification detection in the full aperture of large-aperture fine optics. And the leveling process could be finished in 10 min.
Sign up for Chinese Optics Letters TOC. Get the latest issue of Chinese Optics Letters delivered right to you!Sign up now
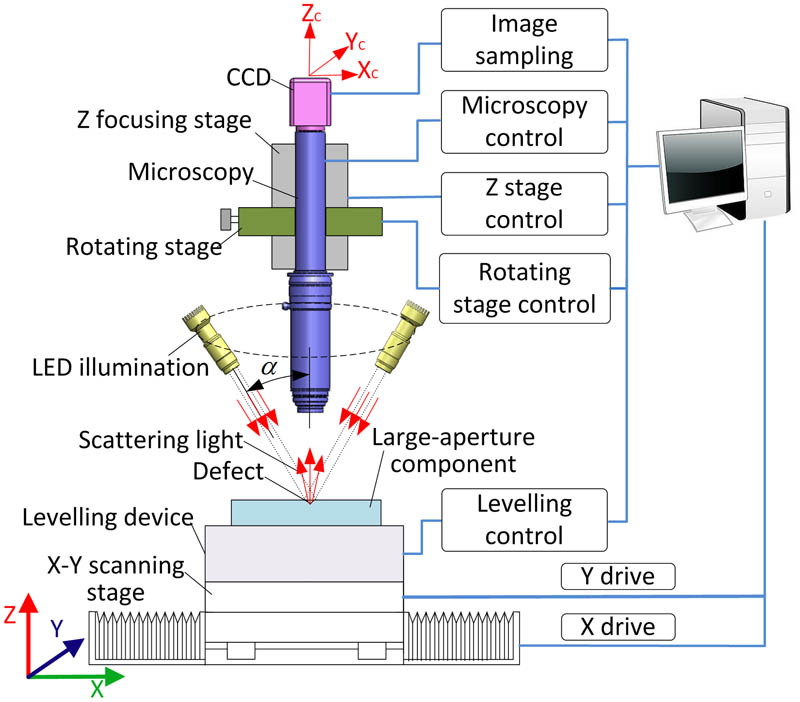
The specific principle of SDES is shown in Fig. 1. It is based on microscopic scattering dark-field imaging. Circular-distribution LED telecentric lights focus on the test surface at a specific angle . If defect exists, the scattering light will be evoked. By capturing the scattering light with CCD placed on the image plane of the microscope, the dark-field image will be gained. The microscope zooms continuously with a fixed working distance which makes different magnification detection possible. Leveling device, –scanning stage, and -focusing stage are also employed, which accomplish large-aperture component leveling, sub-aperture sampling, and focusing. In SDES, all the devices are controlled by a computer, thus automated detection can be realized.
SDES includes two operating models: mapping model and evaluation model. In mapping model, the microscope works at a fairly low magnification ( to ). An –scanning stage holds the component to accomplish the image sampling in a step-by-step way. When it moves a step, an image which is also called a sub-aperture step is sampled. After full-aperture image is stitched by sub-apertures, digital image processing is carried out for obtaining defect lengths and positions. Then evaluation model is conducted. The microscope works at high magnification (). Respective defect is searched and sampled according to obtained defect’s position. After digital image processing again, the information of micron-scale or even submicron-scale defects can be extracted.
From the previously mentioned description of detecting process, we can see that it is important to gain well-stitched full-aperture image and sample sharp images in whole aperture. Whether full-aperture image can be well-stitched not only affects extraction of defect positions and lengths in mapping model, but also decides whether evaluation model can be well-conducted. Moreover, whether sharp images are sampled would affect the precision of extracted lengths and widths. Especially in evaluation model, the microscope works at high magnification with the DOF on the order of tens of microns. In order to sample sharp images, the test surface should be leveled within the DOF. So the error sources that affect stitching should be analyzed and the accurate leveling method should be proposed.
Sub-aperture stitching is widely used, as it extends the field of view (FOV) with high resolution. Sub-aperture stitching with high accuracy and efficiency is the most important issue for defect detection of large-aperture optics. Widely used in sub-aperture stitching, template matching method[11] is very effective when there is characteristic information in the overlapping area of two adjacent images. But dislocation quite possibly happens where the exact matching position cannot be easily located, such as in an overlapping area with completely dark backgrounds. In this case, direct stitching is adopted to stitch images. In order to realize an excellent stitching, it is apparent that we have to investigate the error sources and seek approaches to reducing them. By repeated experiments and analysis in SDES, we find that the coordinate consistency error is the main factor that affects stitching.
Coordinate consistency error, which means the noncoincidence of the coordinate of the digital camera CCD and that of –scanning stage. The coordinate consistency error is of dissymmetric distribution and will accumulate as the amount of the sub-apertures increases. It mainly affects stitching when there is no characteristic information in the overlapping area and the direct stitching method is adopted.
As is shown in Fig. 2(a), the coordinate consistency error between the coordinate of CCD () and that of –scanning stage () is . The images are sampled along the arrow direction. Scratches span (, ), (, ), and (, ), and two digs exist in the overlapped areas of (, ) and (, ). All the actual positions of the scanning sub-apertures have a rotation angle compared to the ideal. Since there is a characteristic of defects in the overlapping areas of the sub-apertures (, ), (, ), (, ), and (, ), template matching method is used to perform stitching. But direct stitching will be adopted in the overlapping area of (, ) because of the absence of defects, thus compared to ideal position (dashed line), a dislocation will be yielded. The dislocation will be passed to , , and . Then the long scratch that spans (, ) splits into and , as shown in Fig. 2(b). The attempt to reduce the error with software might not be feasible, because it is an extreme challenge to measure the angle . Thus in order not to introduce stitching error over the whole aperture, it is necessary to find out the maximal permitting angle between the two coordinates.
Figure 2.Sub-aperture (a) sampling and (b) stitching with coordinate error.
The stitching error introduced by the coordinate consistency error along one scanning row is where is the number of sub-apertures along the scanning row. To make sure that the full-aperture image is stitched correctly, the stitching error must be less than 1 pixel; that is, . And the maximal permitting coordinate consistency error is
In SDES, could be adjusted by the rotating stage which drives the CCD rotating around -axis (shown in Fig. 1). Thus, if is adjusted smaller than , no stitching dislocation will be yielded. To effectively adjust smaller than , SLCA is proposed and the performance is shown in Fig. 3. We introduce a long standard scratch line (standard line) gained by ion-beam lithography and the line longer than 40 mm is preferable. First, standard line is adjusted parallel to the coordinate of the CCD (). Then, two images and are sampled by moving -stage from Point to with distance of and the standard line intersects the -coordinate of and at and . Next, can be calculated where is the width of the FOV.
It should be noticed that the smallest rotating angle of rotating stage, which the resolution of SLCA is limited by, should be smaller than defined by Eq. (2). In our system, the resolution of rotating stage is 3 in., and there is no stitching dislocation in detecting large-aperture surface.
Large-aperture component leveling is to keep the test surface perpendicular to the microscope’s optical axis and sample sharp high-magnification images. In order to apply leveling successfully, the spatial posture of the test surface should be known. Considering the microscopic imaging devices have depth cue, the relative spatial posture of test surface and focus plane of microscope could be described by gaining defocus depths of three points on the test surface and the leveling could be conducted. But, to ensure the speed and accuracy of leveling, first, appropriate focus images should be sampled and then appropriate focus criterion functions should be adopted.
The focus images are a series of axial images sampled along -axis by moving -focusing stage (Fig. 1). The focus images should contain obvious features to apply focus criterion function. Due to high cleanliness of fine optics surface, finding scratches, digs, and stains for focus features are very time-consuming, so the edge of the component is chosen as focus features and the focus images sampled at the edge are called edge images. Figure 4(a) shows an in-focus edge image sampled at the magnification of . Figure 4(a) shows the test surface area (yellow dashed line area) and chamfer area (green dashed line area). The perfect focusing feature is the boundary line of test surface and chamfer. But most axial edge images are defocused, so it is impossible to precisely get it. So, an effective focus zone (red solid line area) is defined as the largest external rectangular of estimated boundary line. As shown in Fig. 4(b), the estimated boundary line could be obtained by edge detection method, which only needs to be applied once for a series of axial edge images. After the effective focus zone is defined, the other images are all cropped by it.
Figure 4.Edge images that are sampled at high magnification; (a) in-focus edge image; (b) estimated boundary line of a defocus edge image.
Then, seven focus criterion functions of square gradient function[12], Brenner’s function[13], Gaussian derivative function[14], thresholded absolute gradient function[13], variance Laplacian function[14], Gray entropy function[14], and gray-level variance function[13] are evaluated for finding the most suitable edge image focusing evaluation function. Twenty axial edge images are sampled by the step length of 50 μm [Fig. 5(a)].Then the focus curves are fitted [Fig. 5(b)]. Based on two features proposed in Refs. [15, 16], the seven functions are evaluated. The features are: (1) unimodality, only a single maximum or minimum should be present; (2) accuracy, difference in steps between the maximum of focus function and the correct focal position.
Figure 5.Cropped edge images the focus curves; (a) cropped edge images that are sampled by the step length of 50 μm; (b) fitted focus curves of edge images.
From Fig. 5(a), we can see that is the sharpest and towards two flanks the images start to blur. From Fig. 5(b), we can get that and are not suitable for edge image focusing, as they do not exhibit unimodality. Although and exhibit unimodality, they are less sensitive than , , and . and are not as accurate as . So, is the most suitable for edge image focusing. Its accuracy is the highest and unimodality is the best.
From the previous description, we can see that the defocus depths can be precisely estimated with focus criterion function. Then, the leveling process could be conducted by building spatial relation model which could be used to convert the defocus depths to the adjustments of leveling mechanism, as is shown in Fig. 6. Assuming the Plane is microscope’s focal plane and the Plane is the test surface, the edge images are sampled at Points , , and , and Points , , and are the projections of Points , , and , so , , and are defocus depths. Then the Plane can be expressed as where (, ), (, ), and (, ) are –coordinates of , , and which can be recorded by –scanning stage.
Figure 6.Spatial relation model of defocus depths and leveling mechanism.
Points , , and are three adjusting points of leveling mechanism which can only be adjusted along -axis, so the –coordinates are constant. Substitute them into Eq. (4), then the -coordinates , , and could be gained. Assume that -coordinates of , , and have changed to , , and after adjustment, where , , and are adjustments of , , and . Plane will be parallel to the focal plane when is true. Just adjust , , and with the distance of , , and to make them focus on Plane ; the leveling process will be finished. But in actual leveling device, in order to reduce the complexity of leveling, three adjusting points are simplified as two adjusting points and one fixed rotating center. If is a rotating center which means then the adjustments of and are
The advantage of DDEL is using component’s edge as focus feature which saves much time with respect to finding features for focus regarding image sampling, especially for fine large-aperture optics with high cleanliness. Moreover, function is applied in defocus depth estimation which ensures high accuracy of leveling.
Based on the analysis mentioned previously, SLCA and DDEL experiments are carried out. The Optem Zoom 160 microscope is employed, due to its large zoom range (from to ) and fixed object working distance. The CCD camera is .
The SLCA experiment is carried out under the magnification of with the FOV of . Collect Sub-aperture [Fig. 7(a)] when the standard line is approximately parallel to the coordinate of the CCD. Then move a spacing and collect Sub-aperture [Figure 7(b)]. We can obtain the coordinates of the intersect points and from and . The coordinate error is given
Figure 7.Sub-apertures (a) and (b) , collected for coordinate consistency error adjusting.
Adjust CCD by angle with the rotating stage and ensure .
Figure 8 shows a sub-aperture array of the calibration sample that is stitched before and after SLCA. Before adjustment, there are five distinct defect cracks caused by Stitching Dislocations A–E. After adjustment, the dislocations are all fixed and no defect crack is yielded in the stitched image.
Figure 8.Sub-aperture array stitching result, , after SLCA; (a) stitching before adjustment; (b) stitching after adjustment.
The leveling experiment is carried out at high magnification of . And the size of test component is . As microscope’s DOF is 20 μm, the sampling step length should be less than half of 20 μm according to Nyquist sampling theorem. So, with the step length of 10 μm, 100 edge images are sampled at Locations , , and (shown in Fig. 6). The absolute position error of -scanning stage is less than 2 μm, so the effect of its stepping error could be eliminated. After function is applied and focus curves are fitted, then according to Eq. (5), and can be obtained and the test surface can be leveled.
Then a large-aperture component is detected under the magnification of . The diameter of the test surface is and 676 sub-apertures are sampled. The sampled sub-apertures are all sharp and from the stitched full-aperture image shown in Fig. 9, we can see that the long starch U and obvious wipe traces of V and W are all well-stitched; no pixel mismatches yield. And in evaluation model where microscope works at high magnification (), the sampled images are all sharp which means the leveling accuracy is within the range of the DOF, 20 μm.
In the project of ICF, large-aperture optics are widely used and the surface defects will lower LIDT. So, accurate detection of large-aperture surface defects is crucial for preventing the laser-induced damage and securing high-power optical performance. SDES is proposed to quantitatively evaluate micron-scale defects on large-aperture optics. In SDES, two problems of stitching dislocation and defocus greatly affect the evaluation result. So, SLCA method is proposed, which effectively reduces the coordinate error and ensures the full-aperture image is stitched excellently. And DDEL method, which maintains the defocus of large-aperture fine optics within 20 μm, is also described in detail. Now, two alignments are successfully applied in ICF to detect defects of large fine optics with the size of and .
[4] J. H. Campbell, R. A. Hawley-Fedder, C. J. Stolz, J. A. Menapace, M. R. Borden, P. K. Whitman, J. Yu, M. Runkel, M. O. Riley, M. D. Feit, R. P. Hackel. Proc. SPIE, 5341, 84(2004).