• Opto-Electronic Advances
  • Vol. 4, Issue 6, 200017-1 (2021)
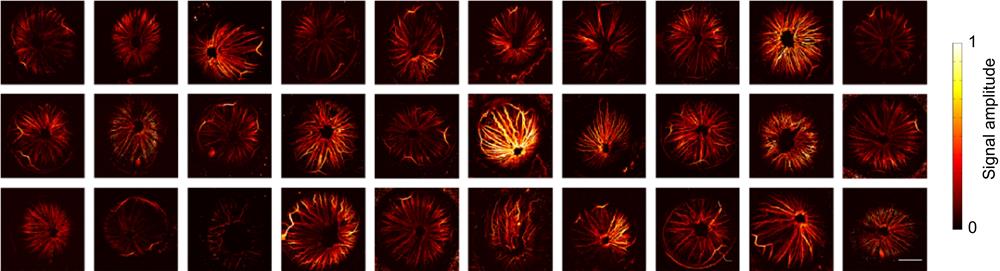
Huangxuan Zhao1、2、3, Ke Li2、3、4, Fan Yang1, Wenhui Zhou1, Ningbo Chen2, Liang Song2, Chuansheng Zheng1、*, Zhicheng Liu3、4, and Chengbo Liu2
Author Affiliations
  • 1Department of Radiology, Union Hospital, Tongji Medical College, Huazhong University of Science and Technology, Wuhan 430022, China
  • 2Research Laboratory for Biomedical Optics and Molecular Imaging, Shenzhen Institutes of Advanced Technology, Chinese Academy of Sciences, Shenzhen 518055, China
  • 3School of Biomedical Engineering, Capital Medical University, Beijing 100069, China
  • 4Beijing Key Laboratory of Fundamental Research on Biomechanics in Clinical Application, Beijing 100069, China
  • show less
    DOI: 10.29026/oea.2021.200017 Cite this Article
    Huangxuan Zhao, Ke Li, Fan Yang, Wenhui Zhou, Ningbo Chen, Liang Song, Chuansheng Zheng, Zhicheng Liu, Chengbo Liu. Customized anterior segment photoacoustic imaging for ophthalmic burn evaluation in vivo[J]. Opto-Electronic Advances, 2021, 4(6): 200017-1 Copy Citation Text show less
    (a) The ophthalmic photoacoustic microscopy developed in this study. DM, dichroic mirror; ConL, condenser lens; FC, fiber coupler; SMF, single-mode fiber; OL, objective lens; UST, ultrasonic transducer; SO, silicone oil; EA, electrical amplifier; DAQ, Adata acquisition; ZCB, Zolix control box; PICC, Physik Instrumente control card; PC, personal computer. (b) The physical map of a mouse during imaging; Scale bar=10 mm.
    Fig. 1. (a) The ophthalmic photoacoustic microscopy developed in this study. DM, dichroic mirror; ConL, condenser lens; FC, fiber coupler; SMF, single-mode fiber; OL, objective lens; UST, ultrasonic transducer; SO, silicone oil; EA, electrical amplifier; DAQ, Adata acquisition; ZCB, Zolix control box; PICC, Physik Instrumente control card; PC, personal computer. (b) The physical map of a mouse during imaging; Scale bar=10 mm.
    Photoacoustic imaging results of iris in 30 mice. Scale bar=1 mm.
    Fig. 1. Photoacoustic imaging results of iris in 30 mice. Scale bar=1 mm.
    (a) The flow chart of vascular morphologic information analysis. (b) The flow chart of vascular functional imaging; Scale bar=0.5 mm.
    Fig. 2. (a) The flow chart of vascular morphologic information analysis. (b) The flow chart of vascular functional imaging; Scale bar=0.5 mm.
    (a−b) The optical microscopic images of a healthy eyeball before and after burn. (c) The HE staining result of the eyeball after photoacoustic imaging. Scale bar=0.2 mm.
    Fig. 3. (a−b) The optical microscopic images of a healthy eyeball before and after burn. (c) The HE staining result of the eyeball after photoacoustic imaging. Scale bar=0.2 mm.
    (a−b) The MAP images of a representative mouse scanned by conventional OR-PAM and the new method developed in this study. (c−d). The depth encoded images of (a−b), respectively. Scale bar=0.5 mm.
    Fig. 4. (a−b) The MAP images of a representative mouse scanned by conventional OR-PAM and the new method developed in this study. (c−d). The depth encoded images of (a−b), respectively. Scale bar=0.5 mm.
    (a−j) The MAP images of all mice before and after burn. (k−o) Quantitative analysis the vascular information of all mice, including vascular diameter (k), density (l) and tortuosity (m−o). Scale bar=0.5 mm.
    Fig. 5. (a−j) The MAP images of all mice before and after burn. (k−o) Quantitative analysis the vascular information of all mice, including vascular diameter (k), density (l) and tortuosity (m−o). Scale bar=0.5 mm.
    The sO2 maps of all mice before and after burn. Scale bar=0.5mm.
    Fig. 6. The sO2 maps of all mice before and after burn. Scale bar=0.5mm.
    Huangxuan Zhao, Ke Li, Fan Yang, Wenhui Zhou, Ningbo Chen, Liang Song, Chuansheng Zheng, Zhicheng Liu, Chengbo Liu. Customized anterior segment photoacoustic imaging for ophthalmic burn evaluation in vivo[J]. Opto-Electronic Advances, 2021, 4(6): 200017-1
    Download Citation