
Huangxuan Zhao, Ke Li, Fan Yang, Wenhui Zhou, Ningbo Chen, Liang Song, Chuansheng Zheng, Zhicheng Liu, Chengbo Liu. Customized anterior segment photoacoustic imaging for ophthalmic burn evaluation in vivo[J]. Opto-Electronic Advances, 2021, 4(6): 200017-1
- Opto-Electronic Advances
- Vol. 4, Issue 6, 200017-1 (2021)
Abstract
Keywords
Introduction
The ophthalmic diseases are widespread throughout the world and pose a serious threat to our society
A new promising biomedical imaging device called optical-resolution photoacoustic microscopy (OR-PAM), which images both anatomical and functional information with high quality
Recently, a new photoacoustic microscopy using contour scanning has been proposed to deal with the challenge of curved surface
In this study, a new ophthalmic photoacoustic microscopy customized for anterior segment imaging has been developed. The microscopy is capable of obtaining high quality image of the anterior segment with a much simpler yet robust contour scanning method compared to the existed one. Only one time scanning is needed during imaging. And a customized vascular quantification algorithm is applied to acquire high quality morphologic and functional images of the vasculature. To evaluate the performance of the new method, the image of a healthy mouse anterior segment was captured and compared with that obtained with traditional OR-PAM. More importantly, to assess the value of the new method in ophthalmic disease applications, in vivo anterior segment burn model, which is a regularly seen ocular trauma, was applied to five mice, and the resulted images are analyzed statistically. The detail of the method and in vivo studies are presented in the following sections.
Materials and methods
Experimental setup
The ophthalmic photoacoustic microscopy in this study is adapted on a custom-built OR-PAM system reported previously
![]()
Figure 1.(
Contour scanning method
We extracted the contour of 30 mouse eyeballs based on their photoacoustic images (as shown in Appendix Fig. A1). The mice are aged from 8−24 weeks and hence they have different size of eyeballs and therefore different contours. Based on a Random Sample Consensus (RANSAC) statistical method
Animal preparation and imaging
All animal handling and experimental procedures were conducted according to a protocol approved by the Animal Study Committee of Shenzhen Institutes of Advanced Technology, Chinese Academy of Sciences. Five mice numbered No.1 to No.5 were selected for photoacoustic imaging. Among them, the right eyeballs of No.1−No.4 mouse were burned (20 mJ/cm2). The mouse of NO.5 was not burned and used as control. The mice were placed under an optical microscope (JSZ6D, Jiangnan, China) to observe the changes in eyeballs before and after burns. Photoacoustic imaging was carried out both before and after eye burning. During the imaging, the used laser energy is below 11 mJ/cm2, which is within the ANSI safety threshold.
During photoacoustic imaging, all mice were remained anesthetized throughout the experiment using 1.5% isoflurane gas (Euthanex, Palmer, Pennsylvania) mixed with oxygen. The right eyelids of the mice were flipped inside out and the eyes were immobilized with the fixing devices and the anterior segments were exposed for imaging. The eyeballs of the mice were placed in an optimal imaging position, i.e., the pupils were faced directly above. However, to verify the robustness of our imaging method, the eyeball of mouse No.4 was placed in a random imaging position by manually rotating the eyeball to make the pupil obliquely faced. To demonstrate the superiority of our method for ophthalmic imaging, one mouse was selected for scanning with both our method and conventional OR-PAM. To confirm that no damage occurred to the eyes during photoacoustic imaging, the mice were euthanized and the imaged eyeballs were removed for histology analysis. The 4% paraformaldehyde was used to fix the eyeball, followed by paraffin-cut sectioning and hematoxylin-eosin (HE) staining to prepare the sample for optical microscopic observation (Axio Lab.A1, ZEISS, Gottingen, Germany).
Vascular morphologic information analysis and functional imaging
The flowchart of vascular morphologic information analysis is shown in Fig. 2(a), and it includes vascular enhancement, extraction, and quantitative analysis of diameter, density, and tortuosity of the vessels. A small region of anterior segment was randomly selected and analyzed before and after burn. The quantitative analysis algorithm was adapted from our earlier publications
![]()
Figure 2.(
Vascular enhancement, logarithmic transformation and vascular extraction were performed on the 3D dataset of the anterior segment region to obtain vascularity parameters including vascular diameter, density and tortuosity. The vascular diameter was calculated by extending the vertical direction of the centerline to both sides of the blood vessel wall. The distance was measured once every 10 pixels along the centerline of the blood vessel to obtain the total diameter. All the measured values were incorporated into a table to draw the diameter distribution histogram. The vascular density is calculated by the ratio of the pixels occupied by the blood vessel to the total number of pixels in the region. For the calculation of vascular tortuosity, three definitions of tortuosity that are widely accepted in the field were used here. Namely, the distance metric (DM), the inflection count metric (ICM), and the sum of angles metric (SOAM). The DM is defined as the ratio between the actual path length of a vessel segment in each subdomain and the linear distance between the two ends of the vessel; the ICM is defined as the ratio between DM and the number of the vessel’s inflection points; and the SOAM is defined as the sum of the curvature at all voxels along the centerline of a vessel normalized by the vessel’s actual path length
After the analysis of vascular morphologic information, functional imaging of anterior segment was performed. The flowchart of vascular functional imaging is shown in Fig. 2(b). More details can be found in ref.
Results and discussion
Figures 3(a) and 3(b) show the images of a mouse eyeball under optical microscope before and after burn, respectively. From Fig. 3(a), it can be seen that healthy eyeball is transparent, and both blood vessels in iris and the pupil are visible. However, after burn, as shown in Fig. 3(b), the anterior chamber becomes turbid, leading to significant decrease in image quality and hyperemia in the iris. Figure 3(c) shows the HE staining result of a slice of the anterior segment (indicated by the blue dotted line in Fig. 3(a)) after photoacoustic imaging. Both the cornea and iris tissues are normally distributed, indicating no lesions or damages were caused during photoacoustic imaging.
![]()
Figure 3.(
The maximum amplitude projection (MAP) images of a representative mouse scanned by conventional OR-PAM and the ophthalmic photoacoustic microscopy developed in this study are shown in Figs. 4(a) and 4(b), respectively. In Fig. 4(a), except that the blood vessels near the DOF of the imaging system show strong photoacoustic signals, the majority of blood vessels in defocused region show weak and fuzzy signals, leading to poor image quality. With the new method, as shown in Fig. 4(b), the entire anterior segment show strong and clear vascular signals and blood vessels of various diameters are visible. Hence the image quality for ophthalmic imaging is significantly improved with our method. To further illustrate the image quality enhancement in the depth direction, the two MAP images in Figs. 4(a) and 4(b) were depth encoded and shown in Figs. 4(c) and 4(d), respectively. The different colors in the images correspond to different depth positions as indicated by the two color bars. From the color bar of Fig. 4(c), it can be seen that the entire vasculature is distributed within a depth range of ~1.2 mm. However, due to the limited depth of focus of conventional OR-PAM, only partial blood vessels were captured in the image. The new method achieves much higher image quality (Fig. 4(d)) because the curvature scanning enables all the blood vessels within or close to the depth of focus of the imaging system during the imaging process. Correspondingly, the color bar has a depth range of 0.4 mm as shown in Fig. 4(d).
![]()
Figure 4.(
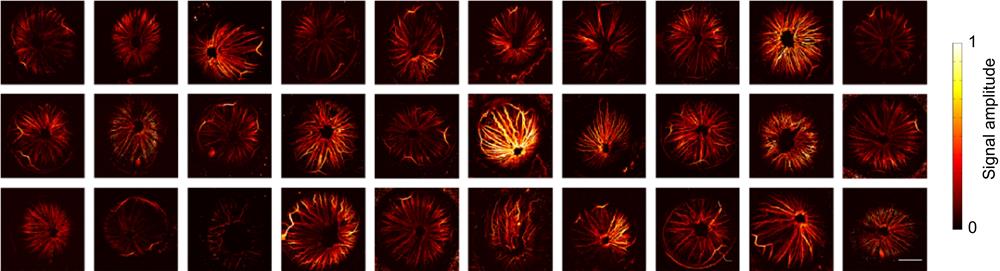
Figure 5 shows the MAP images of all mice in this study (Mouse No.1−No.5) before (first row) and after (second row) burn. Mouse No.5 is the control mouse and no laser burn was applied to it. Hence no significant difference was observed in the control group as shown in Figs. 5(e) and 5(j). Compared to the first row, the blood vessels of the mice (No.1−No.4) after burn are swollen (blood vessels look denser), as shown in the second row. This phenomenon is consistent with previous reports
![]()
Figure 5.(
The sO2 maps of Mouse No.1–No.5 before and after burn are shown in Figs. 6(a)–6(e) and Figs. 6(f)–6(j), respectively. The sO2 values obtained before burns are consistent with the reported literature
![]()
Figure 6.
Conclusions
The newly developed method dedicated for ophthalmic imaging in this study has several benefits compared to existing methods such as noninvasiveness and high image quality. Compared to conventional OR-PAM, the imaging quality of anterior segment was significantly enhanced in this study, and furthermore, the quantitative analysis of lesions based on vascular information extraction was implemented. Both morphological (density, diameter, and tortuosity) and functional (sO2) information of blood vessels were extracted and compared before and after lesion inducement.
For pre-clinical and clinical applications, the real time acquisition of images is critical but has posed challenges for imaging systems. At present, the proposed imaging method is based on traditional mechanical scanning, and cannot achieve real-time imaging. However, fast imaging methods have been proposed to meet these challenges
It was found that the iris blood vessel density and diameter both increased after burn, and the sO2 value was enhanced. These key findings and indicators may play important role in evaluating the occurrence and development of ophthalmic diseases in the future. Besides that, the new ophthalmic photoacoustic microscopy and imaging method proposed in this study would also enable more opportunities in fundamental research and clinical applications. In the near future, our study has room for improvement: 1. Many new methods have been proposed
Appendix
References
[1] YC Tham, X Li, TY Wong, HA Quigley, T Aung, et al. Global prevalence of glaucoma and projections of glaucoma burden through 2040: a systematic review and meta-analysis. Ophthalmology, 121, 2081-2090(2014).
[2] 2015 GBD. Global, regional, and national incidence, prevalence, and years lived with disability for 310 diseases and injuries, 1990–2015: a systematic analysis for the Global Burden of Disease Study 2015. Lancet, 388, 1545-1602(2016).
[3] Y Zhang, SZ Li, L Li, MG He, R Thomas, et al. Dynamic iris changes as a risk factor in primary angle closure disease. Invest Ophthalmol Vis Sci, 57, 218-226(2016).
[4] HF Yang, PK Yu, SJ Cringle, XH Sun, DY Yu. Quantitative study of the microvasculature and its endothelial cells in the porcine iris. Exp Eye Res, 132, 249-258(2015).
[5] Y Zhang, SZ Li, L Li, MG He, R Thomas, et al. Quantitative analysis of iris changes after physiologic and pharmacologic mydriasis in a rural Chinese population. Invest Ophthalmol Vis Sci, 55, 4405-4412(2014).
[6] CS Tan, LW Lim, VS Chow, IW Chay, S Tan, et al. Optical coherence tomography angiography evaluation of the parafoveal vasculature and its relationship with ocular factors. Invest Ophthalmol Vis Sci, 57, OCT224-OCT234(2016).
[7] JG Ghosh, AA Nguyen, CE Bigelow, S Poor, YB Qiu, et al. Long-acting protein drugs for the treatment of ocular diseases. Nat Commun, 8, 14837(2017).
[8] Fluorescence Angiography in Ophthalmology (Springer, Berlin, 2008).
[9] AH Skalet, Y Li, CD Lu, Y Jia, B Lee, et al. Optical coherence tomography angiography characteristics of iris melanocytic tumors. Ophthalmology, 124, 197-204(2017).
[10] SS Ong, TJ Cummings, L Vajzovic, P Mruthyunjaya, CA Toth. Comparison of optical coherence tomography with fundus photographs, fluorescein angiography, and histopathologic analysis in assessing coats disease. JAMA Ophthalmol, 137, 176-183(2019).
[11] Diabetes and Fundus OCT (Elsevier, 2020); https://doi.org/10.1016/B978-0-12-817440-1.00006-1.
[12] M Pellegrini, A Acquistapace, M Oldani, MG Cereda, A Giani, et al. Dark atrophy: an optical coherence tomography angiography study. Ophthalmology, 123, 1879-1886(2016).
[13] MC Savastano, B Lumbroso, M Rispoli. In vivo characterization of retinal vascularization morphology using optical coherence tomography angiography. Retina, 35, 2196-2203(2015).
[14] WJ Choi, ZW Zhi, RK Wang.
[15] C Tian, W Zhang, A Mordovanakis, XD Wang, YM Paulus. Noninvasive chorioretinal imaging in living rabbits using integrated photoacoustic microscopy and optical coherence tomography. Opt Express, 25, 15947-15955(2017).
[16] W Zhang, YX Li, VP Nguyen, ZY Huang, ZP Liu, et al. High-resolution, in vivo multimodal photoacoustic microscopy, optical coherence tomography, and fluorescence microscopy imaging of rabbit retinal neovascularization. Light Sci Appl, 7, 103(2018).
[17] PX Lai, LD Wang, JW Tay, LV Wang. Photoacoustically guided wavefront shaping for enhanced optical focusing in scattering media. Nat Photonics, 9, 126-132(2015).
[18] YY Zhou, F Cao, HH Li, XZ Huang, DS Wei, et al. Photoacoustic imaging of microenvironmental changes in facial cupping therapy. Biom Opt Express, 11, 2394-2401(2020).
[19] YY Zhou, SY Liang, MS Li, CB Liu, PX Lai, et al. Optical-resolution photoacoustic microscopy with ultrafast dual-wavelength excitation. J Biophotonics, 13, e201960229(2020).
[20] YY Zhou, JB Chen, C Liu, CB Liu, PX Lai, et al. Single-shot linear dichroism optical-resolution photoacoustic microscopy. Photoacoustics, 16, 100148(2019).
[21] WZ Liu, KM Schultz, K Zhang, A Sasman, FL Gao, et al.
[22] WZ Liu, HF Zhang. Photoacoustic imaging of the eye: a mini review. Photoacoustics, 4, 112-123(2016).
[23] HX Zhao, K Li, NB Chen, KY Zhang, LD Wang, et al. Multiscale vascular enhancement filter applied to in vivo morphologic and functional photoacoustic imaging of rat ocular vasculature. IEEE Photonics J, 11, 3900912(2019).
[24] LV Wang, S Hu. Photoacoustic tomography: in vivo imaging from organelles to organs. Science, 335, 1458-1462(2012).
[25] S Jeon, HB Song, J Kim, BJ Lee, R Managuli, et al.
[26] S Raveendran, HT Lim, T Maekawa, MV Matham, DS Kumar. Gold nanocages entering into the realm of high-contrast photoacoustic ocular imaging. Nanoscale, 10, 13595-13968(2018).
[27] LV Wang, JJ Yao. A practical guide to photoacoustic tomography in the life sciences. Nat Methods, 13, 627-638(2016).
[28] HX Zhao, GS Wang, RQ Lin, XJ Gong, L Song, et al. Three-dimensional Hessian matrix-based quantitative vascular imaging of rat iris with optical-resolution photoacoustic microscopy in vivo. J Biomed Opt, 23, 046006(2018).
[29] VP Nguyen, YX Li, W Zhang, XD Wang, YM Paulus. High-resolution multimodal photoacoustic microscopy and optical coherence tomography image-guided laser induced branch retinal vein occlusion in living rabbits. Sci Rep, 9, 10560(2019).
[30] HX Zhao, NB Chen, T Li, JH Zhang, RQ Lin, et al. Motion correction in optical resolution photoacoustic microscopy. IEEE Trans Med Imaging, 38, 2139-2150(2019).
[31] HX Zhao, ZW Ke, NB Chen, SJ Wang, K Li, et al. A new deep learning method for image deblurring in optical microscopic systems. J Biophotonics, 13, e201960147(2020).
[32] SW Lee, H Kang, TG Lee. Real-time display and in-vivo optical-resolution photoacoustic microscopy for ophthalmic imaging. Bioimaging, 2, 34-38(2017).
[33] N Wu, SQ Ye, QS Ren, CH Li. High-resolution dual-modality photoacoustic ocular imaging. Opt Lett, 39, 2451-2454(2014).
[34] C Yeh, BT Soetikno, S Hu, KI Maslov, LV Wang. Microvascular quantification based on contour-scanning photoacoustic microscopy. J Biomed Opt, 19, 096011(2014).
[35] C Yeh, B Soetikno, S Hu, KI Maslov, LV Wang. Three‐dimensional arbitrary trajectory scanning photoacoustic microscopy. J Biophotonics, 8, 303-308(2015).
[36] HC Zhou, NB Chen, HX Zhao, TH Yin, JH Zhang, et al. Optical-resolution photoacoustic microscopy for monitoring vascular normalization during anti-angiogenic therapy. Photoacoustics, 15, 100143(2019).
[37] MA Fischler, RC Bolles. Random sample consensus: a paradigm for model fitting with applications to image analysis and automated cartography. Commun ACM, 24, 381-395(1981).
[38] E Bullitt, G Gerig, SM Pizer, W Lin, SR Aylward. Measuring tortuosity of the intracerebral vasculature from MRA images. IEEE Trans Med Imaging, 22, 1163-1171(2003).
[39] AH Parikh, JK Smith, MG Ewend, E Bullitt. Correlation of MR perfusion imaging and vessel tortuosity parameters in assessment of intracranial neoplasms. Technol Cancer Res Treat, 3, 585-590(2004).
[40] SSM Fung, RMK Stewart, SK Dhallu, DA Sim, PA Keane, et al. Anterior segment optical coherence tomographic angiography assessment of acute chemical injury. Am J Ophthalmol, 205, 165-174(2019).
[41] S Hu, B Rao, K Maslov, LV Wang. Label-free photoacoustic ophthalmic angiography. Opt Lett, 35, 1-3(2010).
[42] JJ Yao, LD Wang, JM Yang, KI Maslov, TTW Wong, et al. High-speed label-free functional photoacoustic microscopy of mouse brain in action. Nat Methods, 12, 407-410(2015).
[43] C Zhang, HX Zhao, S Xu, NB Chen, K Li, et al. Multiscale high-speed photoacoustic microscopy based on free-space light transmission and a MEMS scanning mirror. Opt Lett, 45, 4312-4315(2020).
[44] JY Guo, T Wang, BG Quan, H Zhao, CZ Gu, et al. Polarization multiplexing for double images display. Opto-Electron Adv, 2, 180029(2019).
[45] YB Zhang, H Liu, H Cheng, JG Tian, SQ Chen. Multidimensional manipulation of wave fields based on artificial microstructures. Opto-Electron Adv, 3, 200002(2020).

Set citation alerts for the article
Please enter your email address
© Copyright 2018-2021 | Chinese Laser Press. All Rights Reserved 沪ICP备15018463号-20