• Matter and Radiation at Extremes
  • Vol. 5, Issue 6, 064403 (2020)
Dongdong Kang1, Kai Luo2, Keith Runge3, and S. B. Trickey4
Author Affiliations
  • 1Department of Physics, National University of Defense Technology, Changsha, Hunan 410073, People’s Republic of China
  • 2Earth and Planets Laboratory, Carnegie Institution of Washington, 5251 Broad Branch Rd. NW, Washington, DC 20015, USA
  • 3Department of Materials Science and Engineering, University of Arizona, Tucson, Arizona 85721, USA
  • 4Quantum Theory Project, Department of Physics and Department of Chemistry, University of Florida, Gainesville, Florida 32611, USA
  • show less
    DOI: 10.1063/5.0025164 Cite this Article
    Dongdong Kang, Kai Luo, Keith Runge, S. B. Trickey. Two-temperature warm dense hydrogen as a test of quantum protons driven by orbital-free density functional theory electronic forces[J]. Matter and Radiation at Extremes, 2020, 5(6): 064403 Copy Citation Text show less
    The state points of the density and ion temperature used in the present simulations. The parameter α takes values of 0.167, 0.373, and 0.681, corresponding to the three curves from top to bottom, respectively. The densities of these state points are 1 g/cm3, 2.5 g/cm3, and 5 g/cm3, respectively.
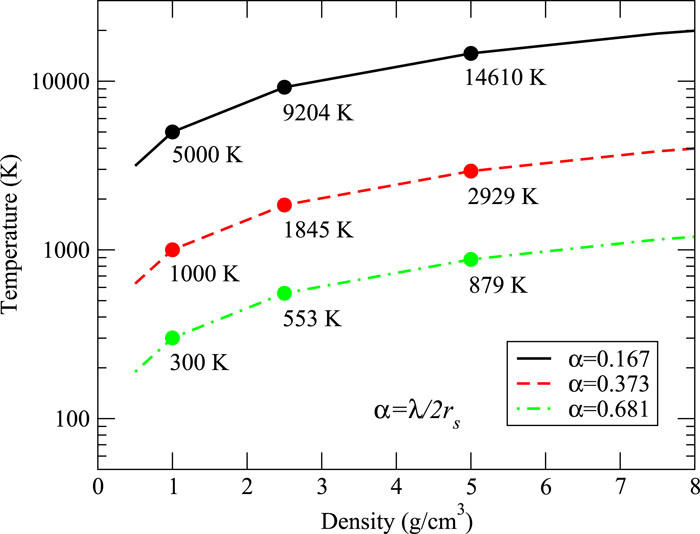
    Fig. 1. The state points of the density and ion temperature used in the present simulations. The parameter α takes values of 0.167, 0.373, and 0.681, corresponding to the three curves from top to bottom, respectively. The densities of these state points are 1 g/cm3, 2.5 g/cm3, and 5 g/cm3, respectively.
    Comparisons of the electronic pressure calculated from OFMD simulations with the different noninteracting free-energy functionals (namely, TTF,52 VT84F,53 and LKTF54,70) vs KSMD simulations, all with the same LPP. Te = 20 kK and ρ = 1 g/cm3.
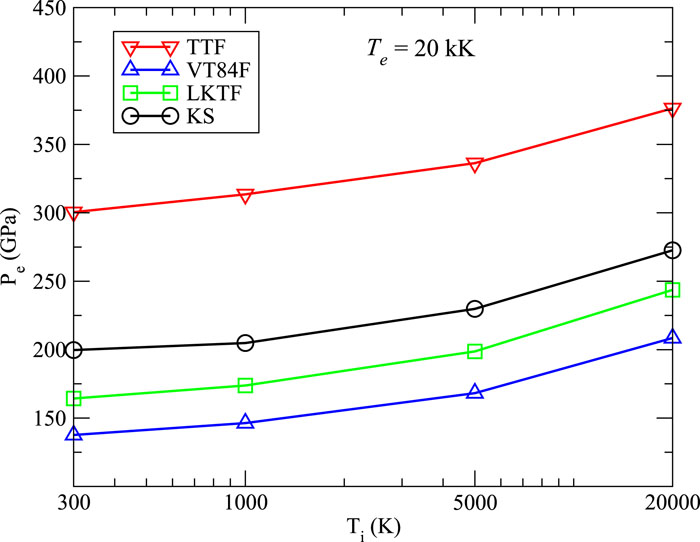
    Fig. 2. Comparisons of the electronic pressure calculated from OFMD simulations with the different noninteracting free-energy functionals (namely, TTF,52 VT84F,53 and LKTF54,70) vs KSMD simulations, all with the same LPP. Te = 20 kK and ρ = 1 g/cm3.
    Comparisons of the radial distribution function from OFMD and PI-OFMD for two-temperature hydrogen at different ion temperatures and densities. The parameter α is 0.167, 0.373, and 0.681 from the top to bottom panels. The electron temperature is 20 kK.
    Fig. 3. Comparisons of the radial distribution function from OFMD and PI-OFMD for two-temperature hydrogen at different ion temperatures and densities. The parameter α is 0.167, 0.373, and 0.681 from the top to bottom panels. The electron temperature is 20 kK.
    Comparisons of RDFs of two-temperature hydrogen obtained from KSMD (LPP and PAW) and OFMD calculations at the state points (5 g/cm3, 879 K) and (1 g/cm3, 300 K), corresponding to dimensionless size α = 0.681, for Te = 20 kK.
    Fig. 4. Comparisons of RDFs of two-temperature hydrogen obtained from KSMD (LPP and PAW) and OFMD calculations at the state points (5 g/cm3, 879 K) and (1 g/cm3, 300 K), corresponding to dimensionless size α = 0.681, for Te = 20 kK.
    Ratio of the first maximum in the RDF for the quantum and classical cases as a function of α.
    Fig. 5. Ratio of the first maximum in the RDF for the quantum and classical cases as a function of α.
    Comparisons of the RDFs of two-temperature hydrogen at two state points (5 g/cm3, 2929 K) and (1 g/cm3, 1000 K), corresponding to dimensionless size α = 0.373, for Te = 20 kK, 50 kK, and 100 kK. Both OFMD and PI-OFMD results are shown.
    Fig. 6. Comparisons of the RDFs of two-temperature hydrogen at two state points (5 g/cm3, 2929 K) and (1 g/cm3, 1000 K), corresponding to dimensionless size α = 0.373, for Te = 20 kK, 50 kK, and 100 kK. Both OFMD and PI-OFMD results are shown.
    As in Fig. 6 for the state points (5 g/cm3, 879 K) and (1 g/cm3, 300 K), α = 0.681.
    Fig. 7. As in Fig. 6 for the state points (5 g/cm3, 879 K) and (1 g/cm3, 300 K), α = 0.681.
    Distribution of the radius of gyration of the two-temperature hydrogen at Te = 20 kK and (from top to bottom) densities 1 g/cm3, 2.5 g/cm3, and 5 g/cm3.
    Fig. 8. Distribution of the radius of gyration of the two-temperature hydrogen at Te = 20 kK and (from top to bottom) densities 1 g/cm3, 2.5 g/cm3, and 5 g/cm3.
    Quantum nuclear corrections to the free energy per hydrogen atom at the state points of ion temperature and density used. Results at Te = 20 kK, 50 kK, and 100 kK are presented for comparison.
    Fig. 9. Quantum nuclear corrections to the free energy per hydrogen atom at the state points of ion temperature and density used. Results at Te = 20 kK, 50 kK, and 100 kK are presented for comparison.
    rsP (KSMD)P (LKTF)P (VT84F)P (TTF)
    1.051558.71453.0(0.068)1401.7(0.101)1636.1(−0.049)
    1.101146.91061.0(0.075)1012.2(0.117)1224.3(−0.067)
    1.25470.9416.8(0.115)377.3(0.199)536.4(−0.139)
    Table 1. Comparison of conventional KSMD and OFMD electronic pressures (GPa) at equilibrium, Te = Ti = 2 kK. The fractional error for OFMD with respect to the KSMD pressure is shown in parentheses. The KSDT XC free-energy functional was used in all cases.
    rsαΔF (mhartree/atom)ΔP (GPa)ΔP/P (%)
    CEIMCa1.050.3504.0(7)7(3)0.4
    1.100.3343.8(3)9(1)0.7
    1.250.2942.8(5)5(1)1.0
    PI-OFMD1.050.3507.0(7)27.7(4)1.9
    1.100.3346.3(7)23.6(3)2.2
    1.250.2944.1(6)11.1(2)2.5
    Table 2. NQE corrections to the total free energy and pressure of hydrogen from CEIMC and PI-OFMD calculations at an ion temperature Ti = 2000 K. In PI-OFMD, Te = 2000 K, while in CEIMC, the NQE corrections are obtained based on the zero-temperature potential-energy surface.81 The total energy includes the ionic kinetic energy and electronic free energy, Ftot = ϵkin + ϵpot, as defined by Eqs. (5) and (6), respectively. Corrections are defined as ΔF = (FtotFtot,classical)/N and ΔP = PPclassical, respectively. The ratio of the pressure corrections to the pressure obtained classically, ΔP/P, is presented. Statistical errors are reported in parentheses as the uncertainty in the last digit.
    Te (kK)αρ (g/cm3)Ti (K)Peclassical (GPa)Pe (GPa)ΔPe/Pe (%)Piclassical (GPa)Pi (GPa)ΔPi/Pi (%)Pclassical (GPa)P (GPa)ΔP/P (%)
    200.1671.05 000198.99199.150.0840.6840.43−0.60239.67239.58−0.04
    200.1672.59 2041815.791819.700.21194.40200.182.972010.202019.880.48
    200.1675.014 6107389.677408.130.25589.51626.586.297979.178034.710.70
    200.3731.01 000174.56178.682.368.3112.1546.21182.86190.834.36
    200.3732.51 8451725.101740.630.9038.7756.4045.471763.871797.031.88
    200.3735.02 9297151.907196.040.62117.03174.9949.537268.927371.031.40
    200.6811.0300164.42172.174.712.469.08269.10166.88181.258.61
    200.6812.55531689.211717.701.6911.4642.49270.771700.671760.193.50
    200.6815.08797060.907135.821.0636.30129.85257.717097.197265.672.37
    500.1671.05 000258.40259.230.3241.5142.522.43299.91301.750.61
    500.1672.59 2041921.091924.740.19184.84188.111.772105.932112.840.33
    500.1675.014 6107557.537572.510.20598.92618.343.248156.458190.840.42
    500.3731.01 000235.36239.651.828.0612.3352.98243.42251.983.52
    500.3732.51 8451836.571851.040.7938.5955.2843.251875.161906.331.66
    500.3735.02 9297322.827362.950.55119.67172.6844.307442.497535.631.25
    500.6811.0300226.57233.683.142.429.26282.64229.00242.946.09
    500.6812.55531801.531829.301.5411.2242.39277.811812.761871.693.25
    500.6815.08797230.737304.811.0236.56130.00255.587267.297434.812.31
    1000.1671.05 000466.02466.470.1041.0841.891.97507.10508.360.25
    1000.1672.59 2042248.032248.480.02189.55187.94−0.852437.582436.41−0.05
    1000.1675.014 6108027.688041.090.17593.45618.834.288621.138659.920.45
    1000.3731.01 000448.47451.610.708.4112.6650.54456.88464.271.62
    1000.3732.51 8452166.422181.170.6837.4655.7648.852203.882236.931.50
    1000.3735.02 9297797.507839.590.54118.42175.3548.077915.928014.941.25
    1000.6811.0300441.51447.021.252.419.76304.98443.92456.782.90
    1000.6812.55532135.692160.991.1811.2042.68281.072146.892203.672.64
    1000.6815.08797708.877781.020.9436.15130.24260.287745.027911.262.15
    Table 3. Electronic, ionic, and total pressures of two-temperature hydrogen for various densities and electronic and ionic temperatures (Te, Ti) from OFMD and PI-OFMD calculations. Pe, Pi, and P are the electronic pressure, ionic pressure, and total pressure from PI-OFMD calculations respectively. Peclassical, Piclassical, and Pclassical are their OFMD counterparts with classical ions. The noninteracting free-energy functional LKTF is used. The dependence on the dimensionless size parameter α is also shown.
    Te (kK)Ti (K)Peclassical (GPa)Pe (GPa)ΔP/P (%)
    Primitive20300136.8(1.0)166.5(3.1)21.7
    201000146.4(1.3)167.0(2.0)14.1
    205000169.5(1.0)184.0(3.2)8.6
    TRPMD20300137.6(0.2)144.6(0.3)5.1
    201000146.3(0.5)150.4(0.7)2.8
    205000168.2(2.0)169.2(2.1)0.6
    Table 4. Comparisons of the electronic pressure Pe obtained from the primitive PIMD algorithm61 and TRPMD68 for hydrogen at ρ = 1 g/cm3. The results of simulations with classical protons are also presented by setting the bead number P=1. Here, the noninteracting free-energy functional VT84F53 and the finite-temperature XC functional KSDT71 are used. The standard deviation is shown in parentheses.
    Dongdong Kang, Kai Luo, Keith Runge, S. B. Trickey. Two-temperature warm dense hydrogen as a test of quantum protons driven by orbital-free density functional theory electronic forces[J]. Matter and Radiation at Extremes, 2020, 5(6): 064403
    Download Citation