
Dipak L Gapale, Pranav P. Bardapurkar, Sandeep A. Arote, Sanjaykumar Dalvi, Prashant Baviskar, Ratan Y Borse. Humidity sensing properties of spray deposited Fe doped TiO2 thin film[J]. Journal of Semiconductors, 2021, 42(12): 122805
- Journal of Semiconductors
- Vol. 42, Issue 12, 122805 (2021)
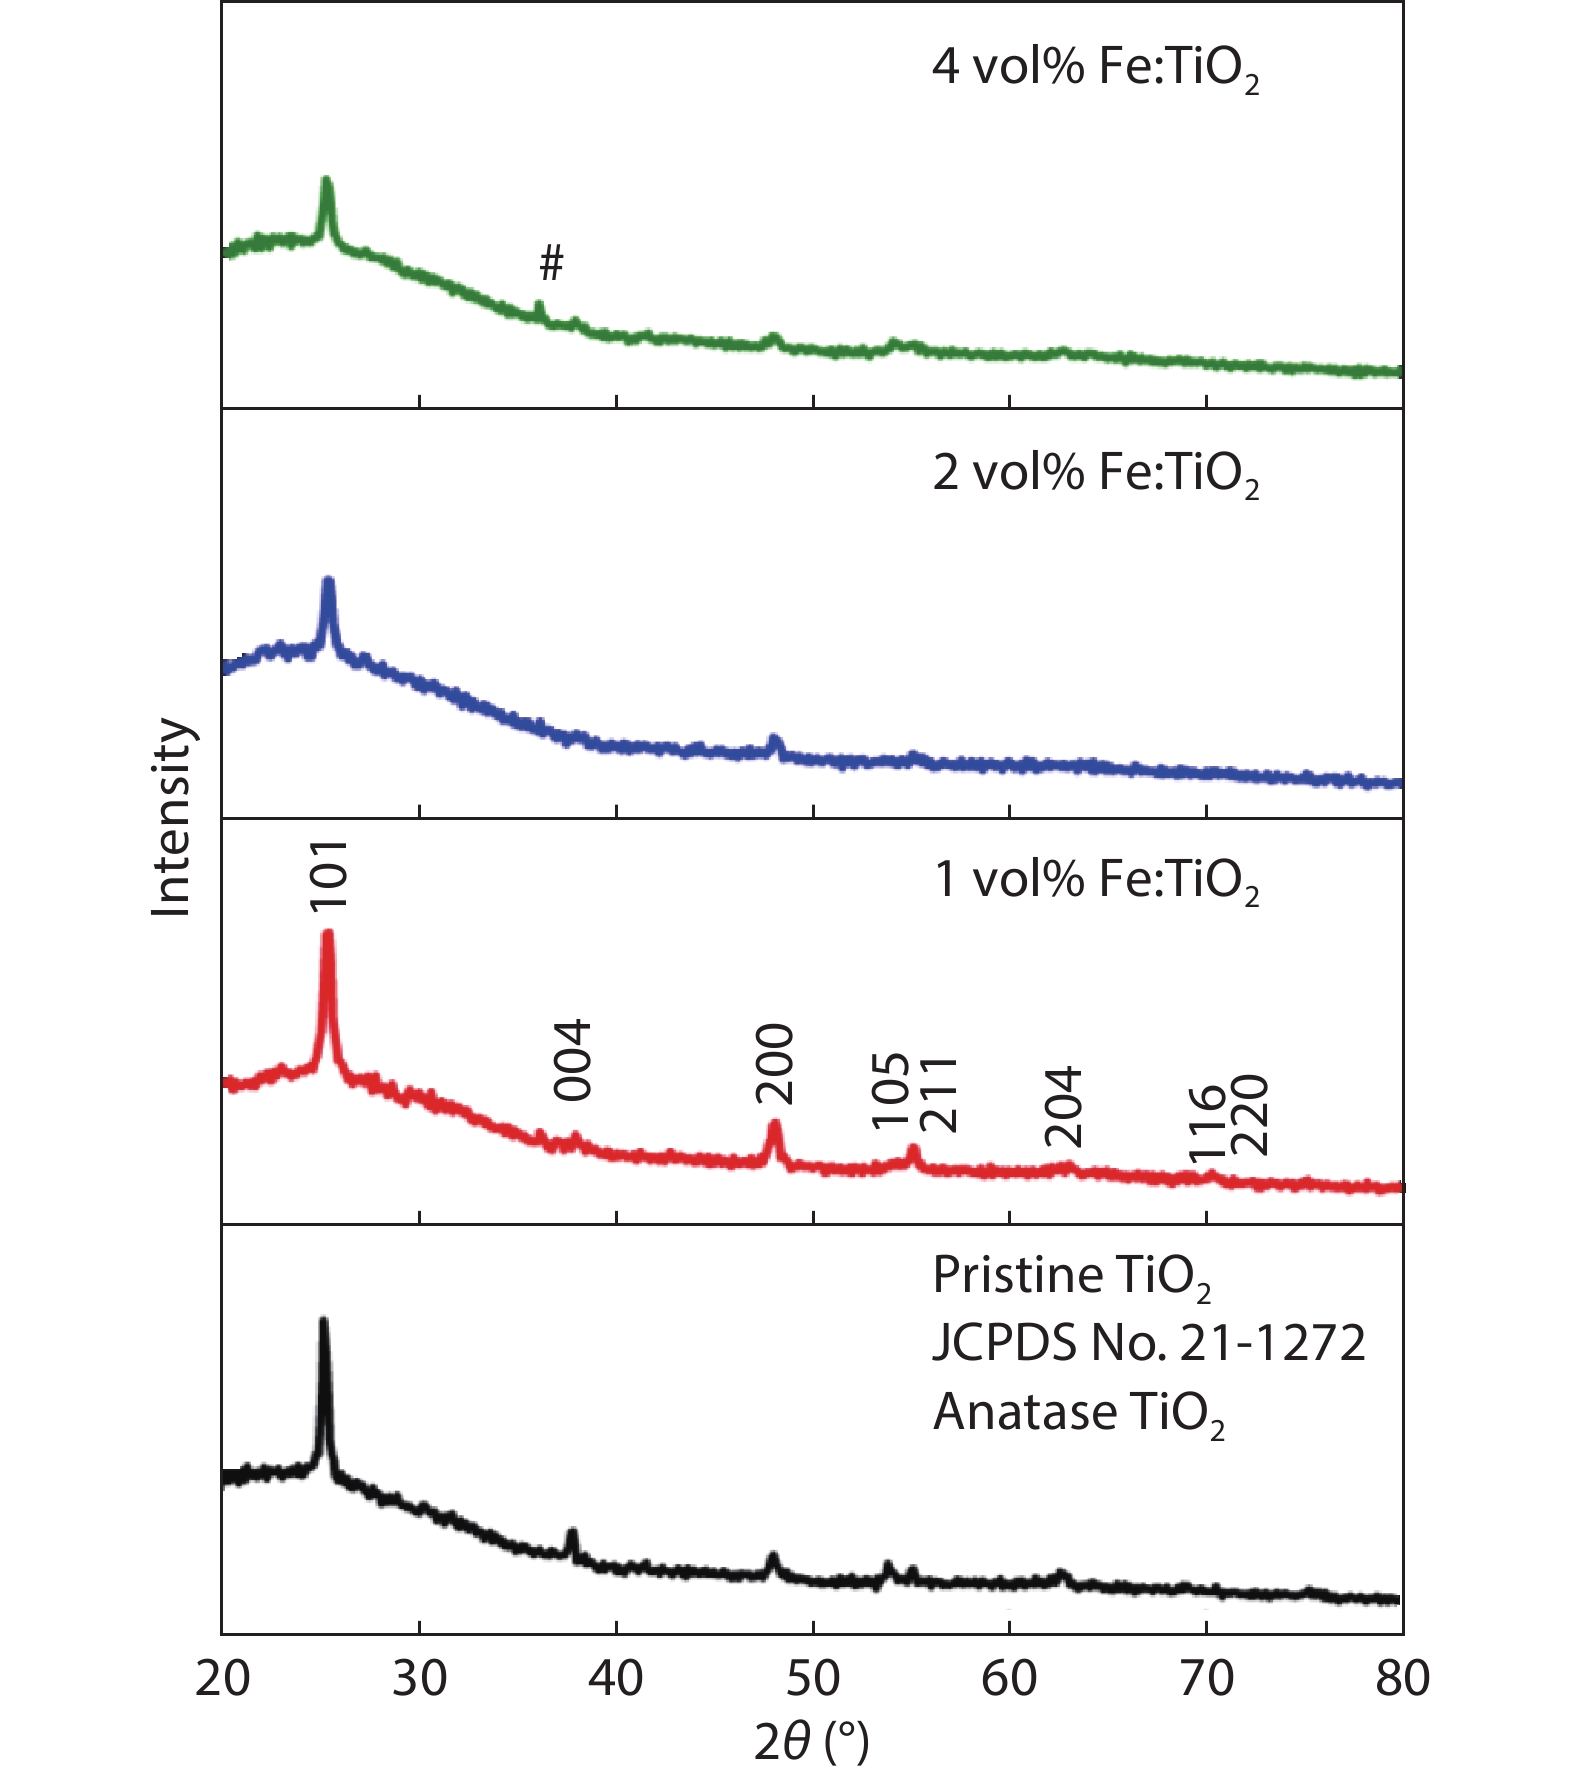
Fig. 1. XRD patterns for pristine and Fe-doped TiO2 thin films annealed at 500 °C (# rutile).
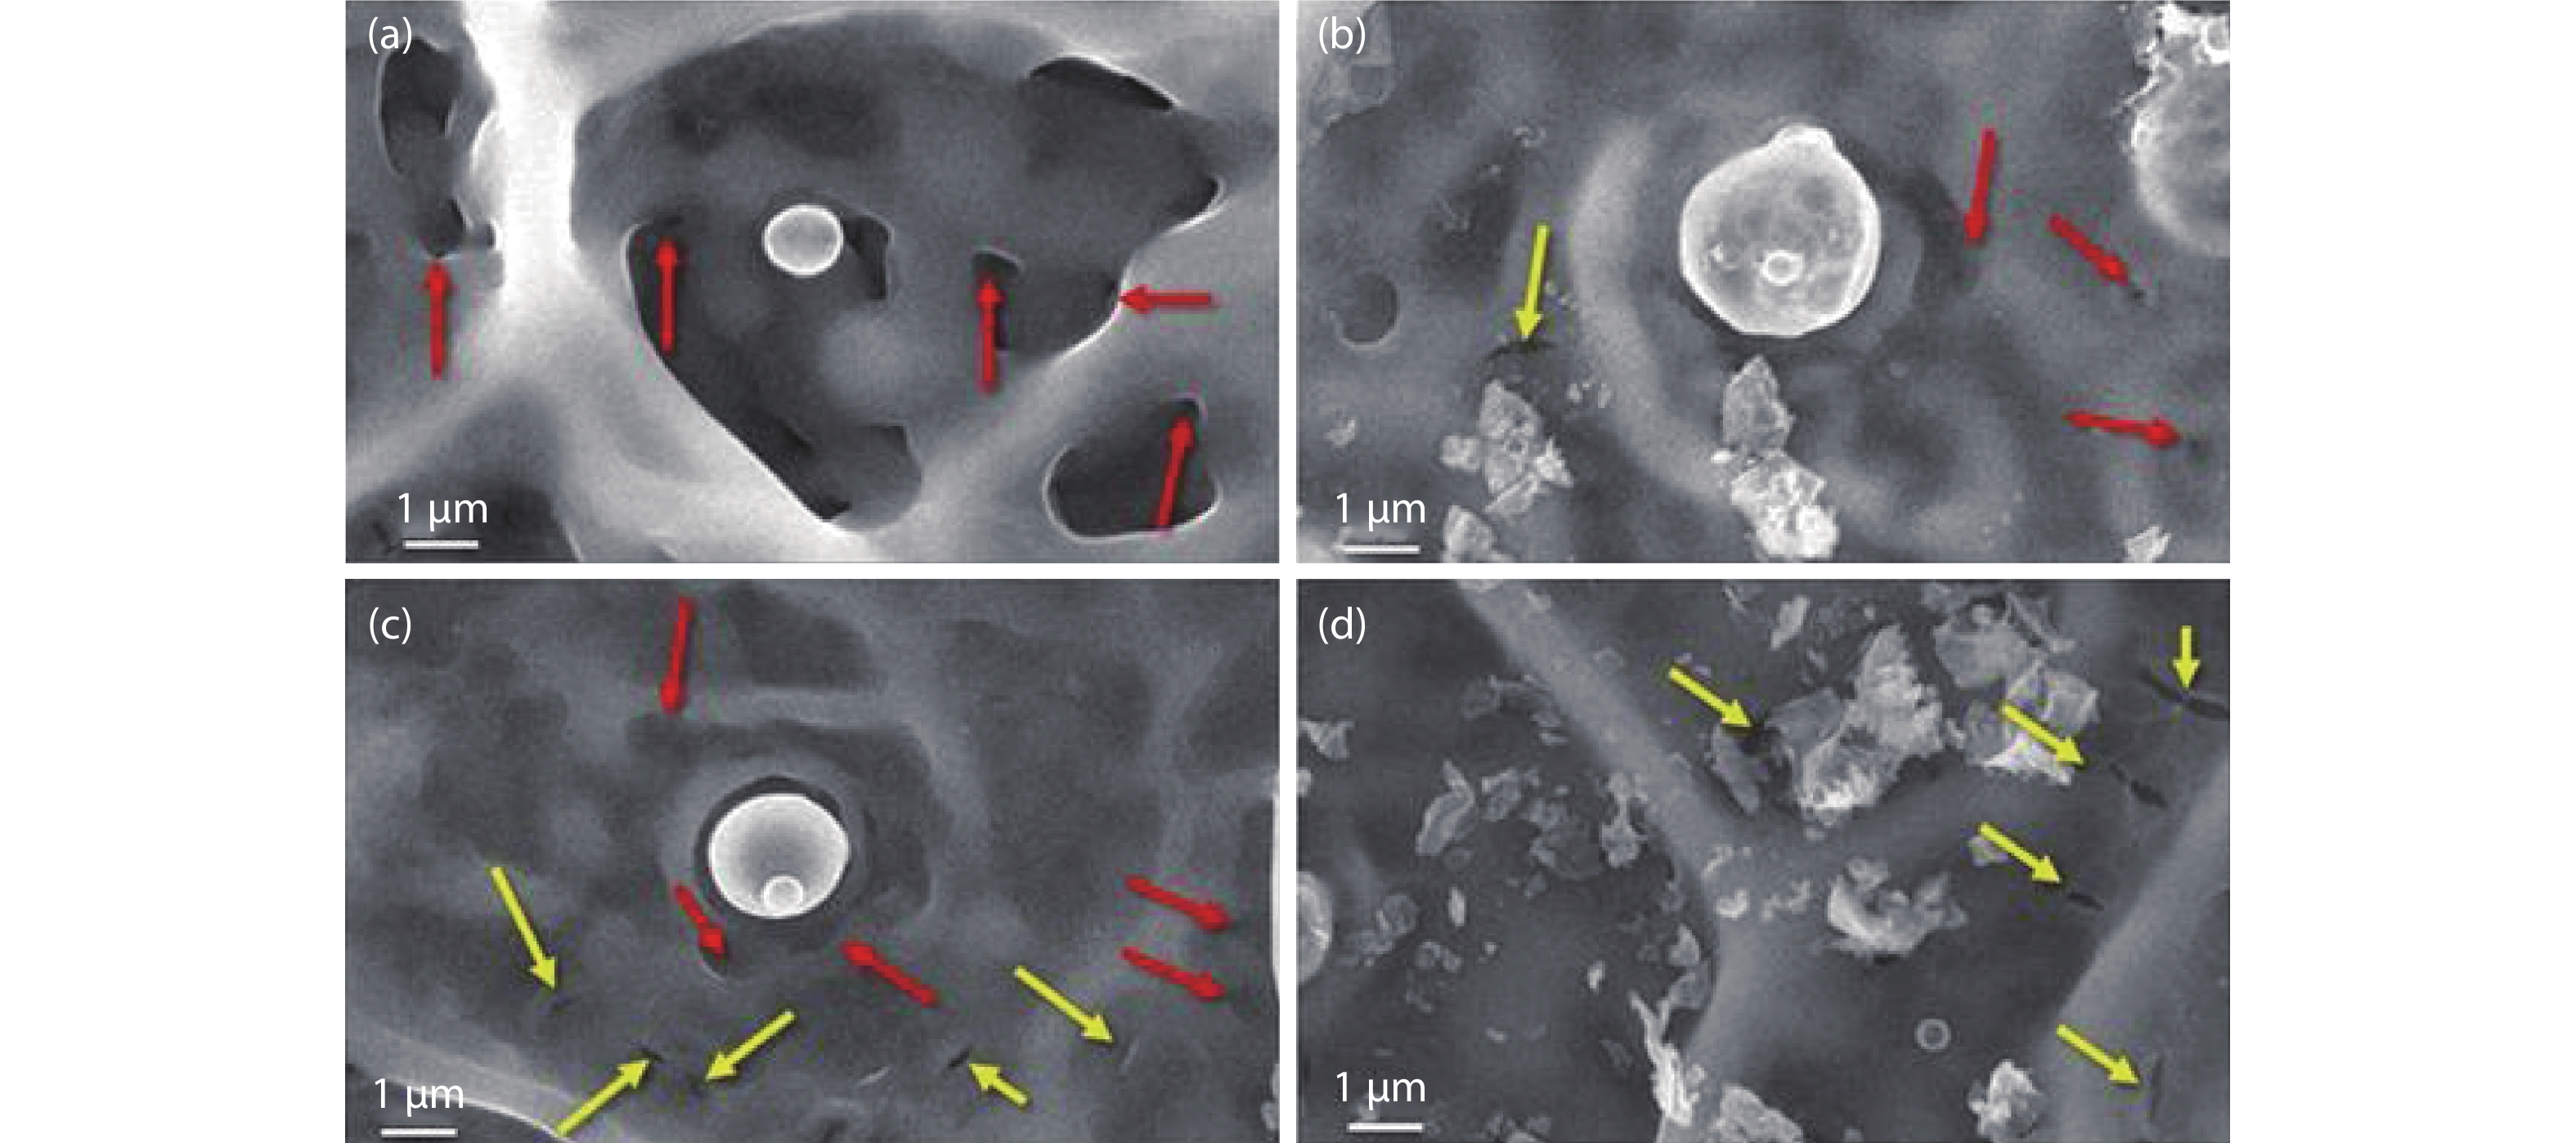
Fig. 2. SEM image for (a) pristine TiO2, (b) 1 vol% Fe:TiO2, (c) 2 vol% Fe:TiO2 and (d) 4 vol% Fe:TiO2 samples.
Fig. 3. EDX spectrum of (a) pristine TiO2, (b) 1 vol% Fe:TiO2, (c) 2 vol% Fe:TiO2 and (d) 4 vol% Fe:TiO2 samples.
Fig. 4. (Color online) Variation of resistance with temperature for (a) pristine TiO2, (b) 1 vol% Fe:TiO2, (c) 2 vol% Fe:TiO2 and (d) 4 vol% Fe:TiO2 samples.
Fig. 5. (Color online) Variation of log(R a) with temperature to calculated TCR for (a) pristine TiO2, (b) 1 vol% Fe:TiO2, (c) 2 vol% Fe:TiO2 and (d) 4 vol% Fe:TiO2 samples.
Fig. 6. (Color online) Variation of log(R a) with 1000/T to calculate activation energy for (a) pristine TiO2, (b) 1 vol% Fe:TiO2, (c) 2 vol% Fe:TiO2 and (d) 4 vol% Fe:TiO2 samples.
Fig. 7. (Color online) Variation of resistance with percentage of relative humidity for (a) pristine TiO2, (b) 1 vol% Fe:TiO2, (c) 2 vol% Fe:TiO2 and (d) 4 vol% Fe:TiO2 samples.
Fig. 8. (Color online) Variation of sensitivity with percentage of relative humidity for (a) pristine TiO2, (b) 1 vol% Fe:TiO2, (c) 2 vol% Fe:TiO2 and (d) 4 vol% Fe:TiO2 samples.
Fig. 9. (Color online) Variation of sensitivity with percentage of relative humidity for different time interval for 2 vol% Fe :TiO2 sample.
Fig. 10. (Color online) Hysteresis loops for for (a) pristine TiO2, (b) 1 vol% Fe:TiO2, (c) 2 vol% Fe:TiO2 and (d) 4 vol% Fe:TiO2 samples.
Fig. 11. (Color online) Variation of resistance with time to calculate response and recovery time for pristine TiO2, 1 vol% Fe:TiO2, 2 vol% Fe:TiO2 and 4 vol% Fe:TiO2 samples.
Fig. 12. (Color online) Variation sensitivity and response time with different Fe vol% for Fe doped TiO2 thin films.
|
Table 1. Structural properties of pristine and Fe-doped TiO2 thin films.
|
Table 2. EDX spectrum for pristine and Fe-doped TiO2 thin films.
| |||||||||||||||||||||||||||||||||||||||||||||
Table 3. Electrical resistance, TCR and activation energy for pristine and Fe-doped TiO2 thin films.
|
Table 4. Sensitivity, response, recovery time and % of hysteresis loss for pristine and Fe-doped TiO2 thin films.


Set citation alerts for the article
Please enter your email address

© Copyright 2018-2021 | Chinese Laser Press. All Rights Reserved 沪ICP备15018463号-20