
Dipak L Gapale, Pranav P. Bardapurkar, Sandeep A. Arote, Sanjaykumar Dalvi, Prashant Baviskar, Ratan Y Borse. Humidity sensing properties of spray deposited Fe doped TiO2 thin film[J]. Journal of Semiconductors, 2021, 42(12): 122805
- Journal of Semiconductors
- Vol. 42, Issue 12, 122805 (2021)
Abstract
1. Introduction
Titanium dioxide (TiO2) is a versatile semiconducting metal oxide, which is extensively studied in nanoparticles and thin film form and found applications in various fields of science and technology. The notable properties of TiO2 include high dielectric constant[
Along with the interesting properties, ease of synthesis – including various physical and chemical methods – is also one of the significant factors responsible for the extensive studies on TiO2 material. The chemical methods require less instrumentation and are commonly employed to synthesize the pure, metal and their oxide-doped TiO2 thin films. Various chemical methods were employed for the synthesis of pristine and doped TiO2 thin films out of these; spray pyrolysis is one of the simplified and economic techniques for the thin film deposition over a larger surface area. The metal oxide thin films were successfully deposited onto the substrate for using a modified spray pyrolysis technique, because of its versatile features like easy handling, multi-composite film deposition, and economic route. In the spray technique, films were deposited by forming fine droplets of precursor solution and then driving them towards the hot substrate. The quality of film is governed by the air to precursor solution ratio, substrate temperature and the distance between spray nebulizer and substrate etc. The details about the spray system were well discussed in previous reports[
Transient metal ions or their oxides are commonly used dopants into TiO2. The transient metal ions can significantly change crystalline structure, size and shape of the nanomaterial, surface morphology, optical band gap, surface to volume ratio etc. In literature, various reports show that properties like enhanced charge carrier separation[
Ferrous (Fe) can be a good dopant to tailor the properties of TiO2 as the ionic radius of Fe3+ (0.64 Å) is very close to that of Ti4+ (0.68 Å), which makes the doping easy. Further, the doping of the ferrous (band gap is 2.4 eV) introduces an intermediate band gap state which then reduces the optical band gap of the TiO2 films[
The structural properties of host material like crystallite size, crystal structure dislocation as well as microstrain found to be altered by varying Fe dopant concentration. Fe dopant can also change electronic structure and enhance the photocatalytic activity as well as sensing properties of the parent titanium dioxide[
The design and development of the humidity sensor is one of the recent areas of research due to their wide range of applications in industrial processing, semiconductor and automobile industries, environment monitoring and control etc.[
The TiO2-based humidity sensor is a resistance-based semiconductor-type humidity sensor. In literature, various reports are available on pristine, doped and composite TiO2 materials. Jyothilal et al. reported high sensitivity for TiO2 nano-array synthesized using an electron beam-assisted physical evaporation technique with very low response and recovery time[
With this context, the present paper discusses the effect of Fe dopant concentration on structural, morphological and electrical properties and their correlation with humidity sensing performance.
2. Experimental
Fe-doped TiO2 film samples were successfully deposited on glass substrates with various Fe dopant vol% by a spray pyrolysis technique. Analytical grade titanium tri-chloride (TiCl3; Sigma Aldrich) and ferrous chloride tetra-hydrate (FeCl2.4H2O; Sigma Aldrich) were used as precursors. The concentration of both the precursor solutions was adjusted to 0.1 M to control the atomic weight percentage of the species (Ti and Fe). The two precursor solutions were mixed vigorously using a magnetic stirrer at room temperature with different vol% to maintain the fixed atomic weight percentage. Other spray parameters such as deposition temperature (350 °C), distance between spray gun to substrate (30 cm), solution flow rate (1 ml per minute), carrier air flow rate (7.5 lpm) etc. were kept constant during the deposition. After the deposition, samples were annealing at a temperature of 500 °C for 2 h in an air atmosphere.
The structural properties of the prepared films were studied by X ray diffractometry (XRD) using a BRUKER D8 ADVANCE diffractometer. The microstructural properties were studied using scanning electron microscopy (SEM) with a JEOL-540LV microscope. The electrical and humidity sensing characterization was done by an in-situ set up designed for resistance measurement. To study humidity sensing properties, film resistances were measured as a function of change in relative humidity. A humidity meter (MEXTECH, model no. M288CTHW) was used to record relative change in humidity.
3. Results and discussion
3.1. XRD analysis
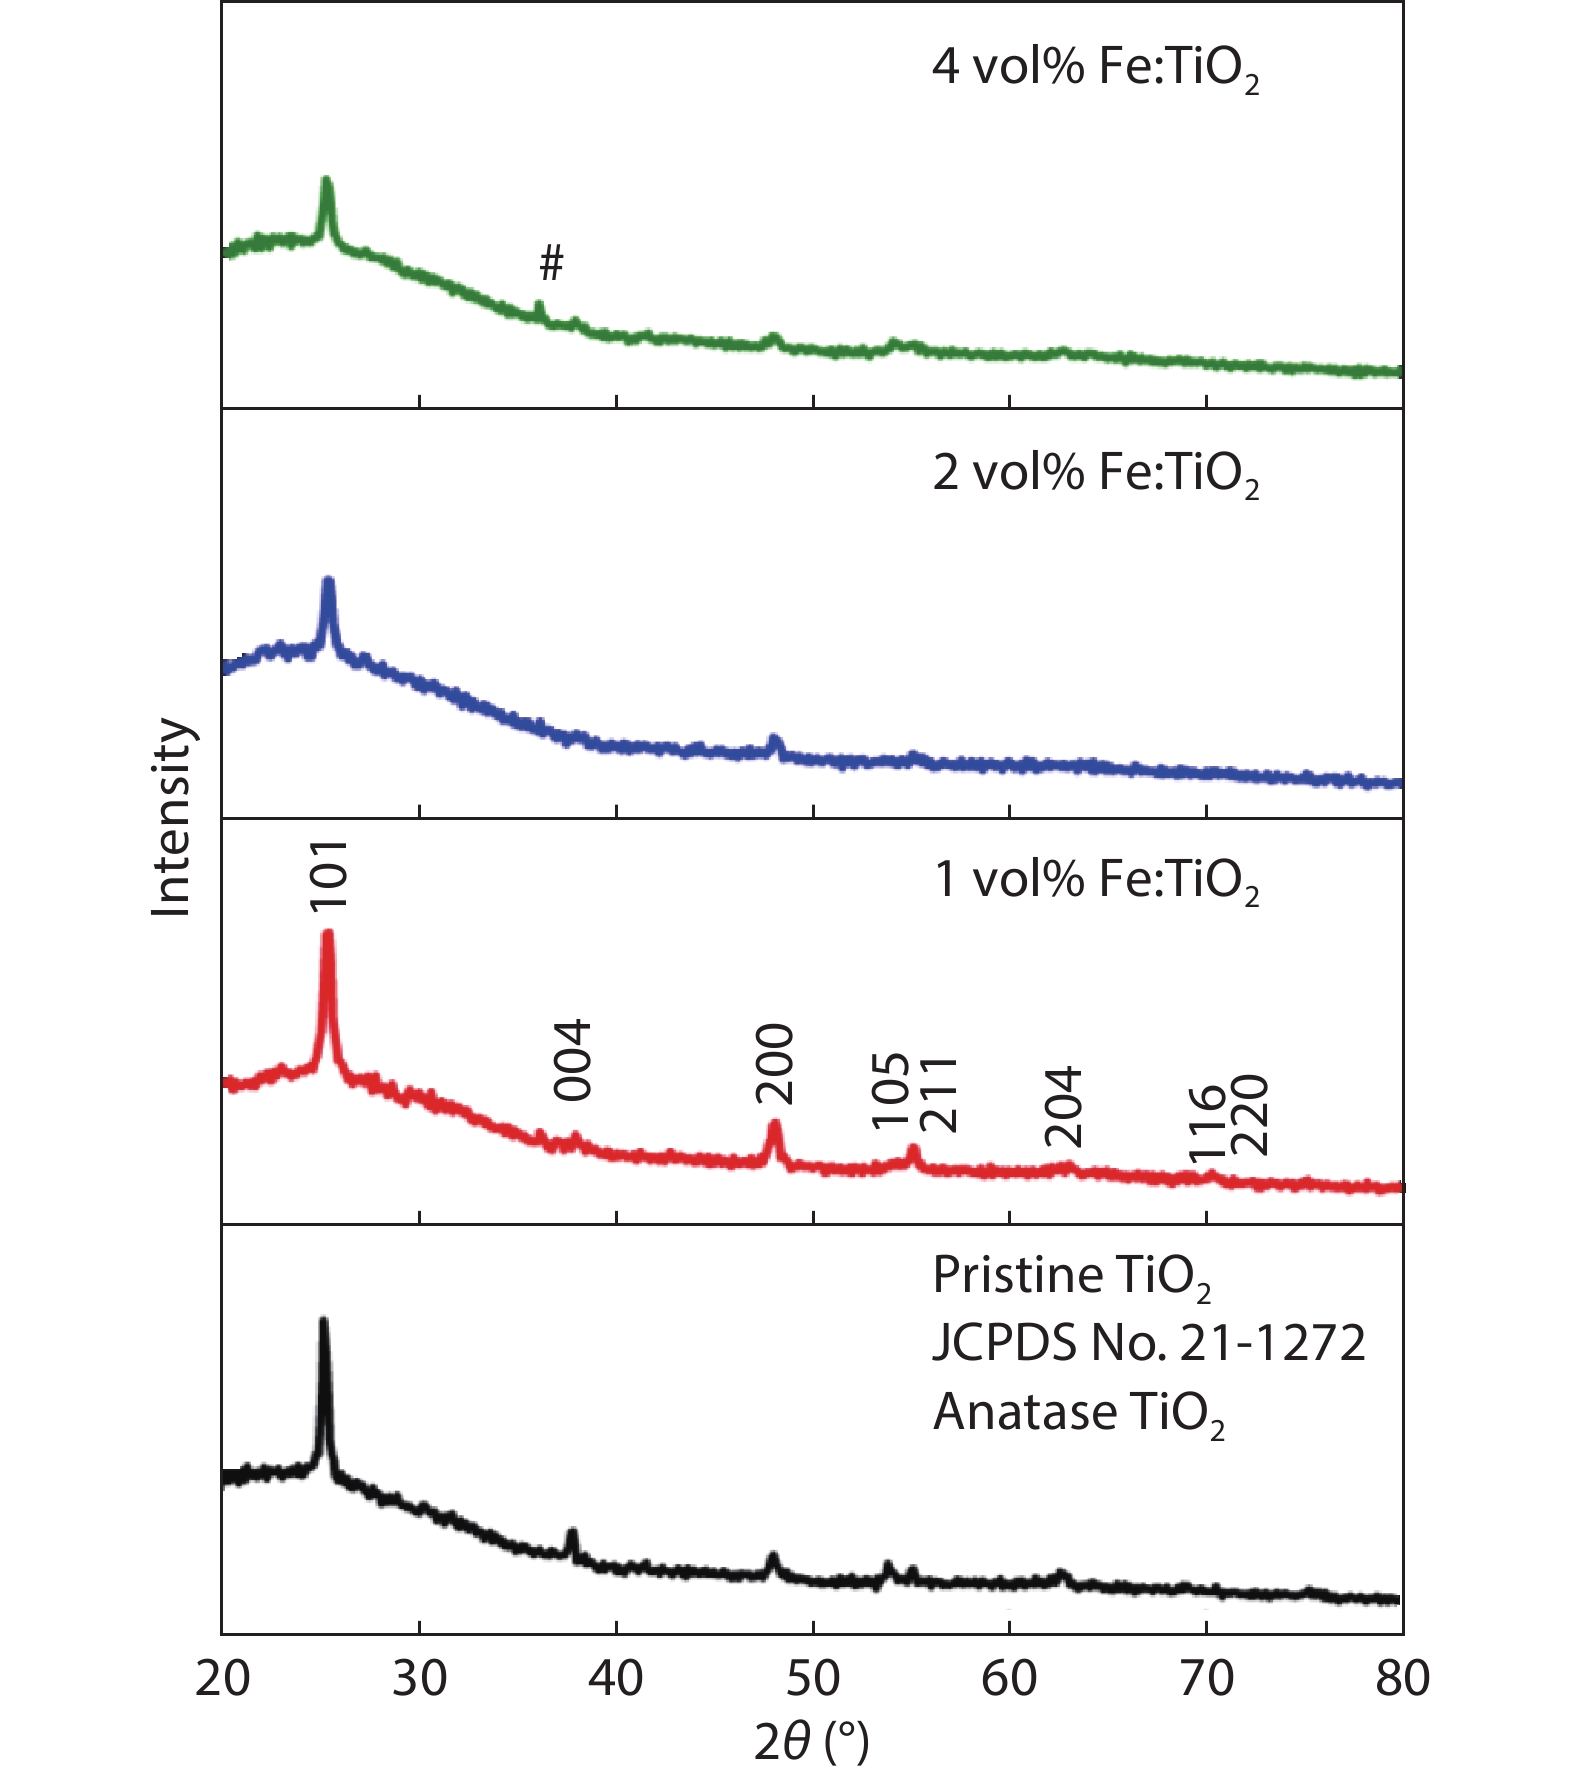
Fig. 1 presents XRD patterns for the pure and Fe3+ doped TiO2 samples with different Fe dopant 1 vol%; annealed at a temperature of 500 °C. XRD pattern of pristine TiO2 shows peaks corresponding to crystalline planes (101), (004), (200), (105), (211), (204) and (116), of anatase TiO2 tetragonal phase. From Fig. 1. it is observed that the intensity of the diffraction peaks decreases with Fe3+ dopant 1 vol%. Also, the increase in peak broadening indicates the reduction in crystallite size with augmented Fe3+ doping. The deposited samples showed a polycrystalline nature with the anatase TiO2 crystalline phase for pristine, 1 vol% and 2 vol% Fe3+ doped TiO2 samples while the 4 vol% doping sample shows mixed anatase and rutile phase. No other impurity phases observed into the crystalline material, which confirmed that Fe3+ ions are successfully amalgamated into the TiO2 lattice structure without the formation of iron oxide on the TiO2 surface[
![]()
Figure 1.XRD patterns for pristine and Fe-doped TiO2 thin films annealed at 500 °C (# rutile).
The measured parameters like texture coefficient, microstrain, dislocation densities and specific surface area have been added in Table 1. Structural parameters such as texture coefficient, crystallite size, microstrain, specific surface area and dislocation density were calculated using appropriate formulae as discussed in an earlier report[
The texture coefficient, micro strain, dislocation densities and specific surface area are respectively given by
Texture coefficient:
where Tc(hkl) is the texture coefficient of the (hkl) plane, I(hkl) is the measured intensity from the (hkl) plane, I0(hkl) is the JCPDS standard intensity of the (hkl) plane, and N is the number of diffraction peaks.
Microstrain:
where d0 is the interplanar distance of bulk material (TiO2d0 = 3.520 Å), d is the experimentally predicted interplanar distance.
Dislocation density:
where n is a proportionality factor, for minimum dislocation density n = 1 and D is the crystallite size.
Specific surface area
where SA is the specific surface area, D is the crystallite size (spherical shaped), and ρ is the density of TiO2 (anatase phase 3.890 g/cm3).
Properties of the thin film materials are strongly affected by a preferred crystallographic orientation or texture. The properties like crystal structure, crystal morphology and intensity of the diffraction peak can be ascribed to the presence of texture into film materials, thus it is essential to evaluate quantitative effect of the texture on the properties of material to optimize its applications. The value of the texture coefficient was calculated for the predominant crystalline plane, (101). Texture coefficient value that differs from unity indicates preferential orientation and if it is greater than unity, it indicates preferentially grown facets. Texture coefficient for pure TiO2 sample is greater than that for Fe-doped TiO2 as presented in Table 1. Reduction in preferential orientation was observed with an increase in Fe3+ dopant vol%. The fall in the texture coefficient (Tc) for the (101) plane indicates a reduction in the crystalline quality[
Microstrain in the pristine and Fe3+ doped TiO2 samples was calculated and was observed to increase with an increase in Fe3+ dopant vol%. Similarly, dislocation density and specific surface area of pristine and Fe3+ doped TiO2 films were found to increase with increase in the amount of Fe3+, which indicates an increase in crystal lattice defects[
3.2. Microstructural analysis
The SEM micrographs of the spray-synthesized pristine and Fe-doped TiO2 samples are presented in Fig. 2, which show the samples exhibit interconnected webs like morphology and the particles are attached to the interconnected webs. Patil et al.[
![]()
Figure 2.SEM image for (a) pristine TiO2, (b) 1 vol% Fe:TiO2, (c) 2 vol% Fe:TiO2 and (d) 4 vol% Fe:TiO2 samples.
3.3. Elemental analysis
The elemental analysis for pristine and Fe3+ doped TiO2 thin films was carried out using energy dispersive spectroscopy (EDX) method. The EDX spectra for pure and Fe3+ doped TiO2 thin films with various Fe3+ concentrations are presented in Figs. 3(a)–3(d) and Table 2. These spectra show the peaks of Ti (energy ~ 4.5 keV), O (energy ~ 0.525 keV), Fe (energy ~ 6.398 keV) and Si (energy ~ 1.739 keV) without any other impurities. This confirms that the synthesized samples consist of Ti, Fe, and O elements present in Fe3+ doped TiO2 thin films. The peak that corresponds to the Si element present in the EDX spectrum is due to the use of silica substrate for the thin film deposition.
![]()
Figure 3.EDX spectrum of (a) pristine TiO2, (b) 1 vol% Fe:TiO2, (c) 2 vol% Fe:TiO2 and (d) 4 vol% Fe:TiO2 samples.
Table Infomation Is Not Enable3.4. Electrical properties
The electrical resistance of pristine and Fe doped TiO2 films were found to decrease with increase in Fe3+ vol%. The resistance of 4 vol% Fe doped TiO2 sample is more than that of the other samples due to the presence of micro crack on the sample and breakdown of agglomerated particles, which leads to the increase in its resistance. With the increase in temperature, the electric resistance of the samples increases initially (up to 120 °C) and then decreases with a further increase in temperature. Such an increase in resistance at a lower temperature range indicates the humid condition in the atmosphere. With an increase in temperature at a lower range, moisture absorbed by the samples decrease and the resistance of the film samples increases. This shows that the synthesized material has good humidity sensing properties. With a further increase in temperature, resistance of the film samples decrease. The exponential decrease in the resistance indicates semiconducting nature of the samples. It is reported in the literature when, for Fe-doped TiO2 samples, there is a transition of n-type to p-type electrical conductivity. Also, at elevated temperatures, pristine TiO2 exhibits n-type conductivity but the iron-doped TiO2 materials present p-type electrical conductivity[
![]()
Figure 4.(Color online) Variation of resistance with temperature for (a) pristine TiO2, (b) 1 vol% Fe:TiO2, (c) 2 vol% Fe:TiO2 and (d) 4 vol% Fe:TiO2 samples.
![]()
Figure 5.(Color online) Variation of log(
Activation energy for the synthesized samples was calculated using Arrhenius plots of the synthesized samples as shown in Fig. 6. At lower temperatures, Mott variable range hopping (VRH) mechanism is observed in semiconducting nano-materials while at a higher temperature the Arrhenius mechanism dominates. Calculated activation energy was observed to increase from 0.3395 to 0.5201 eV for the heating cycle with increase in Fe3+ dopant vol% as tabulated in Table 3. The increase in activation energy at a higher temperature can be explained on the basis of activation of the working level due to iron doping into TiO2. During the cooling cycle, activation energy was observed to be higher than that during the heating cycle. The increase in activation energy during the cooling cycle is attributed to irreversible oxidation processes. With the increase in Fe concentration, the oxidation vacancies increases in the sample. Now, during the heating cycle the entropy of the sample increases with temperature. While during the cooling cycle, the entropy decreases with temperature; in this case the reactant species (may be from atmosphere) join with the sample surface to form over transection states along the interaction, such as transection states of the reactants leads to an increase in activation energy.
![]()
Figure 6.(Color online) Variation of log(
3.5. Humidity sensing properties
Humidity sensing performance of the Fe3+ doped TiO2 samples synthesized at different Fe dopant concentrations were studied by measuring the change in resistance with corresponding change in relative humidity to determine sensitivity and as a function of time for a fixed humid condition; to determine response and recovery time of the sensor material. The resistance of Fe3+ doped TiO2 samples was observed to decrease with the change in percentage of the relative humidity as presented in Fig. 7 and shows a nonlinear trend. A higher rate of change of sample resistance with a change in percentage of relative humidity was high at lower humidity and was low at higher relative humidity. Thus, the variation of resistance with a percentage of relative humidity is exponential in nature. Such an exponential nature of resistance with relative humidity may be due to the formation of the chemisorbed and physisorbed layers on the surface of the film samples in humid conditions. The concentration of surface charge carriers is an important factor that can affect the amount of absorbed water vapour on the surface of the samples[
![]()
Figure 7.(Color online) Variation of resistance with percentage of relative humidity for (a) pristine TiO2, (b) 1 vol% Fe:TiO2, (c) 2 vol% Fe:TiO2 and (d) 4 vol% Fe:TiO2 samples.
Sensitivity of a sensor can be defined as the ratio of difference in the resistance between dry and humid conditions to the resistance at dry conditions[
![]()
Figure 8.(Color online) Variation of sensitivity with percentage of relative humidity for (a) pristine TiO2, (b) 1 vol% Fe:TiO2, (c) 2 vol% Fe:TiO2 and (d) 4 vol% Fe:TiO2 samples.
Reproducibility of sensor performance was studied by repeating the measurements at different periods of time and the results are presented in Fig. 9, which shows that the sensitivity of the sensor decreases as the time goes on.
![]()
Figure 9.(Color online) Variation of sensitivity with percentage of relative humidity for different time interval for 2 vol% Fe :TiO2 sample.
Hysteresis is defined as the lag of the resistance/sensitivity during the dehumidification process or it is the difference between resistance/sensitivity with respect to the humidification and dehumidification process. A sensor must have low hysteresis loss, which is correlated to the stability and reliability of the sensor material.
Hysteresis loss can be expressed in terms of percentage of hysteresis which can be calculated using the relation[
where Rdehumid is resistance at mean value of percent relative humidity (PRH) of the sample during dehumidification, Rdehumid is resistance at mean value of PRH of the sample during humidification, Rmax is the resistance at maximum PRH and Rmin is the resistance at minimum PRH.
In the present study, it was observed that the percentage of hysteresis loss for the pristine sample is less, as compared to Fe doped samples; also it was found that the hysteresis loss increases with Fe doping as shown in Fig. 10. However, as the loss for all the samples is below 5%, which is too low as presented in Table 4, it suggests high stability and reliability of the synthesized samples as the humidity sensor which was confirmed by repeating the observations as well as by taking observations within a prescribed period of time.
![]()
Figure 10.(Color online) Hysteresis loops for for (a) pristine TiO2, (b) 1 vol% Fe:TiO2, (c) 2 vol% Fe:TiO2 and (d) 4 vol% Fe:TiO2 samples.
Table Infomation Is Not EnableThe response time of a sensor is the time required to achieve 90% of the total resistance change for humidification/adsorption process while the recovery time is time required to achieve 90% of the total resistance change for the dehumidification/desorption process. Fig. 11 shows variations of change in resistance with corresponding change in time which presents response and recovery time for the pure and Fe-doped TiO2 samples. The response time was found to change with a change in Fe dopant level. The minimum response time of 52 s was obtained for the 2 vol% of Fe-doped TiO2 sample and with a further increase in Fe doping, the response time was found to increase. The recovery time observed for all the samples were very small; around 3 s as shown in Table 4.
![]()
Figure 11.(Color online) Variation of resistance with time to calculate response and recovery time for pristine TiO2, 1 vol% Fe:TiO2, 2 vol% Fe:TiO2 and 4 vol% Fe:TiO2 samples.
The morphology of the sensing material plays an important role, which is ascribed to the amount of water vapour adsorbed and desorbed on its surface. The presence of the pore and its distribution over the surface of the sample considerably affects the sensitivity of the sample. During humidification, water vapours on the surface of the sensing sample shows a strong correlation with the pore size and its distribution. The open or closed pore surface has its own contribution in humidity sensitivity. Open pores have the advantage of capillary conduction mechanism, which can enhance sensitivity of the material[
Thus, getting optimum size micro-pores is a notable success for better humidity sensing performance[
Chemisorption is an adsorption due to the chemical reaction between the surface species and the adsorbates, while the physisorption adsorption is due to van der Waals forces between chemisorbed layer and the adsorbates. The chemisorbed water molecules exerted an electrostatic field, which not only attracted water molecules but also reduced the strength of oxygen to hydrogen bonds of the physiosorbed water molecules. The electric potential present in chemisorbed water molecule is a source of resistance change, depending upon chemisorbed water molecules and its reaction with surface site adsorption altering the resistance of the samples. The chemical reactions in chemisorbed and physiosorbed water molecules are as follows:
where M is Ti or Fe atoms species.
The sensitivity of the sensing material strongly depends on its surface charge species and the silica substrate does not affect the performance. The very large potential difference between adsorbed water molecules charges present inside the sample material and the substrate inhibits any conduction between them. Si is on the interface between the glass substrate and the samples; therefore, it could not influence the sensitivity of the samples. The elemental analysis of the sample showed the existence of Si from the glass substrate and not from the samples; therefore, the bare substrate does not exhibit any humidity sensing properties.
The complete results of the humidity sensitivity and response time of the sample varies with the Fe vol% were presented in Fig. 12. Which clearly indicates that the optimized Fe dopant vol% for better humidity sensing performance is 2 vol%.
![]()
Figure 12.(Color online) Variation sensitivity and response time with different Fe vol% for Fe doped TiO2 thin films.
With the increase in the amount of Fe, the structural parameters such as micro-stress, dislocation densities, specific surface area get advanced, which can be used to tailor the sensitivity accordingly.
4. Conclusions
Pristine and Fe-doped TiO2 thin films were successfully synthesized by a spray pyrolysis technique on a glass substrate with Fe dopant vol%. The effects of the Fe dopant vol% on structural, electrical and humidity sensing properties of TiO2 were successfully studied using appropriate methods. The structural properties like crystallite size, texture coefficient, micro-strain, dislocation density and specific surface area were estimated from XRD data. The XRD study shows that the crystallite size decreases with an increase in Fe doping percentage. The XRD profile also shows a small shift and reduction in the intensity of the characteristic (101) plane with doping. The mixed anatase and rutile crystalline TiO2 phase were observed for the sample synthesized at 4 vol% Fe, while the other samples synthesized up 2 vol% showed a polycrystalline anatase tetragonal phase. The electrical resistance was observed to decline with a rise in dopant percentage. The temperature coefficient of resistance (TCR) and activation energy were also found to increase with the increase in Fe dopant percentage. Humidity sensing properties of the samples were also affected by the Fe dopant percentage and it was found that the sensitivity increases with Fe dopant vol% and was found to be maximum at 2 vol% doping of Fe. The minimum response time was observed to be 52 s for sample synthesized with 2 vol% of Fe.
Acknowledgements
The authors greatly acknowledge the Department of Science and Technology, Govt. of India, New Delhi, for financial assistance under the DST-FIST scheme (SR/FST/College-258/2015, dtd.14th Sep, 2016) and the DBT star college scheme. The authors also thank colleagues and students of the department for their support in this work. Authors express sincere thanks to Dr. Sanjay Malpani, Chairman, S.P. Sanstha and Principal Prof. Dr. A. H. Gaikwad for encouragement and infrastructure facilities. We also appreciate the technical support and characterization facility provided by the Department of Physics, S.P. Pune University.
References
[1] C E Kim, I Yun. Effects of the interfacial layer on electrical properties of TiO2-based high-k dielectric composite films. ECS Trans, 45, 89(2012).
[2] A Taherniya, D Raoufi. The annealing temperature dependence of anatase TiO2 thin films prepared by the electron-beam evaporation method. Semicond Sci Technol, 31, 125012(2016).
[3] R S Khaleel, M S Hashim. Fabrication of TiO2 sensor using rapid breakdown anodization method to measure pressure, humidity and sense gases at room temperature. Iraqi J Sci, 60, 1694(2019).
[4] M Vanmathi, M S Kumar, M M Ismail. Optimization of process parameters for al-doping back ground on CO gas sensing characteristics of magnetron-sputtered TiO2 sensors. Mater Res Express, 6, 106423(2019).
[5] C H Ashok, K V Rao, C H S Chakra. Comparison of metal oxide nanomaterials: Humidity sensor applications. Mater Energy Environ Eng, 267(2017).
[6] M M Khan, S F Adil, A Al-Mayouf. Metal oxides as photocatalysts. J Saudi Chem Soc, 19, 462(2015).
[7] K Kaviyarasu, N Geetha, K Kanimozhi. In vitro cytotoxicity effect and antibacterial performance of human lung epithelial cells A549 activity of zinc oxide doped TiO2 nanocrystals: Investigation of bio-medical application by chemical method. Mater Sci Eng C, 74, 325(2017).
[8] D L Gapale, S A Arote, R Y Borse. Mathematical modeling of droplet formation, evaporation, and film growth to study crystallite size and film thickness of spray pyrolysis deposited TiO2 thin films. e-J Surf Sci Nanotechnol, 16, 419(2018).
[9] A S Hassanien, A A Akl. Optical characteristics of iron oxide thin films prepared by spray pyrolysis technique at different substrate temperatures. Appl Phys A, 124, 752(2018).
[10] K T Ranjit, H Cohen, I Willner. Lanthanide oxide-doped titanium dioxide: Effective photocatalysts for the degradation of organic pollutants. J Mater Sci, 34, 5273(1999).
[11] J Nowotny, C C Sorrell, L R Sheppard. Solar-hydrogen: environmentally safe fuel for the future. Int J Hydrogen Energy, 30, 521(2005).
[12] D A H Hanaor, C C Sorrell. Review of the anatase to rutile phase transformation. J Mater Sci, 46, 855(2011).
[13] D J Reidy, J D Holmes, M A Morris. The critical size mechanism for the anatase to rutile transformation in TiO2 and doped-TiO2. J Eur Ceram Soc, 26, 1527(2006).
[14] N Serpone. Is the band gap of pristine TiO2 narrowed by anion- and cation-doping of titanium dioxide in second-generation photocatalysts. J Phys Chem B, 110, 24287(2006).
[15] V N Nguyen, N K T Nguyen, P H Nguyen. Hydrothermal synthesis of Fe-doped TiO2 nanostructure photocatalyst. Adv Nat Sci Nanosci Nanotechnol, 2, 035014(2011).
[16] S B Eadi, S Kim, S W Jeong. Novel preparation of Fe doped TiO2 nanoparticles and their application for gas sensor and photocatalytic degradation. Adv Mater Sci Eng, 2017, 2191659(2017).
[17] R Dholam, N Patel, M Adami. Hydrogen production by photocatalytic water-splitting using Cr- or Fe-doped TiO2 composite thin films photocatalyst. Int J Hydrogen Energy, 34, 5337(2009).
[18] D Hernández-Rivera, G Rodríguez-Roldán, R Mora-Martínez et al. A capacitive humidity sensor based on an electrospun PVDF/graphene membrane. Sensors, 17, 1009(2017).
[19] G Shukla, S Walia, S Kundu et al. Humidity sensing and breath analyzing applications of TiO2 slanted nanorod arrays. Sens Actuators A, 301, 111758(2019).
[20] Z Li, A A Haidry, B Gao et al. The effect of Co-doping on the humidity sensing properties of ordered mesoporous TiO2. Appl Surf Sci, 412, 638(2017).
[21] M Zhang, S Wei, W Ren et al. Development of high sensitivity humidity sensor based on Gray TiO2/SrTiO3 composite. Sensors, 17, 1310(2017).
[22] T Ali, P Tripathi, A Azam. Photocatalytic performance of Fe-doped TiO2 nanoparticles under visible-light irradiation. Mater Res Express, 4, 015022(2017).
[23] X Hou, M Huang, X Wu. First-principles calculations on implanted TiO2 by 3d transition metal ions. Sci China Ser G, 52, 838(2009).
[24] Z Essalhi, B Hartiti, A Lfakir. Optical properties of TiO2 Thin films prepared by Sol Gel method. J Mater Environ Sci, 7, 1328(2016).
[25] D L Gapale, S A Arote, B M Palve. Effect of film thickness on humidity sensing of spray deposited TiO2 thin films. Mater Res Express, 6, 026402(2018).
[26] P B Nair, L V Maneeshya, V B Justinvictor. Evolution of structural and optical properties of photocatalytic Fe doped TiO2 thin films prepared by RF magnetron sputtering. AIP Conf Proc, 1576, 79(2014).
[27] C S Sebnem, S Corekci, M Cakmak. Structural investigation and electronic band transitions of nanostructured TiO2 thin films. Cryst Res Technol, 46, 1207(2011).
[28] Y Xu, S Wu, P Wan. Introducing Ti3+ defects based on lattice distortion for enhanced visible light photoreactivity in TiO2 microspheres. RSC Adv, 7, 32461(2017).
[29] D Li, H Song, X Meng et al. Effects of particle size on the structure and photocatalytic performance by alkali-treated TiO2. Nanomaterials, 10, 546(2020).
[30] A Reetu, S Agarwal et al. Improved dielectric and magnetic properties of Ti modified BiCaFeO3 multiferroic ceramics. J Appl Phy, 113, 023908(2013).
[31] L Patil, D Suryawanshi, I Pathan. Effect of variation of precursor concentration on structural, microstructural, optical and gas sensing properties of nanocrystalline TiO2 thin films prepared by spray pyrolysis techniques. Bull Mater Sci, 36, 1153(2013).
[32] Y Hiromi, H Masaru, M Junko. Photocatalytic degradation of organic compounds diluted in water using visible light-responsive metal ion-implanted TiO2 catalysts: Fe ion-implanted TiO2. Catal Today, 84, 191(2003).
[33] A R Bally, E N Korobeinikova, P E Schmid et al. Structural and electrical properties of Fe-doped thin films. J Phys D, 31, 1149(1998).
[34] P Traiwatcharanon, K Timsorn, C Wongchoosuk. Flexible room-temperature resistive humidity sensor based on silver nanoparticles. Mater Res Express, 4, 085038(2017).
[35] H Farahani, R Wagiran, M N Hamidon. Humidity sensors principle, mechanism, and fabrication technologies: A comprehensive review. Sensors, 14, 7881(2014).
[36] M Sasikumar, N P Subiramaniyam. Microstructure, electrical and humidity sensing properties of TiO2/polyaniline nanocomposite films prepared by sol–gel spin coating technique. J Mater Sci - Mater Electron, 29, 7099(2018).
[37] D L Gapale, S A Arote, B M Palve. Influence of precursor solution concentration on structural, optical and humidity sensing properties of spray deposited TiO2 thin films. J Semicond, 39, 122003(2018).
[38] K Rathi, K Pal. Impact of doping on GO: Fast response–recovery humidity sensor. ACS Omega, 2, 842(2017).
[39] R Keren. Water vapor isotherms and heat of immersion of Na/Ca-montmorillonite systems—I: Homoionic. Clays Clay Miner, 23, 193(1975).
[40] Y Ren, J Yang, Y Ma. Increasing sensing sensitivity of the Fe-α-Fe2O3 (104) surface by hydrogenation and the sensing reaction molecule mechanism. Sens Actuators B, 281, 366(2019).
[41] T Morimoto, M Nagao, F Tokuda. Relation between the amounts of chemisorbed and physisorbed water on metal oxides. J Phys Chem, 73, 243(1969).
[42] E Traversa, G Gnappi, A Montenero. Ceramic thin films by sol-gel processing as novel materials for integrated humidity sensors. Sens Actuators B, 31, 59(1996).
[43] N Camaioni, G Casalboremiceli, Y Li. Water activated ionic conduction in cross-linked polyelectrolytes. Sens Actuators B, 134, 230(2008).


Set citation alerts for the article
Please enter your email address

© Copyright 2018-2021 | Chinese Laser Press. All Rights Reserved 沪ICP备15018463号-20