• Journal of Infrared and Millimeter Waves
  • Vol. 39, Issue 2, 228 (2020)
Qin-Qin WU1, Xi-Cai LI1, Yuan-Qing WANG1、2、*, and Shu-Ping REN3
Author Affiliations
  • 1School of Electronic Science and Engineering, Nanjing University, Nanjing20023, China
  • 2Key Laboratory of Intelligent Optical Sensing and Manipulation, Ministry of Education,Nanjing University, Nanjing1003, China
  • 3JiangXi Academy of Sciences, Nanchang0000, China.
  • show less
    DOI: 10.11972/j.issn.1001-9014.2020.02.010 Cite this Article
    Qin-Qin WU, Xi-Cai LI, Yuan-Qing WANG, Shu-Ping REN. Human localization technology based on the pyroelectric infrared sensors[J]. Journal of Infrared and Millimeter Waves, 2020, 39(2): 228 Copy Citation Text show less
    The sketch map of the modulation strategy of Ref.12 and Refs.13-14 (a) The modulation strategy of Ref.12,(b) the modulation strategy of Refs.13-14
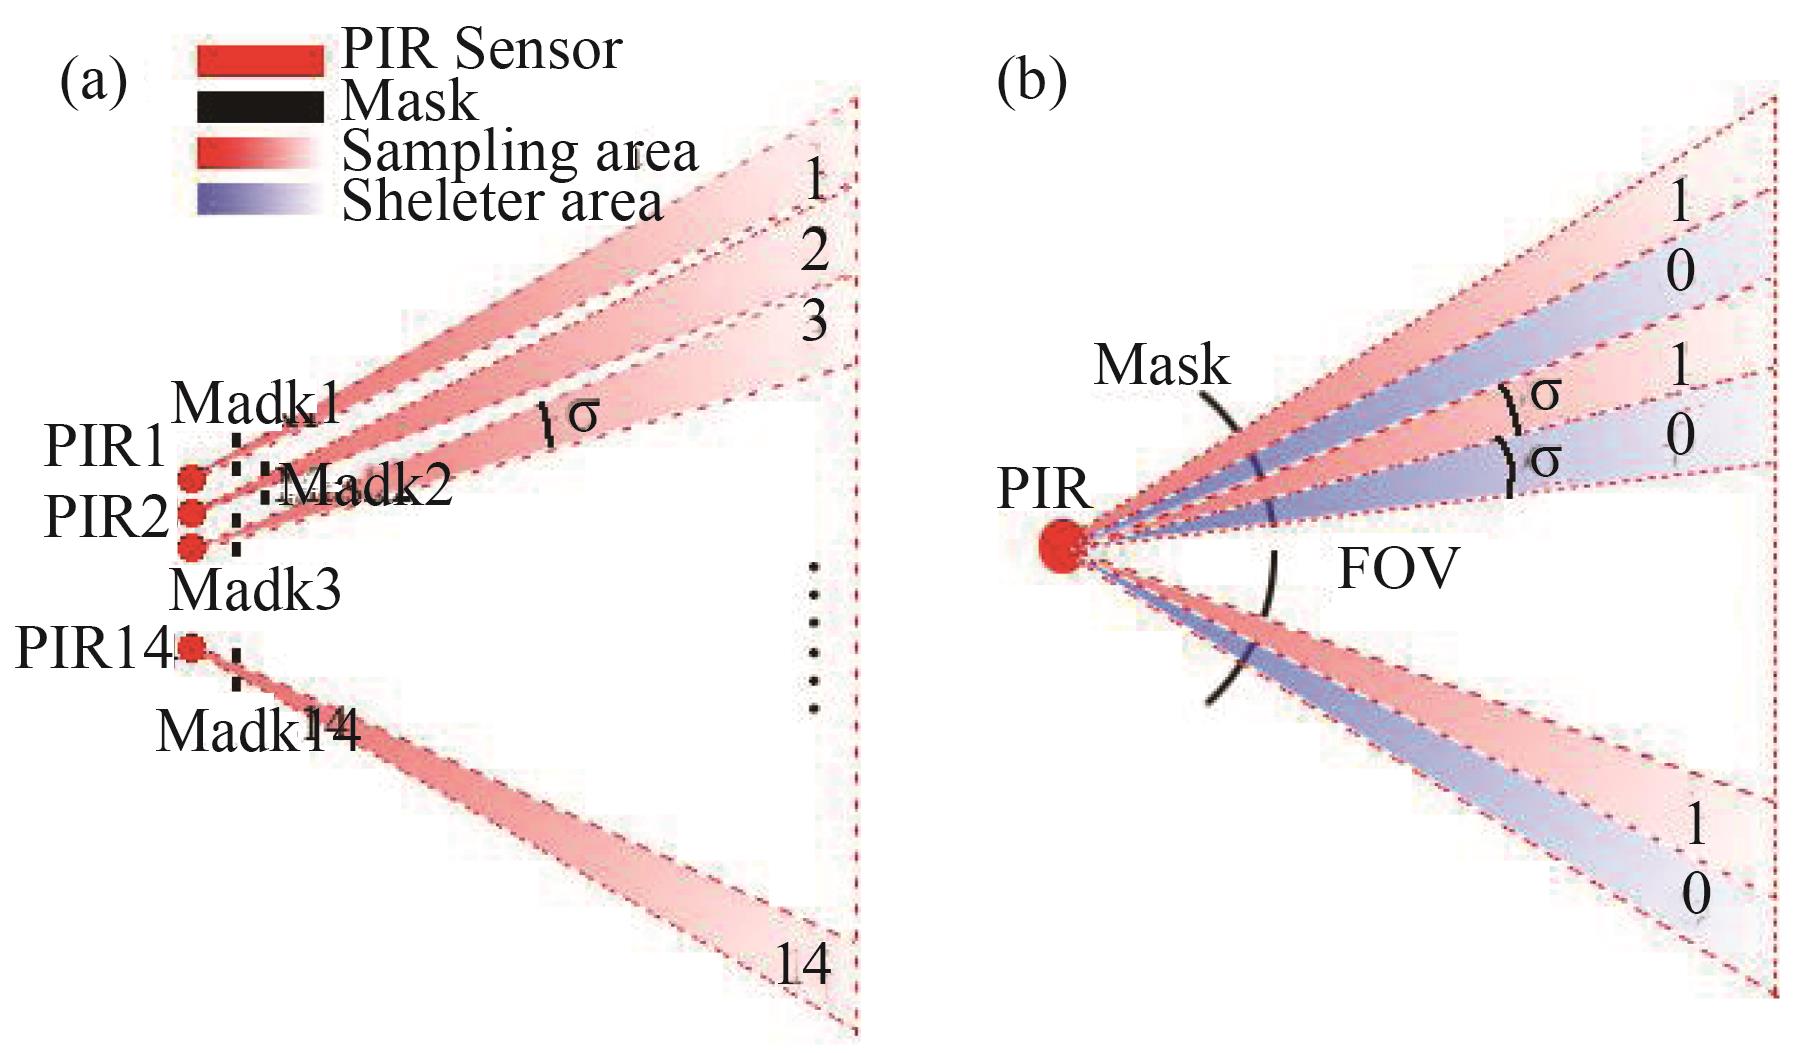
    Fig. 1. The sketch map of the modulation strategy of Ref.12 and Refs.13-14 (a) The modulation strategy of Ref.12,(b) the modulation strategy of Refs.13-14
    The sketch map of the proposed FOVs modulation strategy (a) the FOV of one PIR is modulated by a mask, (b) ideally, the starting points of the FOVs of multiple PIRs are located at same point (Q), and the FOVs stagger and overlap with each other to form multiple SAs.
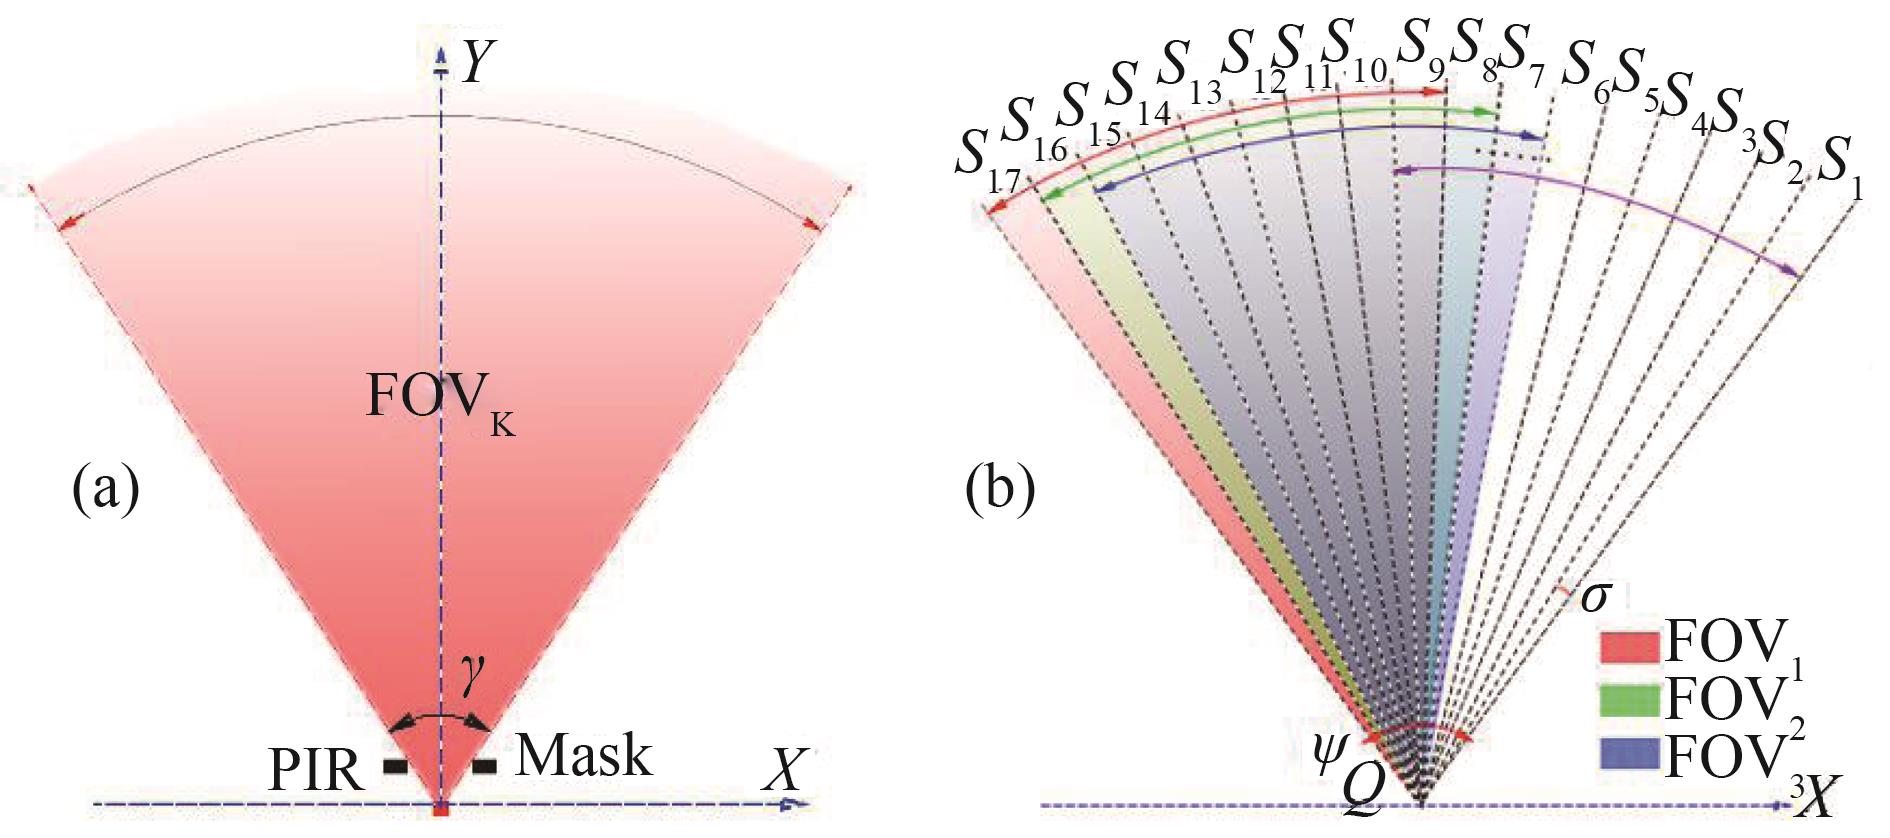
    Fig. 2. The sketch map of the proposed FOVs modulation strategy (a) the FOV of one PIR is modulated by a mask, (b) ideally, the starting points of the FOVs of multiple PIRs are located at same point (Q), and the FOVs stagger and overlap with each other to form multiple SAs.
    The physical map of the node, and the sketch map of the sampling areas in non-ideal case (a) The arrangement of PIRs, (b) the physical map of whole node, (c) the sketch map of the sampling areas of the node in non-ideal case
    Fig. 3. The physical map of the node, and the sketch map of the sampling areas in non-ideal case (a) The arrangement of PIRs, (b) the physical map of whole node, (c) the sketch map of the sampling areas of the node in non-ideal case
    Two nodes are used for human localization.
    Fig. 4. Two nodes are used for human localization.
    The error analysis of the two nodes human localization equipment (a) Plane diagram of error analysis, (b) 3D diagram of error analysis.
    Fig. 5. The error analysis of the two nodes human localization equipment (a) Plane diagram of error analysis, (b) 3D diagram of error analysis.
    The PIR states determined processes (a) the original signal, (b) denoise the signal by using wavelet soft threshold noise reduction method, (c) calculate the absolute values of the signal, (d) smoothing the signal, (e) set a threshold. If the amplitude of the signal larger than the threshold, set the amplitude to ‘1’, else to ‘0’, (f) further optimize the signal to determine the state of the PIR.
    Fig. 6. The PIR states determined processes (a) the original signal, (b) denoise the signal by using wavelet soft threshold noise reduction method, (c) calculate the absolute values of the signal, (d) smoothing the signal, (e) set a threshold. If the amplitude of the signal larger than the threshold, set the amplitude to ‘1’, else to ‘0’, (f) further optimize the signal to determine the state of the PIR.
    The pyroelectric infrared human localization node and the experiment result (a) the pyroelectric infrared human localization node, (b) the predefined route and estimated route.
    Fig. 7. The pyroelectric infrared human localization node and the experiment result (a) the pyroelectric infrared human localization node, (b) the predefined route and estimated route.
    ItemParameters
    Pass Band514 μm
    Transmittance of the filter>75%
    Sensitivity3 300 V/W
    Detectivity1.5×108 cm∙Hz1/2∙W-1
    Noise<200 mV (mVp-p, 25℃)
    Table 1. The parameters of the KP500B
    SAThe state of PIRSequence
    123456789
    1100000000100000000
    2110000000110000000
    3111000000111000000
    ………………
    15000000111000000111
    16000000011000000011
    17000000001000000001
    Table 2. The codes scheme of the 17-SAs.
    The Angular Bisectorxil (cm)yil (cm)
    A11, A12, A1(10), A1(11)300+3.40
    A13, A1(12)300+1.70
    A14, A15, A1(9), A1(13), A1(14)3000
    A16, A1(15)300-1.70
    A17, A18, A1(16), A1(17)300-3.40
    A21, A22, A2(10), A2(11)0300-3.4
    A23, A2(12)0300-1.7
    A24, A25, A29, A2(13), A2(14)0300
    A26, A2(15)0300+1.7
    A27, A28, A2(16), A2(17)0300+3.4
    Table 3. The intersection (xil,yil) of the angular bisector Ail and X axis or Y axis.
    No.Node-1Node-2Real /cmEstimation/cmError/cm
    r1S12~S11S6~S8(250,270)(254.6,266.6)8.09
    r2S10~S9S8~S9(290,290)(293.2,293.2)4.47
    r3S8~S7S9~S10(325,310)(329.0,308.1)4.42
    r4S7~S6S10~S11(365,335)(355.5,334.0)9.57
    r5S6~S5S11~S12(400,370)(392.0,364.9)9.44
    r6S5~S4S12~S13(425,400)(432.5,407.8)10.86
    r7S5~S4S13~S14(450,435)(444.4,444.4)10.94
    r8S4S14~S15(470,480)(479.7,493.8)16.91
    Table 4. The result of the experiment
    Qin-Qin WU, Xi-Cai LI, Yuan-Qing WANG, Shu-Ping REN. Human localization technology based on the pyroelectric infrared sensors[J]. Journal of Infrared and Millimeter Waves, 2020, 39(2): 228
    Download Citation