• Advanced Photonics Nexus
  • Vol. 2, Issue 1, 016007 (2023)
Francesco Hoch1, Taira Giordani1, Nicolò Spagnolo1, Andrea Crespi2、3, Roberto Osellame3, and Fabio Sciarrino1、*
Author Affiliations
  • 1Sapienza Università di Roma, Dipartimento di Fisica, Roma, Italy
  • 2Politecnico di Milano, Dipartimento di Fisica, Milano, Italy
  • 3Istituto di Fotonica e Nanotecnologie, Consiglio Nazionale delle Ricerche, Milano, Italy
  • show less
    DOI: 10.1117/1.APN.2.1.016007 Cite this Article Set citation alerts
    Francesco Hoch, Taira Giordani, Nicolò Spagnolo, Andrea Crespi, Roberto Osellame, Fabio Sciarrino. Characterization of multimode linear optical networks[J]. Advanced Photonics Nexus, 2023, 2(1): 016007 Copy Citation Text show less
    Reconstruction of multimode optical circuits. (a) Model of a multimode interferometer considered in this work. It is composed by the ideal optical circuit described by the unitary transformation U plus layers of mode-dependent losses at the input and at the output (represented by beam splitters) and phase instabilities (represented by sparks). Output losses take into account also possible differences in the detection efficiencies among the modes. (b) Scheme for the measurement of second-order cross-correlations Cijhk with coherent light emitted by a CW laser. The latter is coupled in single-mode fiber and split into two beams by an in-fiber beam splitter. The two beams enter the interferometer in modes h,k. The phase modulation φM performed by a liquid crystal compensates for the fiber phase fluctuations φ=φ1−φ2 to satisfy the conditions in Eq. (17). (c) The three-mode integrated chip employed to test the reconstruction algorithm. It is composed of a sequence of two tritter structures. Each tritter comprises three beam splitters, whose reflectivity is reported in this figure, and a phase-shift equal to π/2. Between the two tritters, there are three heaters {R1,R2,R3} that dynamically control the optical phases between the two structures via the thermo-optic effect.
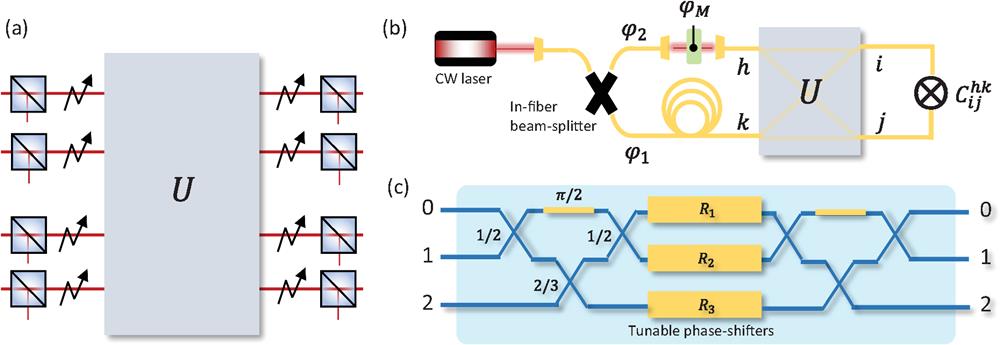
    Fig. 1. Reconstruction of multimode optical circuits. (a) Model of a multimode interferometer considered in this work. It is composed by the ideal optical circuit described by the unitary transformation U plus layers of mode-dependent losses at the input and at the output (represented by beam splitters) and phase instabilities (represented by sparks). Output losses take into account also possible differences in the detection efficiencies among the modes. (b) Scheme for the measurement of second-order cross-correlations Cijhk with coherent light emitted by a CW laser. The latter is coupled in single-mode fiber and split into two beams by an in-fiber beam splitter. The two beams enter the interferometer in modes h,k. The phase modulation φM performed by a liquid crystal compensates for the fiber phase fluctuations φ=φ1φ2 to satisfy the conditions in Eq. (17). (c) The three-mode integrated chip employed to test the reconstruction algorithm. It is composed of a sequence of two tritter structures. Each tritter comprises three beam splitters, whose reflectivity is reported in this figure, and a phase-shift equal to π/2. Between the two tritters, there are three heaters {R1,R2,R3} that dynamically control the optical phases between the two structures via the thermo-optic effect.
    Losses and moduli estimation. We show the results of the Sinhkorn- and variance minimization-based algorithms. First, we compare the matrix of the field intensities M (a) with the matrix P after the application of the Sinkhorn’s algorithm (b). (c) We report the output intensity distribution at the three output ports when the laser is injected in the first input for different values of the electrical powers dissipated in the resistor R1. Red points correspond to the sum of the three intensities in the outputs (blue, output port 0; orange, output port 1; and green, output port 2). (d) We report the distribution P→ and the sum after the application of the variance minimization algorithm. The error bars reported in (c) correspond to the precision of the field intensity measurements performed by a power meter. They are propagated to estimate the error of the sum. The error bars in (d) are the result of a Monte Carlo approach applied to the reconstruction algorithm.
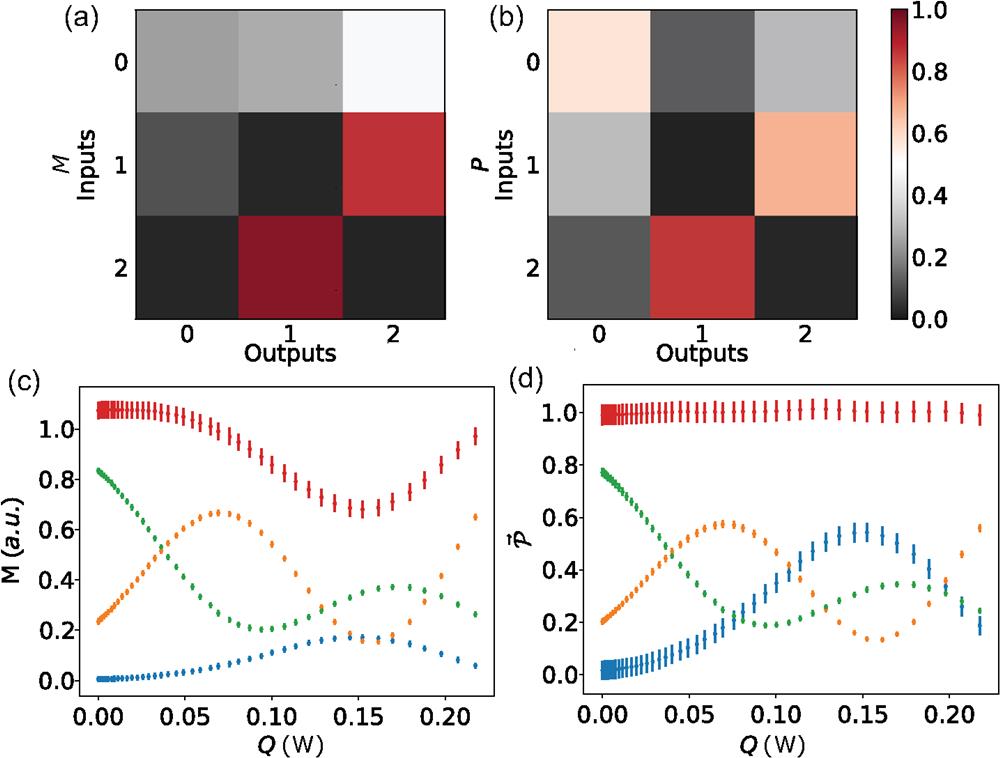
    Fig. 2. Losses and moduli estimation. We show the results of the Sinhkorn- and variance minimization-based algorithms. First, we compare the matrix of the field intensities M (a) with the matrix P after the application of the Sinkhorn’s algorithm (b). (c) We report the output intensity distribution at the three output ports when the laser is injected in the first input for different values of the electrical powers dissipated in the resistor R1. Red points correspond to the sum of the three intensities in the outputs (blue, output port 0; orange, output port 1; and green, output port 2). (d) We report the distribution P and the sum after the application of the variance minimization algorithm. The error bars reported in (c) correspond to the precision of the field intensity measurements performed by a power meter. They are propagated to estimate the error of the sum. The error bars in (d) are the result of a Monte Carlo approach applied to the reconstruction algorithm.
    Cross-correlation measurements. We report the measurement of the normalized cross-correlations Cijhk for different pairs of outputs, entering from (h,k)=(0,1). In particular, we measure the pairs (a) (0,1), (b) (0, 2), and (c) (1, 2). We report the experimental correlations for different configurations of the dissipated electrical power in the heater R1 as in red. The predictions according to the results of a white-box fit that makes use of the structure of the interferometer and the previous measurements of the matrix moduli as in blue. The two independent estimations are in good agreement within one standard deviation of the experimental error.
    Fig. 3. Cross-correlation measurements. We report the measurement of the normalized cross-correlations Cijhk for different pairs of outputs, entering from (h,k)=(0,1). In particular, we measure the pairs (a) (0,1), (b) (0, 2), and (c) (1, 2). We report the experimental correlations for different configurations of the dissipated electrical power in the heater R1 as in red. The predictions according to the results of a white-box fit that makes use of the structure of the interferometer and the previous measurements of the matrix moduli as in blue. The two independent estimations are in good agreement within one standard deviation of the experimental error.
    Francesco Hoch, Taira Giordani, Nicolò Spagnolo, Andrea Crespi, Roberto Osellame, Fabio Sciarrino. Characterization of multimode linear optical networks[J]. Advanced Photonics Nexus, 2023, 2(1): 016007
    Download Citation