Abstract
Temperature-dependent photoluminescence (PL) of phase-separated InGaN quantum wells is investigated over a broader excitation power range. With increasing excitation power from 0.5 μW to 50 mW, the In-rich quasi-quantum dot (QD)-related PL peak disappears at about 3 mW, while temperature behavior of the InGaN matrix-related PL peak energy (linewidth) gradually evolves from a strong “S-shaped” (“W-shaped”) temperature dependence into a weak “S-shaped” (an approximately “V-shaped”), until becoming an inverted “V-shaped” (a monotonically increasing) temperature dependence. This indicates that, with increasing excitation power, the carrier localization effect is gradually reduced and the QD-related transition is submerged by the significantly enhanced InGaN matrix-related transition, while the carrier thermalization effect gradually increases to become predominant at high excitation powers.InGaN and related heterostructures are attracting much interest due to potential applicability in optoelectronics as light emitting diodes (LEDs) and laser diodes (LDs)[1–6]. In most LEDs and LDs, in the visible range, InGaN/GaN quantum well (QW) structures are used as the active layers. However, due to the large lattice mismatch between InN and GaN, their low miscibility leads to indium aggregation and phase separation[7,8]. It has been proposed that spontaneous spinodal decomposition produces quasi-quantum dot (QD) structures around the designated InGaN QW layers[9,10]. In such a structure, these In-rich QDs provide deep potential levels to suppress the outflow of carriers toward surrounding nonradiative centers, such as dislocations or point defects. Although the In-rich related emissions have been widely investigated, the carrier dynamics and transfer processes related to the low indium content InGaN matrix, and to high indium content QDs, are still not clearly understood[11].
This research investigated the growth of an InGaN/GaN multiple quantum well (MQW) blue-light-emitting structure. The microstructure of the sample was analyzed by high-resolution transmission electron microscopy (HRTEM), while its optical behavior is studied in detail by photoluminescence (PL). Two InGaN-related emission peaks observed in the full PL spectrum were assigned to the QDs and the InGaN matrix, due to a strong phase separation as confirmed by HRTEM. A Gaussian fit of the individual spectra was used to determine the linewidth, peak position, and integrated intensity of the InGaN matrix-related emission. The QD-related emission component can be obtained by subtracting the InGaN matrix-related emission component from the total emission.
The InGaN/GaN MQWs were grown on a c-plane sapphire substrate using metalorganic chemical vapor deposition (MOCVD). The precursors of Ga, In, N, and Si were trimethylgallium (TMGa), trimethylindium (TMIn), ammonia (), and silane (), respectively. The QWs were grown under an atmosphere after growth of a 1.5 μm-thick undoped GaN buffer layer and a 2.5 μm-thick Si-doped GaN layer. The active region consisted of eight QWs with 3 nm-thick InGaN wells and 14 nm-thick GaN barriers. The indium content of the active region was about 15%.
Sign up for Chinese Optics Letters TOC. Get the latest issue of Chinese Optics Letters delivered right to you!Sign up now
The microstructural properties of the sample were analyzed by HRTEM. For temperature and excitation power-dependent PL measurements, the sample was mounted in a closed-cycle He cryostat and the temperature was controlled over the range of 6 to 300 K. A 405 nm (3.06 eV) cw semiconductor laser was used as an excitation light source with a spot size of approximately 200 μm, and the excitation power was varied from 0.5 μW to 50 mW. The photogenerated carriers were excited and recombined in the active MQWs only since the excitation energy was below the bandgap energy (3.42 eV) of GaN. The PL signal from the sample was dispersed by a Jobin–Yvon iHR320 monochromator and detected by a thermoelectrical cooled Synapse CCD detector.
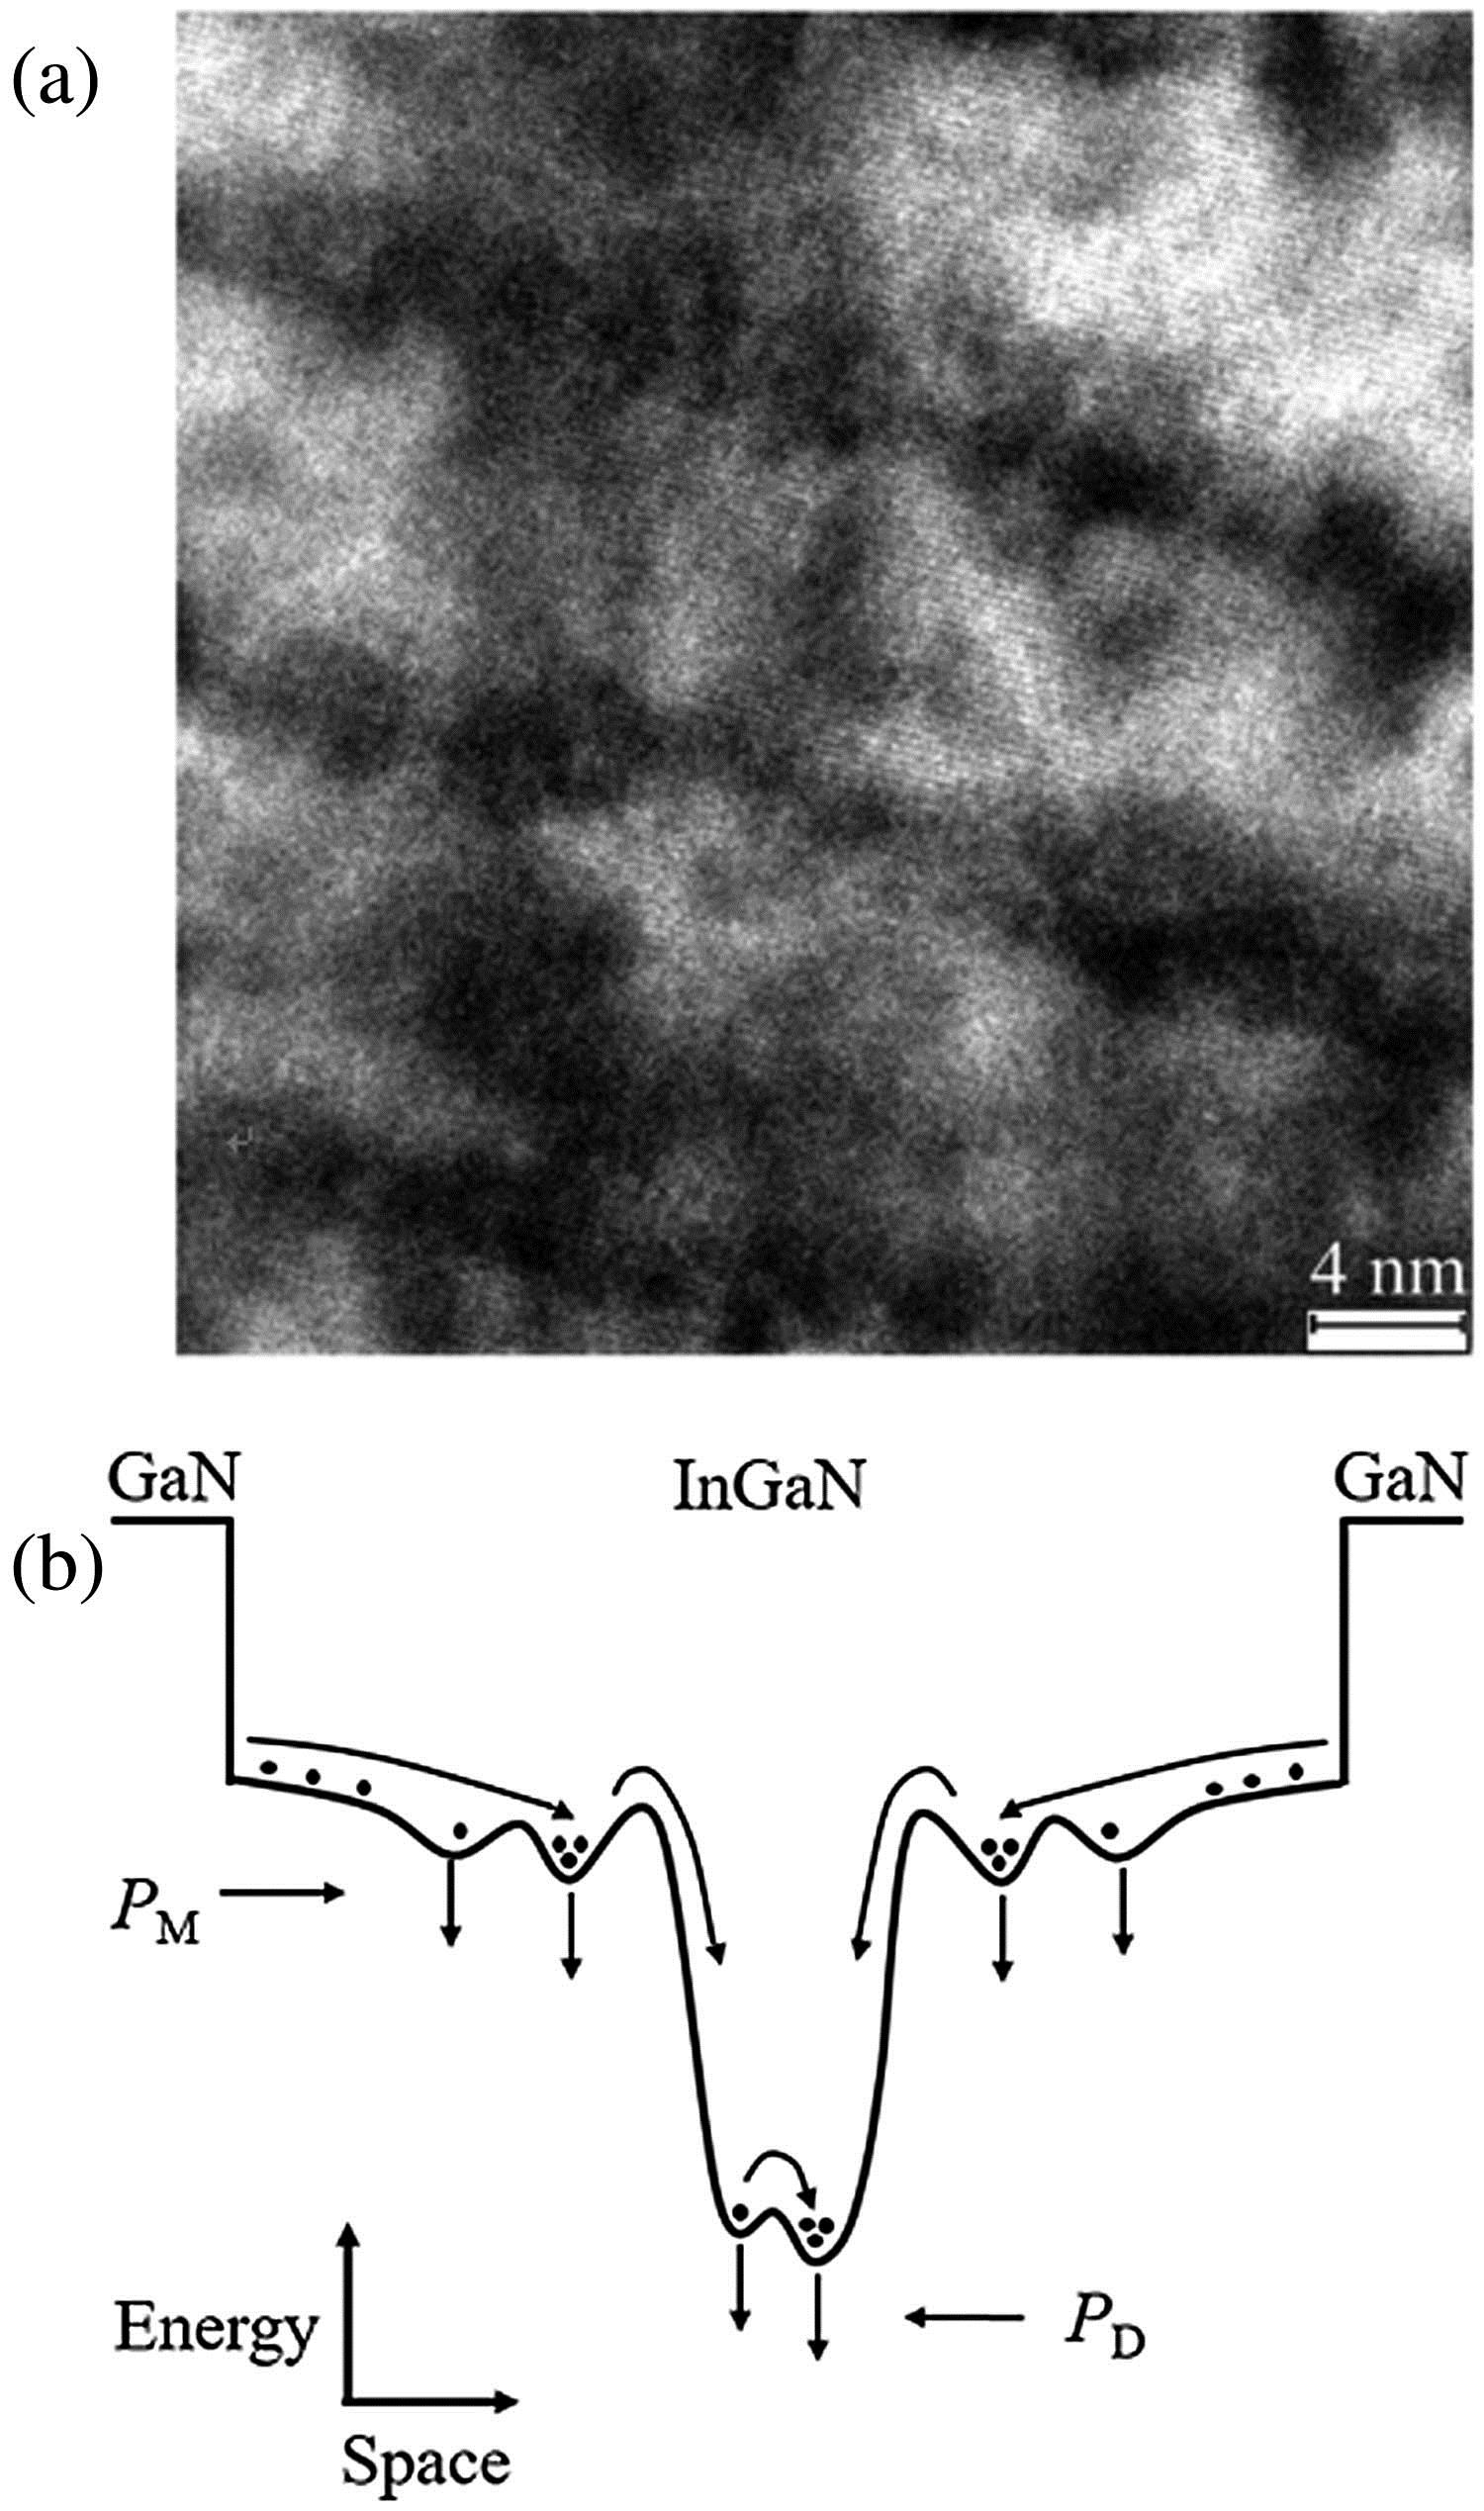
Figure 1(a) shows a typical cross-sectional HRTEM image of the sample. The barriers and wells in the MQW can be distinguished by the fluctuations in indium composition. In addition, there was a uniform distribution of areas with strong black and white contrast inside the wells, implying a high strain, which may have arisen from coherent interfaces between the In-rich QDs and the surrounding InGaN matrix. Figure 1(b) shows a schematic diagram of the potential distribution in the InGaN/GaN MQWs for describing possible paths of carrier transfer.

Figure 1.(a) Cross-sectional HRTEM image of the InGaN/GaN MQWs sample and (b) schematic diagram of the potential distribution in the InGaN/GaN MQWs for describing possible paths of carrier transfer.
Figure 2(a) shows the temperature-dependent PL spectra of the sample measured from 6 to 300 K at the lowest excitation power of 0.5 μW. At 6 K, only one main peak at 2.66 eV was observed, which was attributed to the InGaN matrix-related near-band-edge transition (denoted by ). As the temperature was increased from 6 to 300 K, a new broad peak centered at approximately 2.42 eV began to appear at approximately 30 K; its intensity increased with increasing temperature until approximately 100 K and then decreased as the temperature further increased. The new broad peak was attributed to the In-rich QD-related transition (denoted by ), due to a strong phase separation as observed by HRTEM in Fig. 1(a). When the excitation power was gradually raised in the low excitation power range (below about 3 mW), the temperature-dependent behavior of the PL spectra was similar to that obtained at 0.5 μW [see Fig. 2(a)], except that the intensity gradually decreased relative to the intensity. However, when the excitation power is further raised to approximately 3 mW and more, the broad peak disappeared over the entire temperature range; this was attributed to the saturation of the QD-related transition due to the small density of the QD states in the blue InGaN/GaN MQWs and the significant enhancement of the InGaN matrix-related transition due to its large density of states and the partial screening of the quantum-confined Stark effect (QCSE) at high excitation powers[2,9], thus resulting in that the weak peak was submerged by the strong peak and its phonon replicas. Figure 2(b) shows the typical temperature-dependent PL spectra of the sample measured at the highest excitation power of 50 mW, where only one main peak was observed in the full PL spectra. To understand further the transfer process of the carriers inside these two phase-separated structures, typical integrated intensities, peak energies, and linewidths of the and emissions at the lowest (0.5 μW), critical (3 mW), and highest (50 mW) excitation powers in this study, as a function of temperature, were respectively investigated.
Figure 2.Temperature-dependent PL spectra of InGaN/GaN MQWs measured at (a) 0.5 μW and (b) 50 mW. The dashed lines indicate the separate InGaN matrix- and QD-related lines. Two weak peaks, denoted by 1LO and 2LO, are phonon replicas of the main peak.
Figure 3(a) shows the temperature dependences of the integrated intensities of the emission , emission , and their total emission ( at 0.5 μW. As seen in Figs. 2(a) and 3(a), with increasing temperature (below about 80 K), rapidly decreased accompanied by a rapid increase of , while showed a slight increase. The temperature behaviors of and were “V-shaped” (decrease-increase) and inverted “V-shaped” (increase-decrease), respectively. This behavior can be explained by the fact that, with increasing temperature in the low temperature range, the mobility of photogenerated carriers is gradually enhanced due to a gain in kinetic energy[12,13]. As a result, the carriers have a greater opportunity to transfer from the InGaN matrix to the QDs, thus leading to the rapid increase of and the rapid decrease of . The slight increase of was attributed to the QDs providing deep potential levels to enhance the radiative recombination rate. As the temperature was further increased above approximately 80 K, nonradiative recombination became more important and dominated the recombination process of the InGaN matrix above approximately 130 K, causing a suppression of the carrier transfer from the InGaN matrix into the QDs due to the reduced nonradiative lifetime[14]. As a result, the number of carriers in the InGaN matrix increased due to the suppression of the carrier transfer. In other words, as the temperature was further increased above approximately 130 K, the carriers that have relaxed down to the QDs have the ability to outflow by overcoming their confinement barriers due to the significantly broadening of the linewidth, as shown in Fig. 3(c), thus leading to an increase in the number of carriers in the InGaN matrix. This compensated for the decreased PL efficiency resulting from the increased nonradiative recombination. Hence, the significant decrease of , the slight increase of , and the significant decrease of are observed in the high temperature range in Fig. 3(a).
Figure 3.Temperature dependencies of (a) the emission integrated intensity (, , and ), and the peak energy and full width at half maximum (FWHM) for (b) peak and for (c) peak measured at 0.5 μW. The dashed lines represent Varshni curves.
Figures 3(b) and 3(c) show the temperature dependencies of the peak positions and linewidths of and at 0.5 μW, respectively. As shown in Fig. 3(b), the anomalous temperature behaviors of are seen to be “S-shaped” (decrease-increase-decrease) for the peak position and “W-shaped” (decrease-increase-decrease-increase) for the peak linewidth[12–15], which was attributed to the potential inhomogeneity and localized character of the carrier recombination due to the slight composition fluctuation in the InGaN matrix. With increasing temperature from 6 to 300 K, the peak position first redshifted below about 60 K, corresponding to a maximum of the localization energy, since the localized carriers are thermally activated and relax down into other strongly localized states via hopping and reach a saturated redistribution[16–18]. Then, it blueshifted until the full-delocalization temperature of about 160 K due to the thermal broadening effect of the carriers in the localized states in the InGaN matrix. Above 160 K, it started redshifting again, up to 300 K, due to the regular thermalization of the carriers. Corresponding to the aforementioned process, the linewidth first decreased slowly below approximately 30 K, due to the aforementioned relaxation of the carriers in the InGaN matrix, and then it increased significantly up to a temperature of approximately 60 K, representing a crossover from a nonthermalized to a thermalized energy distribution of localized carriers in that temperature range. Above 60 K, it decreased until about 130 K, due to the fact that when further increasing the temperature above 60 K, even the most localized carriers became progressively mobile. Finally, it increased again up to 300 K, due to the regular thermalization of the carriers.
In contrast, the temperature dependence of , as shown in Fig. 3(c), indicated that the peak position redshifted by 156 meV as the temperature increased from 30 to 250 K, which was about six times as large as the expected bandgap shrinkage of 27 meV over this temperature range obtained by Varshni’s equation [16], with and . The pronounced redshift of the peak relative to the Varshni curve (dashed line) was mainly attributed to the relaxation of the carriers inside the QDs, indicating the strong potential inhomogeneity and localized character of the carrier recombination inside the QDs[17,18]. Corresponding to the aforementioned process, the linewidth showed an “N-shaped” (increase-decrease-increase) temperature dependence, as shown in Fig. 3(c). With increasing temperature, the linewidth first increased below about 70 K, then decreased until about 160 K, and finally increased again up to 300 K. However, surprisingly, the initial increase of the temperature-dependent linewidth in the temperature range below about 70 K seemed to be in contradiction with the expected experimental result whereby increasing temperature should make the linewidth decrease monotonically due to relaxation of the carriers inside the QDs from higher to lower localized states[15,19]. In fact, together with the aforementioned temperature dependencies of and , as discussed in Fig. 3(a), the anomalous temperature-dependent behavior of the linewidth can be explained as follows: with increasing temperature, below about 70 K, besides the temperature-dependent relaxation effect of the carriers inside the QDs from higher to lower localized states, the band-filling effect of the carriers from the InGaN matrix into the QDs was involved in the radiative recombination process of the QDs, inducing the increase in linewidth. With further increasing temperature above about 70 K, the aforementioned band-filling effect of the carriers became less significant due to the reduced nonradiative lifetime, and the relaxation effect of the carriers inside the QDs once again dominated the recombination process, leading to a decreased linewidth below 160 K. After about 160 K, the temperature-dependent relaxation effect of the carriers inside the QDs gradually diminished, while the temperature-dependent thermal broadening effect of the carriers was gradually enhanced, resulting in an increased linewidth up to 300 K, in agreement with an observed slight blueshift of the peak relative to the Varshni curve above about 200 K, as shown in Fig. 3(c).
Figures 4(a) and 4(b) show the temperature dependencies of the integrated intensity, peak energy, and linewidth of at the critical excitation power of 3 mW. Figures 3(b) and 4(b) show that with increasing excitation power from 0.5 μW to 3 mW the temperature dependence of the peak energy, as a function of the excitation power, gradually evolves from a strong “S-shaped” into a weak “S-shaped” temperature dependence, while that of the peak linewidth gradually evolved from a strong “W-shaped” into an approximately “V-shaped” temperature dependence. The behaviors indicate a reduced localization effect of the InGaN matrix at 3 mW compared with at 0.5 μW, due to the localized states in the InGaN matrix being further filled with increasing excitation power[15]. Also, in contrast to the case at 0.5 μW, at 3 mW, slightly increased below about 30 K and then decreased up to 300 K with increasing temperature, as shown in Fig. 4(a). The former was attributed to suppression of the carriers transferring from the InGaN matrix into the QDs due to the saturation of the QD-related transition, and to relaxation of the carriers in the InGaN matrix from higher to lower localized states; the latter was due to the thermalization of the carriers in the InGaN matrix, including a thermal broadening of the localized carriers followed by the regular thermalization of the free carriers with increasing temperature. It was in agreement with the aforementioned temperature dependences of the peak energy and linewidth.
Figure 4.Temperature dependences of (a) measured at 3 and 50 mW, and peak energy and FWHM measured at (b) 3 and (c) 50 mW. The dashed lines represent Varshni curves.
However, when the excitation power was raised to 50 mW, as shown in Figs. 4(a) and 4(c), both the peak energy and intensity exhibited an inverted “V-shaped” temperature dependence accompanied by a monotonic increase in linewidth with increasing temperature from 6 to 300 K. That is, with increasing temperature from 6 to 300 K, first exhibited a slight increase in the peak energy (intensity) below about 130 K (50 K), and then a monotonic decrease in both peak energy and intensity, while its linewidth monotonically increased over the entire temperature range. The disappearance of the S- and W-shaped temperature dependencies for the peak energy and linewidth at 50 mW reflected the fact that the relaxation process of the carriers in the InGaN matrix was suppressed by the complete saturation of the localized centers in the InGaN matrix due to the high density of the photogenerated carriers at 50 mW; instead, the recombination process of the MQWs was first dominated by the thermal broadening of the carriers inside the localized states in the InGaN matrix below about 130 K, and then by the regular thermalization of the free carriers in the InGaN up to 300 K. However, the reason for the slight increase of with increasing temperature below about 50 K, as shown in Fig. 4(a), was not clear. It might have been due to the partial screening of QCSE induced thermally[20]. In fact, many carriers that were frozen out in nonradiative centers and were located in high-energetic localized centers at low temperature would become thermally activated as the temperature increased, inducing some partial Coulomb screening of the QCSE.
Moreover, the reduction of the localization effect of the carriers in the InGaN matrix with increasing excitation power from 0.5 μW to 50 mW, could also be ascertained from the deviation between experimental data and Varshni’s equation, as shown in Figs. 3(b), 4(b), and 4(c), since the depths of the localized states for the excitation powers of 0.5 μW, 3 mW, and 50 mW, are estimated to be approximately 53, 27, and 15 meV, respectively. Although beyond the scope of this study, it was expected that, when the excitation power is large enough, the localization effect will vanish and the temperature behavior of the peak energy will closely follow Varshni’s law. That is, the regular thermalization of the carriers in the InGaN matrix would dominate the emission process of the MQWs over the whole temperature range.
In conclusion, the carrier transfer and recombination mechanism of the MOCVD-grown InGaN/GaN MQWs is investigated. At excitation powers below 3 mW, the InGaN matrix-related emission and the In-rich QDs-related emission are observed in the full PL spectrum due to strong phase separation, as confirmed by HRTEM. The temperature-dependent behavior of peaks and at 0.5 μW indicates that the recombination process of the MQWs contains not only the carrier relaxation process followed by the carrier thermalization process inside individual components of the phase structure with increasing temperature, but also the carrier transfer process between these two phase-separated structures. With increasing excitation power (from 0.5 μW to 50 mW), the peak disappeares at about 3 mW, while the temperature behavior of the peak energy (linewidth) gradually evolves from a strong “S-shaped” (“W-shaped”) temperature dependence into a weak “S-shaped” (an approximately “V-shaped”) relationship, until becoming an inverted “V-shaped” (a monotonically increasing) temperature dependence. This indicates that with increasing excitation power the carrier localization effect gradually reduces and the QD-related transition is submerged by the significantly enhanced InGaN matrix-related transition, while the carrier thermalization effect is gradually enhanced and became predominant at high excitation powers. The experimental results are expected to provide useful guidance for the fabrication of high-performance blue or green LEDs and LDs with high-quantum efficiency.
References
[1] S. Nakamura, S. Pearton, G. Fasol. The Blue Laser Diode(2000).
[2] S. M. Thahab, H. Abu Hassan, Z. Hassan. Chin. Opt. Lett., 7, 226(2009).
[3] J. Chen, G. Fan, W. Pang, S. Zheng, Y. Zhang. Chin. Opt. Lett., 10, 062302(2012).
[4] T. Jiang, X. Yu, X. Xu, H. Yu, D. Zhou, J. Qiu. Chin. Opt. Lett., 12, 011601(2014).
[5] P. F. Zhu, N. Tansu. Photon. Res., 3, 184(2015).
[6] G. F. Yang, P. Chen, S. M. Gao, G. Q. Chen, R. Zhang, Y. D. Zheng. Photon. Res., 4, 17(2016).
[7] S. Chichibu, T. Sota, K. Wada, S. Nakamura. J. Vac. Sci. Technol. B, 16, 2204(1998).
[8] A. Hangleiter, F. Hitzel, C. Netzel, D. Fuhrmann, U. Rossow, G. Ade, P. Hinze. Phys. Rev. Lett., 95, 127402(2005).
[9] M. Sénès, K. L. Smith, T. M. Smeeton, S. E. Hooper, J. Heffernan. Phys. Rev. B, 75, 045314(2007).
[10] S. Y. Karpov. Phys. Status Solidi RRL, 4, 320(2010).
[11] H. P. Zhao, R. A. Arif, N. Tansu. IEEE J. Sel. Top. Quantum Electron., 15, 1104(2009).
[12] P. G. Eliseev, P. Perlin, J. Lee, M. Osiński. Appl. Phys. Lett., 71, 569(1997).
[13] S. D. Baranovskii, R. Eichmann, P. Thomas. Phys. Rev. B, 58, 13081(1998).
[14] Y.-H. Cho, G. H. Gainer, A. J. Fischer, J. J. Song, S. Keller, U. K. Mishra, S. P. DenBaars. Appl. Phys. Lett., 73, 1370(1998).
[15] H. N. Wang, Z. W. Ji, S. Qu, G. Wang, Y. Z. Jiang, B. L. Liu, X. G. Xu, H. Mino. Opt. Express, 20, 3932(2012).
[16] Y. P. Varshni. Physica, 34, 149(1967).
[17] Ž. Gačević, A. Das, J. Teubert, Y. Kotsar, P. K. Kandaswamy, T. H. Kehagias, T. Koukoula, P. H. Komninou, E. Monroy. J. Appl. Phys., 109, 103501(2011).
[18] J. Renard, P. K. Kandaswamy, E. Monroy, B. Gayral. Appl. Phys. Lett., 95, 131903(2009).
[19] F. Wang, Z. W. Ji, Q. Wang, X. S. Wang, S. Qu, X. G. Xu, Y. J. Lv, Z. H. Feng. J. Appl. Phys., 114, 163525(2013).
[20] P. Riblet, H. Hirayama, A. Kinoshita, A. Hirata, T. Sugano, Y. Aoyagi. Appl. Phys. Lett., 75, 2241(1999).