• Photonics Research
  • Vol. 9, Issue 10, 2016 (2021)
Mikko Partanen1、2、*, Hyeonwoo Lee1, and Kyunghwan Oh1、3
Author Affiliations
  • 1Photonic Device Physics Laboratory, Department of Physics, Yonsei University, Seoul 03722, Republic of Korea
  • 2Photonics Group, Department of Electronics and Nanoengineering, Aalto University, 00076 Aalto, Finland
  • 3e-mail: koh@yonsei.ac.kr
  • show less
    DOI: 10.1364/PRJ.433995 Cite this Article Set citation alerts
    Mikko Partanen, Hyeonwoo Lee, Kyunghwan Oh. Quantitative in situ measurement of optical force along a strand of cleaved silica optical fiber induced by the light guided therewithin[J]. Photonics Research, 2021, 9(10): 2016 Copy Citation Text show less
    (a) Mechanical oscillator was driven by optical interface forces Finterface and tensions Ftension of the four fibers, where the laser was propagating. These forces, illustrated for one of the fibers, were modulated by varying the laser intensity. The laser generated by a multimode laser diode was split into the four fibers by a 1×4 splitter, and the laser exited from the ends of the four fibers, which were all bonded to the oscillator. The wavelength was either at 808 nm or 915 nm. (b) The cross section of the 0.22 NA multimode fiber (Thorlabs, FG105LCA). (c) The nanoscale oscillation was detected by the Michelson interferometer utilizing a separate He–Ne laser. See Appendix A for a more detailed description of the experimental setup.
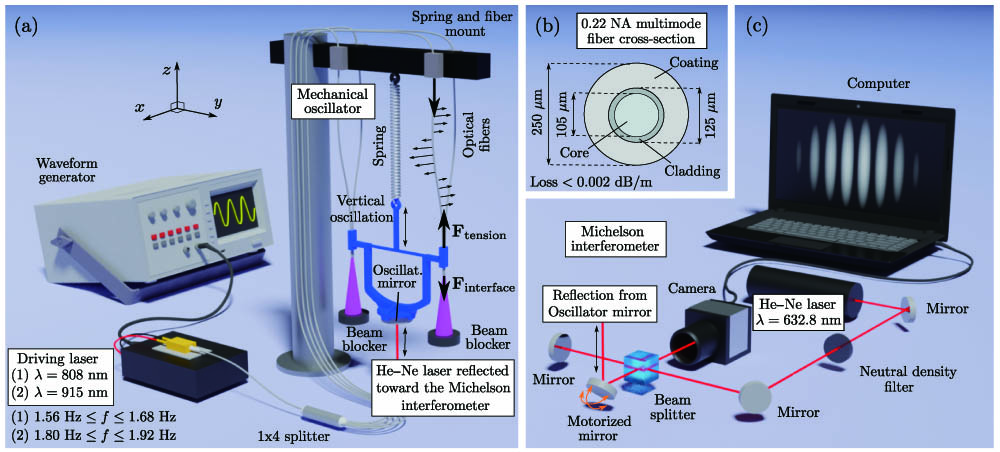
    Fig. 1. (a) Mechanical oscillator was driven by optical interface forces Finterface and tensions Ftension of the four fibers, where the laser was propagating. These forces, illustrated for one of the fibers, were modulated by varying the laser intensity. The laser generated by a multimode laser diode was split into the four fibers by a 1×4 splitter, and the laser exited from the ends of the four fibers, which were all bonded to the oscillator. The wavelength was either at 808 nm or 915 nm. (b) The cross section of the 0.22 NA multimode fiber (Thorlabs, FG105LCA). (c) The nanoscale oscillation was detected by the Michelson interferometer utilizing a separate He–Ne laser. See Appendix A for a more detailed description of the experimental setup.
    Displacement amplitude of the mechanical oscillator is plotted as a function of the laser modulation frequency (a) for the first oscillator at the wavelength of 808 nm and (b) for the second oscillator at the wavelength of 915 nm. The net peak-to-peak power amplitude of the driving field in the four fibers together is P0=5.125 W in both cases. The solid line represents the averaged frequency spectrum measured with a single modulation frequency. The peak at each modulation frequency is marked with a red dot. The oscillator response function is fitted and shown by the dashed line. The corresponding peak-to-peak force amplitudes of the two oscillators are plotted in (c) and (d) as a function of the peak-to-peak laser power amplitude of the fibers. The solid lines represent the regression lines and the dashed lines show the net theoretical force in Eq. (3). The dashed-dotted and dotted lines are the results of the Minkowski (FM,0) and Abraham (FA,0) momentum models, respectively, using Eq. (1) with the corresponding momentum of light and excluding the tension in Eq. (2).
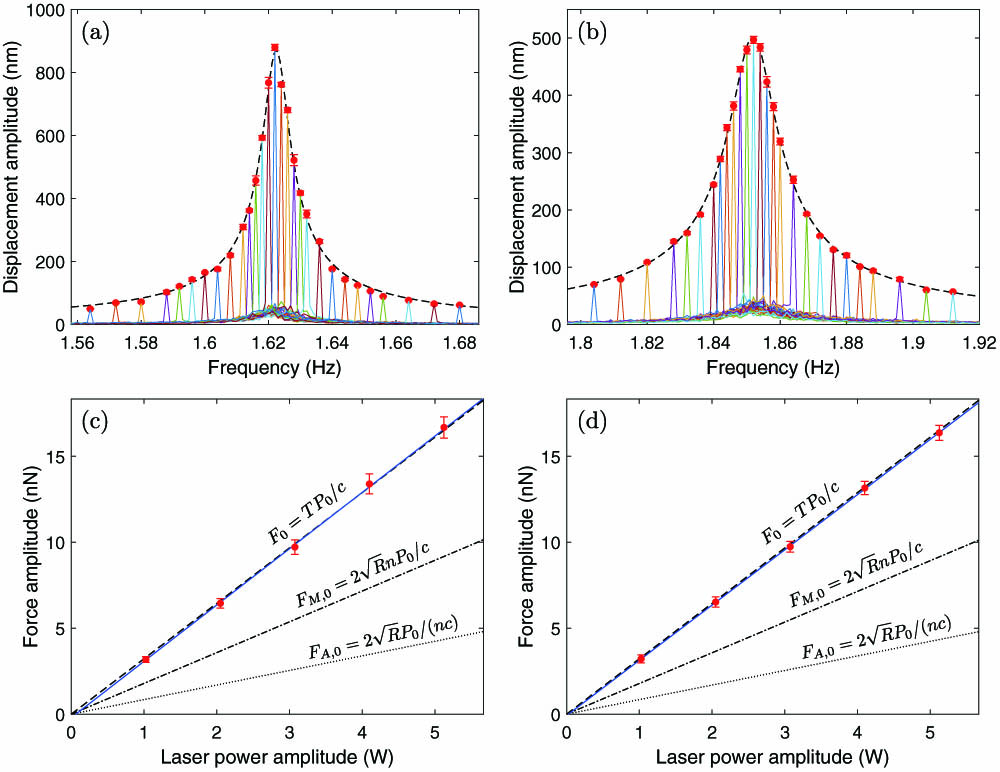
    Fig. 2. Displacement amplitude of the mechanical oscillator is plotted as a function of the laser modulation frequency (a) for the first oscillator at the wavelength of 808 nm and (b) for the second oscillator at the wavelength of 915 nm. The net peak-to-peak power amplitude of the driving field in the four fibers together is P0=5.125  W in both cases. The solid line represents the averaged frequency spectrum measured with a single modulation frequency. The peak at each modulation frequency is marked with a red dot. The oscillator response function is fitted and shown by the dashed line. The corresponding peak-to-peak force amplitudes of the two oscillators are plotted in (c) and (d) as a function of the peak-to-peak laser power amplitude of the fibers. The solid lines represent the regression lines and the dashed lines show the net theoretical force in Eq. (3). The dashed-dotted and dotted lines are the results of the Minkowski (FM,0) and Abraham (FA,0) momentum models, respectively, using Eq. (1) with the corresponding momentum of light and excluding the tension in Eq. (2).
    Illustration of the fiber path and the related horizontal and vertical distance parameters a and h.
    Fig. 3. Illustration of the fiber path and the related horizontal and vertical distance parameters a and h.
    Elasticity theory simulation of the total tension force of four fibers on the oscillator as a function of the total incident optical power propagating through the fibers. The dots represent the simulation results obtained by using the expression on the left-hand side of Eq. (2), and the dashed line is the theoretical line, given on the right-hand side of Eq. (2).
    Fig. 4. Elasticity theory simulation of the total tension force of four fibers on the oscillator as a function of the total incident optical power propagating through the fibers. The dots represent the simulation results obtained by using the expression on the left-hand side of Eq. (2), and the dashed line is the theoretical line, given on the right-hand side of Eq. (2).
    Mikko Partanen, Hyeonwoo Lee, Kyunghwan Oh. Quantitative in situ measurement of optical force along a strand of cleaved silica optical fiber induced by the light guided therewithin[J]. Photonics Research, 2021, 9(10): 2016
    Download Citation