• Photonics Research
  • Vol. 9, Issue 10, 2016 (2021)
Mikko Partanen1、2、*, Hyeonwoo Lee1, and Kyunghwan Oh1、3
Author Affiliations
  • 1Photonic Device Physics Laboratory, Department of Physics, Yonsei University, Seoul 03722, Republic of Korea
  • 2Photonics Group, Department of Electronics and Nanoengineering, Aalto University, 00076 Aalto, Finland
  • 3e-mail: koh@yonsei.ac.kr
  • show less
    DOI: 10.1364/PRJ.433995 Cite this Article Set citation alerts
    Mikko Partanen, Hyeonwoo Lee, Kyunghwan Oh. Quantitative in situ measurement of optical force along a strand of cleaved silica optical fiber induced by the light guided therewithin[J]. Photonics Research, 2021, 9(10): 2016 Copy Citation Text show less

    Abstract

    We propose an optomechanical system to quantify the net force on a strand of cleaved silica optical fiber in situ as the laser light is being guided through it. Four strands of the fiber were bonded to both sides of a macroscopic oscillator, whose movements were accurately monitored by a Michelson interferometer. The laser light was propagating with variable optical powers and frequency modulations. Experimentally, we discovered that the driving force for the oscillator consisted of not only the optical force of the light exiting from the cleaved facets but also the tension along the fiber induced by the light guided therewithin. The net driving force was determined only by the optical power, refractive index of the fiber, and the speed of light, which pinpoints its fundamental origin.

    1. INTRODUCTION

    In optomechanics, the motion of mechanical resonators is typically controlled by using laser light reflected from a mirror [17]. Therefore, the optical force that drives these mechanical resonators is the well-known radiation pressure of light incident from free space. However, light can also exert forces while it is propagating inside materials, and in particular, when it is crossing material interfaces. Mostly, these forms of optical forces are studied in liquids by observing the deformation or movement of liquid surfaces under optical excitation [813]. There also exist measurements of the steady-state radiation pressure on mirrors immersed in liquids [14,15]. Experiments on the forces of light in lossless solids have been very scarce and rather qualitative or hindered by the lossy nature of solids [1623]. From literature, one can conclude that previous works have used neither mechanical resonators nor optical fibers to quantitatively measure optical forces inside materials. This is surprising and calls for a change since optical forces have an important role, e.g.,  in whispering gallery mode resonators [24,25] and as a source of cross talk in multi-core fibers [26].

    Among solid dielectric media, silica optical fiber is considered to be de facto the lowest-loss medium with the highest uniformity along its length [27], yet the forces of light carried by the optical fiber have not been quantified in experiments yet. In this work, we propose a macroscopic oscillator platform to interferometrically quantify the forces of light, which is being guided through a silica optical fiber for the first time to the best knowledge of the authors. We used cleaved optical fiber strands bonded to a macroscopic oscillator to make the light propagating through the optical fiber the only driving force of the oscillator. Our platform is schematically illustrated in Fig. 1. A 3D printed mass was suspended by a spring at the center and, on both sides, the cleaved optical fibers were glued. Our experiment leaves no room for different interpretations of the origin of the oscillator signal but the forces of light propagating through the optical fibers. In particular, heating effects, whose consequences in many prior cases have dominated over the optical momentum transfer, are negligible, because light propagating inside a commercial multimode optical fiber of less than a meter experiences a loss less than 0.002 dB. Thermal effects are also hindered by the large thermal time constant of the macroscopic oscillator [4,28].

    (a) Mechanical oscillator was driven by optical interface forces Finterface and tensions Ftension of the four fibers, where the laser was propagating. These forces, illustrated for one of the fibers, were modulated by varying the laser intensity. The laser generated by a multimode laser diode was split into the four fibers by a 1×4 splitter, and the laser exited from the ends of the four fibers, which were all bonded to the oscillator. The wavelength was either at 808 nm or 915 nm. (b) The cross section of the 0.22 NA multimode fiber (Thorlabs, FG105LCA). (c) The nanoscale oscillation was detected by the Michelson interferometer utilizing a separate He–Ne laser. See Appendix A for a more detailed description of the experimental setup.

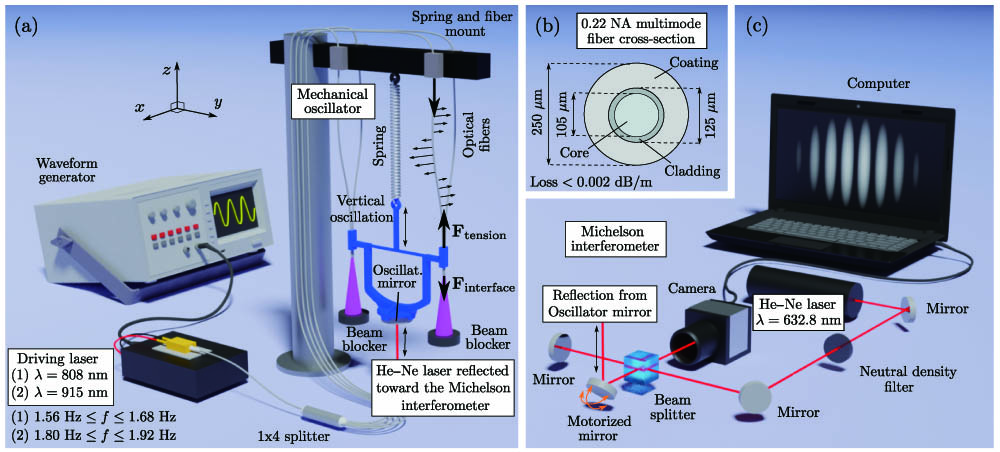
    Figure 1.(a) Mechanical oscillator was driven by optical interface forces Finterface and tensions Ftension of the four fibers, where the laser was propagating. These forces, illustrated for one of the fibers, were modulated by varying the laser intensity. The laser generated by a multimode laser diode was split into the four fibers by a 1×4 splitter, and the laser exited from the ends of the four fibers, which were all bonded to the oscillator. The wavelength was either at 808 nm or 915 nm. (b) The cross section of the 0.22 NA multimode fiber (Thorlabs, FG105LCA). (c) The nanoscale oscillation was detected by the Michelson interferometer utilizing a separate He–Ne laser. See Appendix A for a more detailed description of the experimental setup.

    A 3D printed mass was designed to be held by a spring at the center and balanced by optical fiber strands glued at both ends, as illustrated in Fig. 1(a). A laser was split into four strands of commercial 0.22 NA multimode optical fibers (Thorlabs, FG105LCA) with equal optical power using a 1×4 splitter. The optical fibers, with cross section as in Fig. 1(b), were cleaved at 90 deg and aligned vertically downward. To confirm the universality of our results, we studied two oscillators with different masses and damping constants, one driven at the wavelength of 808 nm and the other at 915 nm. The longitudinal displacements of the oscillators were detected by a Michelson interferometer as in Fig. 1(c) using a He–Ne laser and a mirror attached at the bottom of the mass. Shifts of the interference fringes were recorded with a CMOS camera at a frame rate of 200 frames per second for various incident laser powers and modulation frequencies. A more complete description of the experiment is presented in Appendix A.

    2. OPTICAL FORCES

    The optical forces induced by the light guided in the optical fiber can be divided into the force at the air–silica interface of the optical fiber facet and the tension along the fiber strands as schematically shown by Finterface and Ftension in Fig. 1(a). The force F on an object is equal to the temporal change of its momentum p as F=dp/dt. We study the momentum transfer of light at the end facet of optical fibers, where the light experiences the air–fiber core interface. The momentum of light in the optical fiber and the air is denoted by p and p0, respectively. Then, by summing over the four fibers of Fig. 1(a), we obtain the magnitude of the total interface force from the conservation law of momentum as Finterface=[Tpp0(1+R)]Pc.

    Positive and negative values of Finterface indicate whether the force is upward or downward in Fig. 1(a), respectively, and P=i=14Pi is the sum of the incident optical powers of the four fibers. The power reflection coefficient R and the power transmission coefficient T=1R are equal in the four fibers. For the cleaved fiber facet without any thin-film coating, R and T are given by Fresnel formulas as R=[(n1)/(n+1)]2 and T=4n/(n+1)2. Here n is the refractive index of the fiber core, and we set the refractive index of air to unity.

    When light propagates along a bent fiber, the optical force pushes the fiber walls unequally at different sides, and the net momentum flux of light changes its direction. This is a direct consequence of the momentum conservation law. The optical force on the fiber walls points in the direction of the positive curvature, which is always normal to the fiber as indicated by the small arrows in Fig. 1(a). From the elasticity theory (see Appendix A), it follows that this normal force gives rise to tension in the longitudinal direction of the fiber. The net tension of the four fibers is given by Ftension=i=14Ai(Tzz,iTzz,i(0))dxdy=pp0(1+R)Pc.

    Here Tzz,i is the diagonal component of the stress tensor of the fiber i in the vertical direction when the light is guided through the fiber, Tzz,i(0) is the stress tensor component in the absence of the light, and Ai is the total cross-sectional area of the fiber i on the side of the oscillator.

    From the optical interface force in Eq. (1) and the tension along fibers in Eq. (2), the net time-dependent driving force of the mechanical oscillator is given by F=Finterface+Ftension=TPc.

    The net force in Eq. (3) is interestingly independent of the value of the momentum of light inside the fiber since the dependence on p is canceled out. It is, however, seen that this net force depends only on the optical power, refractive index of the fiber, and the speed of light, which pinpoints its fundamental origin.

    3. MECHANICAL OSCILLATOR

    For the mechanical oscillator used to detect the net laser-induced force, we write Newton’s equation of motion as [29] d2zdt2+2ζω0dzdt+ω02z=Fm,where m is the effective mass of the oscillator, ω0 is the undamped resonance frequency, ζ is the damping coefficient, and F is the net driving force in Eq. (3). The mechanical Q factor is defined in terms of the damping coefficient as Q=1/(2ζ). As the mass of the vertically aligned spring is not negligible, the effective mass of the oscillator is given by Rayleigh’s value m=m0+ms/3, where m0 is the mass of the oscillator and ms is the mass of the spring [30].

    The net force due to a laser beam harmonically modulated with angular frequency ω is denoted by F=F0cos2(12ωt)=12F0[1+cos(ωt)], where F0 is the peak-to-peak force amplitude. The steady-state solution of Eq. (4) is given by z(t)=z(ω)cos(ωt+φ)+F0/(2mω02), where the displacement amplitude is z(ω)=F0/m2(2ωω0ζ)2+(ω2ω02)2and φ=arctan[2ωω0ζ/(ω2ω02)][π,0]. The resonance frequency of the underdamped oscillator with ζ<1/2 is ωr=ω012ζ2. At ωr, the displacement amplitude of the oscillator in Eq. (5) obtains its peak value, z0=F0/(4mω02ζ1ζ2). By measuring the peak value of the displacement amplitude, one then obtains the driving force amplitude as F0=4mω02ζ1ζ2z0.

    Here ω0 and ζ can be accurately determined from the position and width of the mechanical resonance peak, and m can be obtained from the oscillator, spring, and fiber masses measured with a digital scale [28]. For our heavier oscillator, driven with the 808 nm laser, m=(18.363±0.001)g, while for the lighter oscillator, driven with the 915 nm laser, m=(16.485±0.001)g.

    4. RESULTS AND DISCUSSION

    The refractive index of the pure silica core of the fiber is n=1.453 at 808 nm and n=1.452 at 915 nm [31]. Then, at normal incidence, the transmission coefficient for the end interface of the fiber is T=0.9659 at 808 nm and T=0.9660 at 915 nm. For the 0.22 NA multimode fiber, the maximum angle of incidence in the fiber is near 8.7 deg for both wavelengths. The non-normal angles of incidence are accounted for in the analysis, even though their effect is small.

    Figure 2 presents the experimental results. In Fig. 2(a), the measured displacement amplitude of the first oscillator driven at 808 nm is plotted as a function of the modulation frequency of the driving laser field. Figure 2(b) presents the same plot for the second oscillator driven at 915 nm. The net peak-to-peak power amplitude of the four fibers used in these plots is P0=5.125  W. The measurement time is an integer multiple of the modulation period close to 1000 s, and the ensemble averaging is made over 10 or more measurements. As the error of the displacement amplitude, we use the standard deviation of the ensemble average.

    Displacement amplitude of the mechanical oscillator is plotted as a function of the laser modulation frequency (a) for the first oscillator at the wavelength of 808 nm and (b) for the second oscillator at the wavelength of 915 nm. The net peak-to-peak power amplitude of the driving field in the four fibers together is P0=5.125 W in both cases. The solid line represents the averaged frequency spectrum measured with a single modulation frequency. The peak at each modulation frequency is marked with a red dot. The oscillator response function is fitted and shown by the dashed line. The corresponding peak-to-peak force amplitudes of the two oscillators are plotted in (c) and (d) as a function of the peak-to-peak laser power amplitude of the fibers. The solid lines represent the regression lines and the dashed lines show the net theoretical force in Eq. (3). The dashed-dotted and dotted lines are the results of the Minkowski (FM,0) and Abraham (FA,0) momentum models, respectively, using Eq. (1) with the corresponding momentum of light and excluding the tension in Eq. (2).

    Figure 2.Displacement amplitude of the mechanical oscillator is plotted as a function of the laser modulation frequency (a) for the first oscillator at the wavelength of 808 nm and (b) for the second oscillator at the wavelength of 915 nm. The net peak-to-peak power amplitude of the driving field in the four fibers together is P0=5.125  W in both cases. The solid line represents the averaged frequency spectrum measured with a single modulation frequency. The peak at each modulation frequency is marked with a red dot. The oscillator response function is fitted and shown by the dashed line. The corresponding peak-to-peak force amplitudes of the two oscillators are plotted in (c) and (d) as a function of the peak-to-peak laser power amplitude of the fibers. The solid lines represent the regression lines and the dashed lines show the net theoretical force in Eq. (3). The dashed-dotted and dotted lines are the results of the Minkowski (FM,0) and Abraham (FA,0) momentum models, respectively, using Eq. (1) with the corresponding momentum of light and excluding the tension in Eq. (2).

    In Figs. 2(a) and 2(b), one can see that the fitted harmonic oscillator response function of Eq. (5) accurately describes the experimental results of both oscillators. One can also observe the mechanical resonance peak in the noise spectrum that appears below the fitted response function. In the presence of photothermal effects, the response function would be modified from the ideal harmonic oscillator form as described, e.g., in Refs. [4,32]. In accordance with the results for the free space laser driven oscillator in Ref. [28], the photothermal effects are determined to be negligible for our macroscopic oscillator.

    The fitting of the harmonic oscillator response function in the experimental data of the first oscillator in Fig. 2(a) gives the undamped frequency of the oscillator equal to f0=(1.622411±0.000088)Hz. The damping constant and the Q factor are found to be ζ=0.002485±0.000063 and Q=201.2±5.1. The errors indicate the 68.27% confidence intervals of the fitting process correspond to one standard deviation of normally distributed quantities. The corresponding fitting using the experimental data of the second oscillator in Fig. 2(b) gives the undamped oscillator frequency equal to f0=(1.851847±0.000075)Hz and the damping constant equal to ζ=0.003690±0.000051, which corresponds to Q=135.5±1.9.

    Figures 2(c) and 2(d) present the measured peak-to-peak force amplitudes of the two oscillators following Eq. (6) as a function of the peak-to-peak laser power amplitude. The slope of the regression line of the first oscillator is dF0/dP0=(3.28±0.10)×109  s/m=(0.982±0.034)/c. The relative error is 3.5%, from which 2.1% comes from the determination of the damping constant and 1.4% from the peak displacement amplitude. For the second oscillator, dF0/dP0=(3.21±0.10)×109  s/m=(0.963±0.030)/c. The relative error is 3.2%, from which 1.2% comes from the determination of the damping constant and 2.0% from the peak displacement amplitude. The slope of the theoretical line from Eq. (3) is T/c=3.22×109  s/m=0.966/c. Thus, the experimental results of both oscillators agree with the theory within the experimental accuracy. Figures 2(c) and 2(d) also show that the results cannot be explained solely in terms of the interface forces of the conventional Minkowski (p=np0) and Abraham (p=p0/n) momentum models with Eq. (1) [3350]. Thus, accounting for the tension in Eq. (2) is necessary, in which case both conventional models give the same net force. The appearance of more than one force component in experimental setups can partly explain how the Abraham–Minkowski controversy has continued to this day.

    To the best knowledge of the authors, the only previous measurement of forces of light exiting from a solid medium is in Ref. [18]. In their measurements, She et al. were able to detect the recoil of a thin silica filament at the end where the light exited, but the results were not quantitatively accurate, and their interpretation has raised subsequent debates [22,23]. In constrast, the present work can explain the observations of She et al. independently of the Abraham and Minkowski momentum models by including the tension in the fiber induced by the light guided therewithin. A small bending of the filament before its end due to any asymmetry causes the light to create tension, which results in the net pushing effect on the end facet of the filament.

    For a more detailed investigation of the refractive index dependence of the total oscillator force, the present experiment could be carried out by using optical fibers with different refractive indices. The refractive index would need to deviate from that of fused silica by an amount that would change the experimental results sufficiently compared to the error bars of the experiment. Presently, there are no such solid-core optical fibers available that would also have low loss. The experiment could also be carried out by using a hollow-core photonic crystal fiber.

    5. CONCLUSION

    In summary, we have demonstrated that optical forces of light in an optical fiber can be quantitatively measured in situ while the fiber guides the light. We proposed an optomechanical system where a macroscopic mechanical oscillator was driven only by the optical force in the fiber and its nanoscopic displacements were monitored interferometrically. The light guided along an optical fiber provided two forces, the interface force at the end facet and the tension on a curvature. The theoretical model agreed with the experimental measurements with an accuracy of 3.5%. Our work can pave the way to more extensive use of novel mechanical resonator geometries for accurately detecting optical forces in solids, e.g.,  by utilizing whispering gallery modes [25].

    Acknowledgment

    Acknowledgment. The authors acknowledge support from the National Research Foundation of Korea (NRF) grant by the Korea government (MSIT) under Contract No. 2019R1A2C2011293. M.P. acknowledges support from the European Union’s Horizon 2020 Marie Skłodowska-Curie Actions (MSCA) individual fellowship under Contract No. 846218.

    APPENDIX A

    Fabrication and Design of the Mechanical Oscillator

    The mechanical oscillator masses were fabricated by 3D printing using the fused deposition modeling (FDM) technique. The printing material was polylactic acid, commonly known as PLA. As illustrated in Fig. 1(a), the designs of the oscillator masses included a mirror mount, two sidearms to which the optical fibers were bonded, and a hook connecting the oscillator mass to the mechanical extension spring, which carried the weight of the oscillator mass. The total width of the oscillator between the attachment points of the optical fibers was about 9.0 cm. The rest masses of the first and second mechanical oscillators were 15.561 g and 13.683 g, respectively. These masses include 6.715 g of the mass of the mirror (Thorlabs, BB1-E02) that was mounted on the bottom of the oscillator.

    Driving Laser and the Optical Fiber

    The driving laser beam at 808 nm was generated by a multimode laser diode module (Box Optronics, BLD-F808-06-22N0), and the laser beam at 915 nm was generated by a multimode laser diode module (Box Optronics, BLD-F915-10-22N0). The laser beams were coupled to a commercial low-loss 0.22 NA silica core multimode fiber (Thorlabs, FG105LCA). The core diameter of the fiber was (105±2)μm, the cladding diameter was (125±1)μm, and the coating diameter was (250±10)μm. The intensity of the driving laser beam was modulated by a waveform generator (Agilent, 33120A) connected to a laser driver (Arroyo Instruments, LaserPak 485-08-05). The temperature of the laser was controlled with a temperature controller (Arroyo Instruments, TECPak 585-04-08). Before the mechanical oscillator, the laser beam was split into four beams by a fiber optic 1×4 splitter (Lfiber, IRBC-105-1-4-L1-N). Above the mechanical oscillator, the four fibers were mounted on an iron bar so that there was 3.0 mm loose in the fibers above the points where they were attached to the oscillator. This is described in more detail below. Due to the smallness of the absorption coefficient of the optical fiber and the large time constant of the macroscopic oscillator, photothermal effects had negligible influence on our experimental results.

    Measurement of the Laser Power

    The laser power was measured at the ends of the optical fibers by using an optical power meter (Thorlabs, PM400) with an integrating sphere sensor (Thorlabs, S145C). The nonzero reflectivity (R=0.0341 at 808 nm and R=0.0340 at 915 nm) and the corresponding nonunity transmissivity (T=0.9659 at 808 nm and T=0.9660 at 915 nm) of the fiber ends were accounted for in the analysis. The optical powers propagating through all four fibers after the fiber optic splitter were measured to be equal within 1.0%. Thus, the laser-induced forces on the two sides of the oscillator were well balanced. The used peak-to-peak amplitude of the sinusoidal modulation was 1.0% smaller in comparison with the otherwise stationary laser beam. Thus, for example, for a stationary beam with a power of 5.000 W, after adding the modulation and accounting for the nonunity transmissivity of the fiber ends, the peak-to-peak power incident to the fiber ends becomes 5.125 W. This is the value used in the analysis corresponding to the results in Figs. 2(a) and 2(b).

    Mechanical Extension Springs

    In the experimental setup, the mechanical oscillator was hanging on three hard extension springs used in series to obtain a relatively small total spring constant. The springs were made of music wire, and they had crossover-type hooks at their ends. The upper and lower springs were of equal type (Acxess Spring, PE016-312-129000-MW-2500-MH-N-IN) having a mass of ms,1=3.025  g and a reported extension rate of ks,1=5  N/m. The middle spring (Acxess Spring, PE016-312-90250-MW-1880-MH-N-IN) had a mass of ms,2=2.221  g and a reported extension rate of ks,2=7  N/m. The total mass of the four optical fibers parallel to the springs between the holder and the oscillator was 0.136 g, and the total mass of the springs and the fibers was equal to ms=8.407  g. Both the extension rates above and the masses of the vertically aligned springs and fibers contribute to the total spring constant of the oscillator. In the analysis of our experimental results, we used the effective mass, undamped angular frequency, and damping constant as the only oscillator parameters. The total spring constant of the system can be determined from the experimental results as k=mω02. This gives for the first oscillator the total spring constant of k=1.908  N/m, and for the second oscillator we obtain k=2.232  N/m.

    Acoustic and Seismic Isolation

    The experimental setup was mounted on an actively damped optical table for isolating it against acoustic and seismic vibrations. The mechanical oscillator part of the setup was also protected against air flows by covering it with plastic walls. To minimize any disturbances in the surroundings of the laboratory, the measurements were carried out at nighttime.

    Michelson Interferometer

    The motion of the mechanical oscillator was detected by a Michelson interferometer. The interferometer was used to monitor the motion of the oscillator by setting the oscillator mirror in one of the two interferometer arms. The arm length of the interferometer was about 10 cm. One of the interferometer arm mirrors was motorized, and it could be used for tuning the interference fringe spacing remotely. However, the fringe spacing was adjusted only before each measurement, and it was not actively changed during the experiments. All mirrors in the interferometer arms (Thorlabs, BB1-E02) had a reflectivity of more than 99%. The interferometer laser was a 5 mW continuous-wave TEM00 He–Ne laser (JDSU, 1125P) operating at 632.8 nm. Before the beam splitter, the interferometer laser power was reduced by a factor of 1/10 by a neutral density filter (Thorlabs, NE10A). The motion of the interference fringes during the experiment was recorded by a CMOS camera (Edmund Optics, EO-0413C) that was connected to a computer. The frame size recorded was 600×30 pixels, and the recording was made with a frame rate of 200 frames per second.

    Tracking the Motion of Interference Fringes

    The horizontal movement of the interference fringes was tracked from the recorded video files by monitoring the positions of the intensity maxima and minima in each frame. The fringes are illustrated in the computer screen of Fig. 1(c). When the fringes move a distance that is equal to the distance between two intensity maxima, the mechanical oscillator moves half a wavelength in the vertical direction. For efficient analysis of millions of frames in total, we used a C++ code using the Open Computer Vision Library (OpenCV). The analysis followed the same approach as in Ref. [28]. The mechanical oscillator, which was hanging on a spring, could move in all three dimensions, but the interferometer was the most sensitive for the vertical motion of the oscillator that was of our interest. If the oscillator was disturbed by a large amount, the scale of the interference fringes could vary, and the fringes could also rotate. These effects were, however, negligibly small when external noise sources were minimized during measurement conditions.

    Calculation of the Tension along the Fiber

    This section describes how the elasticity theory calculations are used to verify the accuracy of the analytic result in Eq. (2). The optical force on the fiber walls due to the small bending of the fiber follows directly from the conservation law of momentum. It depends on the local curvature of the fiber and can be used in the elasticity theory simulations of the behavior of the fiber. When x=g(z) is the curve of the fiber, the optical force density due to the bending of the fiber averaged over the cross-sectional area of the fiber is equal to f(z)=(p/p0)P/(cA)g(z)/[g(z)2+1]2[g(z)z^x^], where p is the momentum of light in the fiber, p0 is the momentum of light in vacuum, c is the speed of light in vacuum, A is the cross-sectional area of the fiber, and x^ and z^ are unit vectors along the x and z axes, respectively. The optical power P in the force density formula above accounts for both the incident and reflected powers. At the end points of the fiber, z1=0 and z2=h, the curve of the fiber satisfies g(z1)=g(z2)=0, which means that the ends of the fiber between the mechanical oscillator and the fiber mount above it are vertically aligned. We have parameterized the physical path of the fiber as g(z)=a2s{[1+sin(2πhzπ2)]+s[1+sin(πhzπ2)]}, where a and h are physical distance parameters illustrated in Fig. 3, and s is a parameter that controls the amount of loose in the fiber. The length of the fiber is L=0hg(z)2+1dz, and the loose in the fiber is d=LL0, where L0=a2+h2 is the direct distance between the fiber end points. The experimental horizontal and vertical distance parameters are a=2.54  cm and h=31.0  cm. The parameter s is determined so that the loose in the fiber is d=3.0  mm, which gives s=1.35.

    Illustration of the fiber path and the related horizontal and vertical distance parameters a and h.

    Figure 3.Illustration of the fiber path and the related horizontal and vertical distance parameters a and h.

    Elasticity theory simulation of the total tension force of four fibers on the oscillator as a function of the total incident optical power propagating through the fibers. The dots represent the simulation results obtained by using the expression on the left-hand side of Eq. (2), and the dashed line is the theoretical line, given on the right-hand side of Eq. (2).

    Figure 4.Elasticity theory simulation of the total tension force of four fibers on the oscillator as a function of the total incident optical power propagating through the fibers. The dots represent the simulation results obtained by using the expression on the left-hand side of Eq. (2), and the dashed line is the theoretical line, given on the right-hand side of Eq. (2).

    We have also made simulations for several values of loose in the fiber in the range d<2  cm. These calculations show that the resulting tension along the fiber is insensitive to small amounts of loose in the fiber provided that the ends of the fiber are vertically aligned as described above (i.e., the results correspond to those illustrated in Fig. 4 within the 0.1% numerical accuracy of the simulations). Therefore, the equality in Eq. (2) can be assumed to be accurate in the theoretical analysis of the results. Even though the tension force is independent of the amount of loose in the fiber, the loose in the fiber affects the time-dependent dynamics of the oscillator by modifying the damping constant and the resonance frequency of the oscillator. These are parameters that are determined experimentally as described above.

    References

    [1] S. Gigan, H. R. Böhm, M. Paternostro, F. Blaser, G. Langer, J. B. Hertzberg, K. C. Schwab, D. Bäuerle, M. Aspelmeyer, A. Zeilinger. Self-cooling of a micromirror by radiation pressure. Nature, 444, 67-70(2006).

    [2] D. Kleckner, D. Bouwmeester. Sub-kelvin optical cooling of a micromechanical resonator. Nature, 444, 75-78(2006).

    [3] D. M. Weld, A. Kapitulnik. Feedback control and characterization of a microcantilever using optical radiation pressure. Appl. Phys. Lett., 89, 164102(2006).

    [4] D. Ma, J. L. Garrett, J. N. Munday. Quantitative measurement of radiation pressure on a microcantilever in ambient environment. Appl. Phys. Lett., 106, 091107(2015).

    [5] D. R. Evans, P. Tayati, H. An, P. K. Lam, V. S. J. Craig, T. J. Senden. Laser actuation of cantilevers for picometre amplitude dynamic force microscopy. Sci. Rep., 4, 5567(2014).

    [6] R. Wagner, F. Guzman, A. Chijioke, G. K. Gulati, M. Keller, G. Shaw. Direct measurement of radiation pressure and circulating power inside a passive optical cavity. Opt. Express, 26, 23492-23506(2018).

    [7] P. R. Wilkinson, G. A. Shaw, J. R. Pratt. Determination of a cantilever’s mechanical impedance using photon momentum. Appl. Phys. Lett., 102, 184103(2013).

    [8] N. G. C. Astrath, L. C. Malacarne, M. L. Baesso, G. V. B. Lukasievicz, S. E. Bialkowski. Unravelling the effects of radiation forces in water. Nat. Commun., 5, 4363(2014).

    [9] A. Ashkin, J. M. Dziedzic. Radiation pressure on a free liquid surface. Phys. Rev. Lett., 30, 139-142(1973).

    [10] A. Casner, J.-P. Delville. Giant deformations of a liquid–liquid interface induced by the optical radiation pressure. Phys. Rev. Lett., 87, 054503(2001).

    [11] H. Choi, M. Park, D. S. Elliott, K. Oh. Optomechanical measurement of the Abraham force in an adiabatic liquid-core optical-fiber waveguide. Phys. Rev. A, 95, 053817(2017).

    [12] F. A. Schaberle, L. A. Reis, C. Serpa, L. G. Arnaut. Photon momentum transfer at water/air interfaces under total internal reflection. New J. Phys., 21, 033013(2019).

    [13] L. Zhang, W. She, N. Peng, U. Leonhardt. Experimental evidence for Abraham pressure of light. New J. Phys., 17, 053035(2015).

    [14] R. V. Jones, J. C. S. Richards. The pressure of radiation in a refracting medium. Proc. R. Soc. London A, 221, 480-498(1954).

    [15] R. V. Jones, B. Leslie. The measurement of optical radiation pressure in dispersive media. Proc. R. Soc. London A, 360, 347-363(1978).

    [16] A. Kundu, R. Rani, K. S. Hazra. Graphene oxide demonstrates experimental confirmation of Abraham pressure on solid surface. Sci. Rep., 7, 42538(2017).

    [17] A. F. Gibson, M. F. Kimmitt, A. C. Walker. Photon drag in germanium. Appl. Phys. Lett., 17, 75-77(1970).

    [18] W. She, J. Yu, R. Feng. Observation of a push force on the end face of a nanometer silica filament exerted by outgoing light. Phys. Rev. Lett., 101, 243601(2008).

    [19] I. Brevik. Analysis of recent interpretations of the Abraham–Minkowski problem. Phys. Rev. A, 98, 043847(2018).

    [20] M. Partanen, J. Tulkki. Comment on ‘Analysis of recent interpretations of the Abraham–Minkowski problem,’. Phys. Rev. A, 100, 017801(2019).

    [21] I. Brevik. Reply to ‘Comment on “Analysis of recent interpretations of the Abraham–Minkowski problem,”’. Phys. Rev. A, 100, 017802(2019).

    [22] I. Brevik. Comment on ‘Observation of a push force on the end face of a nanometer silica filament exerted by outgoing light,’. Phys. Rev. Lett., 103, 219301(2009).

    [23] M. Mansuripur. Comment on ‘Observation of a push force on the end face of a nanometer silica filament exerted by outgoing light’. Phys. Rev. Lett., 103, 019301(2009).

    [24] A. Schliesser, G. Anetsberger, R. Rivière, O. Arcizet, T. J. Kippenberg. High-sensitivity monitoring of micromechanical vibration using optical whispering gallery mode resonators. New J. Phys., 10, 095015(2008).

    [25] I. Brevik, S. A. Ellingsen. Possibility of measuring the Abraham force using whispering gallery modes. Phys. Rev. A, 81, 063830(2010).

    [26] H. H. Diamandi, Y. London, A. Zadok. Opto-mechanical inter-core cross-talk in multi-core fibers. Optica, 4, 289-297(2017).

    [27] K. Oh, U.-C. Paek. Silica Optical Fiber Technology for Devices and Components: Design, Fabrication, and International Standards(2012).

    [28] M. Partanen, H. Lee, K. Oh. Radiation pressure measurement using a macroscopic oscillator in an ambient environment. Sci. Rep., 10, 20419(2020).

    [29] M. Aspelmeyer, T. J. Kippenberg, F. Marquardt. Cavity optomechanics. Rev. Mod. Phys., 86, 1391-1452(2014).

    [30] W. T. Thomson, M. Dahleh. Theory of Vibration with Applications(1998).

    [31] I. H. Malitson. Interspecimen comparison of the refractive index of fused silica. J. Opt. Soc. Am., 55, 1205-1209(1965).

    [32] D. Ma, J. N. Munday. Measurement of wavelength-dependent radiation pressure from photon reflection and absorption due to thin film interference. Sci. Rep., 8, 15930(2018).

    [33] M. Abraham. Zur Elektrodynamik bewegter Körper. Rend. Circ. Mat. Palermo, 28, 1(1909).

    [34] M. Abraham. Sull’elettrodinamica di Minkowski. Rend. Circ. Mat. Palermo, 30, 33-46(1910).

    [35] H. Minkowski. Die Grundgleichungen für die elektromagnetischen Vorgänge in bewegten Körpern. Nachrichten von der Gesellschaft der Wissenschaften zu Göttingen, Mathematisch-Physikalische Klasse, 53(1908).

    [36] U. Leonhardt. Momentum in an uncertain light. Nature, 444, 823-824(2006).

    [37] R. N. C. Pfeifer, T. A. Nieminen, N. R. Heckenberg, H. Rubinsztein-Dunlop. Colloquium: momentum of an electromagnetic wave in dielectric media. Rev. Mod. Phys., 79, 1197-1216(2007).

    [38] S. M. Barnett. Resolution of the Abraham–Minkowski dilemma. Phys. Rev. Lett., 104, 070401(2010).

    [39] S. M. Barnett, R. Loudon. “The enigma of optical momentum in a medium. Philos. Trans. R. Soc. A, 368, 927-939(2010).

    [40] M. Partanen, T. Häyrynen, J. Oksanen, J. Tulkki. Photon mass drag and the momentum of light in a medium. Phys. Rev. A, 95, 063850(2017).

    [41] K. Y. Bliokh, A. Y. Bekshaev, F. Nori. Optical momentum, spin, and angular momentum in dispersive media. Phys. Rev. Lett., 119, 073901(2017).

    [42] K. Y. Bliokh, A. Y. Bekshaev, F. Nori. Optical momentum and angular momentum in complex media: from the Abraham–Minkowski debate to unusual properties of surface plasmon-polaritons. New J. Phys., 19, 123014(2017).

    [43] M. Partanen, J. Tulkki. Mass-polariton theory of light in dispersive media. Phys. Rev. A, 96, 063834(2017).

    [44] B. A. Kemp. Resolution of the Abraham–Minkowski debate: implications for the electromagnetic wave theory of light in matter. J. Appl. Phys., 109, 111101(2011).

    [45] M. Partanen, J. Tulkki. Lorentz covariance of the mass-polariton theory of light. Phys. Rev. A, 99, 033852(2019).

    [46] M. Partanen, J. Tulkki. Lagrangian dynamics of the coupled field-medium state of light. New J. Phys., 21, 073062(2019).

    [47] U. Leonhardt. Abraham and Minkowski momenta in the optically induced motion of fluids. Phys. Rev. A, 90, 033801(2014).

    [48] P. W. Milonni, R. W. Boyd. Momentum of light in a dielectric medium. Adv. Opt. Photon., 2, 519-553(2010).

    [49] I. Brevik. Experiments in phenomenological electrodynamics and the electromagnetic energy-momentum tensor. Phys. Rep., 52, 133-201(1979).

    [50] M. Partanen, J. Tulkki. Light-driven mass density wave dynamics in optical fibers. Opt. Express, 26, 22046-22063(2018).

    [51] R. Brückner. Properties and structure of vitreous silica. I. J. Non-Cryst. Solids, 5, 123-175(1970).

    [52] B. H. W. S. De Jong, R. G. C. Beerkens, P. A. van Nijnatten. Glass. Ullmann’s Encyclopedia of Industrial Chemistry(2000).

    Mikko Partanen, Hyeonwoo Lee, Kyunghwan Oh. Quantitative in situ measurement of optical force along a strand of cleaved silica optical fiber induced by the light guided therewithin[J]. Photonics Research, 2021, 9(10): 2016
    Download Citation