• Journal of Geographical Sciences
  • Vol. 30, Issue 1, 53 (2020)
Shaodan CHEN, Liping ZHANG, Yanjun ZHANG*, Mengyao GUO, and Xin LIU
Author Affiliations
  • State Key Laboratory of Water Resources and Hydropower Engineering Science, Wuhan University, Wuhan 430072, China
  • show less
    DOI: 10.1007/s11442-020-1714-y Cite this Article
    Shaodan CHEN, Liping ZHANG, Yanjun ZHANG, Mengyao GUO, Xin LIU. Evaluation of Tropical Rainfall Measuring Mission (TRMM) satellite precipitation products for drought monitoring over the middle and lower reaches of the Yangtze River Basin, China[J]. Journal of Geographical Sciences, 2020, 30(1): 53 Copy Citation Text show less
    Location of the MLRYRB and distribution of meteorological stations
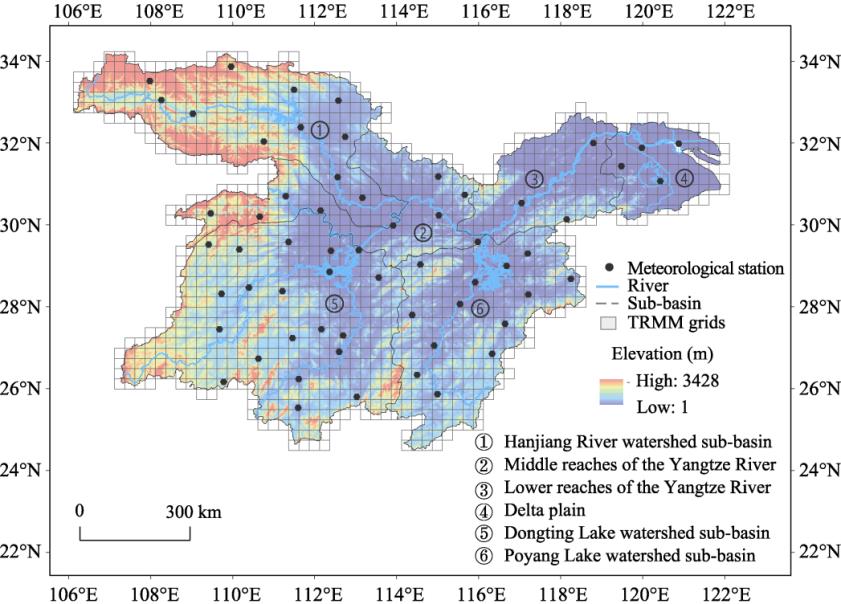
    Fig. 1. Location of the MLRYRB and distribution of meteorological stations
    SPI time series calculated from the TRMM 3B43 data (blue and red shaded bars) and station data (solid line) at different time scales: (a) 1 month; (b) 3 months; (c) 6 months; and (d) 12 months
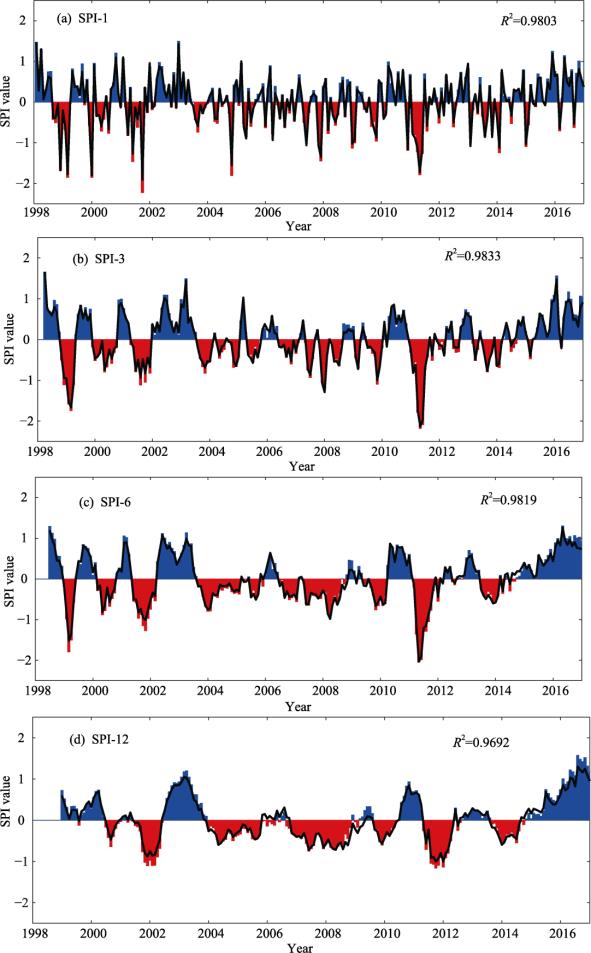
    Fig. 2. SPI time series calculated from the TRMM 3B43 data (blue and red shaded bars) and station data (solid line) at different time scales: (a) 1 month; (b) 3 months; (c) 6 months; and (d) 12 months
    Correlation coefficients of the SPI values calculated with the TRMM 3B43 products and the weather station data
    Fig. 3. Correlation coefficients of the SPI values calculated with the TRMM 3B43 products and the weather station data
    Spatial distribution of the SPI value trends at the 3-month time scale in the MLRYRB
    Fig. 4. Spatial distribution of the SPI value trends at the 3-month time scale in the MLRYRB
    Temporal variability in the SPI values and the drought events of different severity grades from 1998-2016
    Fig. 5. Temporal variability in the SPI values and the drought events of different severity grades from 1998-2016
    Frequency of drought events and different drought levels (moderate drought, severe drought and extreme drought) based on the SPI values at the 3-month time scale in the MLRYRB from 1998 to 2016
    Fig. 6. Frequency of drought events and different drought levels (moderate drought, severe drought and extreme drought) based on the SPI values at the 3-month time scale in the MLRYRB from 1998 to 2016
    Temporal evolution based on the TRMM 3B43-derived SPI values for different drought conditions (moderate, severe and extreme) at different time scales (1, 3, 6 and 12 months)
    Fig. 7. Temporal evolution based on the TRMM 3B43-derived SPI values for different drought conditions (moderate, severe and extreme) at different time scales (1, 3, 6 and 12 months)
    Spatial pattern of typical drought events based on the SPI values during the period of 1998-2016
    Fig. 8. Spatial pattern of typical drought events based on the SPI values during the period of 1998-2016
    SPI time series calculated from the TRMM 3B43 data (blue and red shaded bars) and station data (solid line) based on the 56-year time series at different time scales
    Fig. 9. SPI time series calculated from the TRMM 3B43 data (blue and red shaded bars) and station data (solid line) based on the 56-year time series at different time scales
    Correlation coefficients for SPI values calculated with the TRMM 3B43 product and station data based on the 56-year time series
    Fig. 10. Correlation coefficients for SPI values calculated with the TRMM 3B43 product and station data based on the 56-year time series
    SPI valueDrought category
    (2.0, +∞)Extreme wet
    (1.5, 2.0]Severe wet
    (1.0, 1.5]Moderate wet
    (-1.0, 1.0]Normal
    (-1.5, -1.0]Moderate drought
    (-2.0, -1.5]Severe drought
    (-∞, -2.0]Extreme drought
    Table 1.

    Drought classification based on SPI values

    Shaodan CHEN, Liping ZHANG, Yanjun ZHANG, Mengyao GUO, Xin LIU. Evaluation of Tropical Rainfall Measuring Mission (TRMM) satellite precipitation products for drought monitoring over the middle and lower reaches of the Yangtze River Basin, China[J]. Journal of Geographical Sciences, 2020, 30(1): 53
    Download Citation