• Journal of Geographical Sciences
  • Vol. 30, Issue 1, 53 (2020)
Shaodan CHEN, Liping ZHANG, Yanjun ZHANG*, Mengyao GUO, and Xin LIU
Author Affiliations
  • State Key Laboratory of Water Resources and Hydropower Engineering Science, Wuhan University, Wuhan 430072, China
  • show less
    DOI: 10.1007/s11442-020-1714-y Cite this Article
    Shaodan CHEN, Liping ZHANG, Yanjun ZHANG, Mengyao GUO, Xin LIU. Evaluation of Tropical Rainfall Measuring Mission (TRMM) satellite precipitation products for drought monitoring over the middle and lower reaches of the Yangtze River Basin, China[J]. Journal of Geographical Sciences, 2020, 30(1): 53 Copy Citation Text show less

    Abstract

    Drought is one of the most frequent and widespread natural disasters and has tremendous agricultural, ecological, societal, and economic impacts. Among the many drought indices, the standardized precipitation index (SPI) based on monthly precipitation data is simple to calculate and has multiscale characteristics. To evaluate the applicability of high spatiotemporal resolution satellite precipitation products for drought monitoring, based on the Tropical Rainfall Measuring Mission (TRMM) products and station-based meteorological data, the SPI values at different time scales (1, 3, 6, and 12 months) were calculated for the period of 1998-2016 in the middle and lower reaches of the Yangtze River Basin (MLRYRB). The temporal correlations show that there is a high degree of consistency between calculations at the different time scales (1, 3, 6 and 12 months) based on the two data sources and that the amplitude of fluctuations decreases with increasing time scale. In addition, the Mann-Kendall (MK) test method was applied to analyze the trends from 1998 to 2016, and the results suggest that wetting trends clearly prevailed over drying trends. Moreover, a correlation analysis of the two data sources based on 60 meteorological stations was performed with the SPI values at different time scales. The correlation coefficients at the short time scales (1, 3, and 6 months) are all greater than 0.7, and the correlation coefficient at the long time scale (12 months) is greater than 0.5. In summary, the results demonstrate that the TRMM 3B43 precipitation product provides a new data source that can be used for reliable drought monitoring in the MLRYRB.

    1 Introduction

    Drought is a type of natural disaster that occurs with high frequency, has a wide range of impacts, and results in the most serious disaster losses around the world (Mishra and Singh, 2010; Dai, 2011; Zhang et al., 2013). Drought usually refers to a water shortage caused by an imbalance between evaporation and precipitation over a certain period. Notably, droughts can have serious negative effects on agricultural production, natural ecosystems, society and the economy (Dabanlı et al., 2017; Shi et al., 2017). Several drought indices are used to monitor the onset, duration, and severity of droughts, such as the Palmer drought severity index (PDSI) and the standardized precipitation index (SPI) (Palmer, 1965; McKee et al., 1993; Dai et al., 2004). The PDSI comprehensively considers precipitation, temperature, and effective soil moisture based on the water balance model. However, this index lacks the ability to monitor the multiscalar nature of drought. To address this problem, McKee et al. (1993) proposed the SPI, which describes the cumulative probability of observed precipitation at any given time. Moreover, the SPI requires only precipitation data and has multiscale features. Many studies have been conducted in past decades using the SPI, but most of them were based on in situ observations (Huang et al., 2010; Zhou et al., 2013; Gao et al., 2015). Due to geographical and economic factors, meteorological sites are often sparsely distributed and lack good spatial representation. Although regional drought conditions can be obtained through spatial interpolation, the data may have uncertainties, especially when weather stations are sparse.

    With the rapid development of remote sensing technology, a series of precipitation products based on satellite remote sensing has emerged (Cashion et al., 2005; Hao et al., 2011). These products have a wide range of quasi-global scale coverage and high spatiotemporal resolution; additionally, they can effectively compensate for the lack of spatially distributed ground stations and provide a new data source for the calculation of drought indices. Among such data sources, the Tropical Rainfall Measuring Mission (TRMM) products have received considerable attention since the TRMM launch on November 27, 1997 (Zeng and Li, 2011; Liu et al., 2016; Gao et al., 2017; Erazo et al., 2018). Li et al. (2013) evaluated the suitability of the TRMM products in dry/wet monitoring over the Poyang Lake Basin. Similar studies have also been conducted in Chile and the Lake Chad Basin in Africa (Naumann et al., 2012; Zambrano et al., 2017). These studies have shown that observational data at the monthly scale and at ground stations are highly accurate and can replace site observation data to a certain extent. Therefore, the TRMM products have broad application prospects in the field of drought monitoring. However, there has been little research on the TRMM products applied to drought monitoring and assessment at the river basin scale, particularly in the middle and lower reaches of the Yangtze River Basin (MLRYRB), China.

    The purpose of the study is to determine whether the remote-sensing-based TRMM products can replace station-based precipitation measurements and become new sources of data for regional drought monitoring and assessment. In this study, the main specific objectives are (1) to evaluate the correlation of SPI values over different time scales (1, 3, 6, and 12 months) in the MLRYRB as derived from remote-sensing-based TRMM rainfall data and station-based precipitation data and (2) to use the SPI values calculated from remotely sensed TRMM products to estimate the spatial and temporal distributions of drought conditions over a 19-year period (1998-2016) in the MLRYRB, thereby providing a new data source for use in regional drought monitoring.

    2 Data and methods

    2.1 Study area

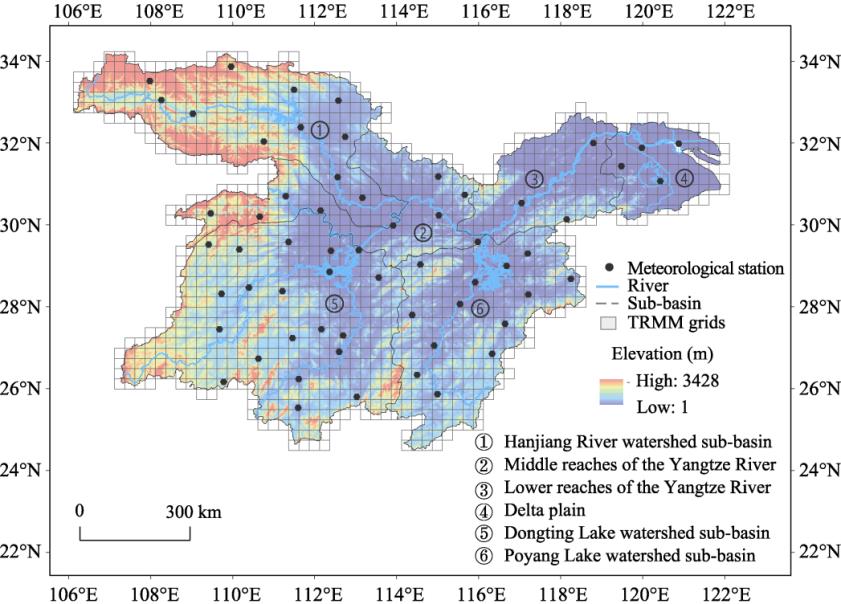
    The Yangtze River is one of the major rivers in China, with a length of approximately 6300 km and a catchment area of approximately 1.8 million km2. We choose the middle and lower reaches of the Yangtze River as the study area, which is divided into six sub-basins: the Hanjiang River watershed, the Dongting Lake watershed, the middle reaches of the Yangtze River, the Poyang Lake watershed, the lower reaches of the Yangtze River and the delta plain (as shown in Figure 1) (Shan et al., 2018). The climate in this area is warm and wet in summer and cold and dry in winter. The average annual temperature ranges from approximately 14°C to 18°C. The annual rainfall totals approximately 1000 to 1400 mm and is mainly concentrated in the flood season. Moreover, plum rains are a major feature of this area. Summer monsoons often occur after plum rains. These events can lead to inestimable agricultural losses and inhibit economic development in the area. Therefore, taking effective measures to monitor the drought conditions in the MLRYRB is important.

    Location of the MLRYRB and distribution of meteorological stations

    Figure 1.Location of the MLRYRB and distribution of meteorological stations

    2.2 Data

    The TRMM mission is an international plan jointly developed by the National Aeronautics and Space Administration (NASA) and the Japan Aerospace Exploration Agency (JAXA) to study weather and climate factors. The TRMM satellite was successfully launched on November 27, 1997 (Tao et al., 2016; Ma et al., 2017). The spatial resolution of the TRMM data is 0.25°×0.25°, with an initial height of approximately 350 km and a coverage range of 50°S to 50°N (Fan et al., 2017; Ma et al., 2018). In this study, the TRMM 3B43 data spanning 19 years from January 1998 to December 2016 were collected, and the TRMM grid data from the Yangtze River Basin were then extracted for a total of 1367 grids, which were provided by the NASA Precipitation Measurement Mission website. In addition, the monthly precipitation data collected at 60 meteorological stations from 1961 to 2016 were used in this study. These data were obtained from the China Meteorological Data Sharing Service System (available at http://cdc.nmic.cn/home.do).

    2.3 The standardized precipitation index

    The SPI is obtained with a standardized probability to quantify the deficit in precipitation (Patel et al., 2007; McRoberts and Nielsen-Gammon, 2012). Precipitation data series are fitted to a gamma probability density function to obtain the cumulative probability and then transformed to a normal distribution with an inverse normal function (Mondol et al., 2017). Then, the SPI values can be defined as:

    where x is the monthly precipitation, c0 = 2.515517, c1 = 0.802853, c2 = 0.010328, d1 =1.432788, d2 = 0.189269, d3 = 0.001308, and H(x) is the cumulative probability of the data series, which is transformed into an incomplete gamma distribution function (Santos et al., 2017). The gamma distribution is expressed as follows:

    where α and β are shape and scale parameters, respectively, and Γ(α)is the gamma function. In this study, four time scales (1, 3, 6, 12 months) were used to calculate the SPI values. Table 1 shows the classification of the severity of dryness and wetness according to the SPI values (McKee et al., 1993; McKee, 1995).

    In addition, the nonparametric Mann-Kendall (MK) test was used to identify the drying or wetting trends in the MLRYRB based on the SPI values at the 3-month time scale. For a detailed introduction to the test, please refer to the literature (Zhai and Feng, 2009; Tosunoglu and Kisi, 2017). The main feature of the MK test is that the distribution characteristics of the data need not be assumed in advance; therefore, this test has been widely used in trend analysis. The standardized Z values obtained by the MK test provide a way of quantitatively indicating trends and significance (Hamed, 2008; Li et al., 2015). Positive values indicate more humid trends, and negative values indicate more arid trends. When the significance levels are set at 0.01, 0.05, and 0.1, the absolute values of Z are 2.575, 1.96 and 1.645, respectively.

    SPI valueDrought category
    (2.0, +∞)Extreme wet
    (1.5, 2.0]Severe wet
    (1.0, 1.5]Moderate wet
    (-1.0, 1.0]Normal
    (-1.5, -1.0]Moderate drought
    (-2.0, -1.5]Severe drought
    (-∞, -2.0]Extreme drought

    Table 1.

    Drought classification based on SPI values

    3 Results

    3.1 Comparison of TRMM and station data

    To evaluate the suitability of the TRMM 3B43 precipitation products for drought monitoring, the SPI values in the MLRYRB from 1998-2016 were calculated from the TRMM data and the meteorological data at different time scales (1, 3, 6 and 12 months) (Figure 2). The TRMM data and the meteorological data are highly consistent. The amplitude of fluctuations decreases as the time scale increases. Additionally, the correlation coefficient (R2) is greater than 0.96. However, at a time scale of 12 months, the correlation coefficient is not as good as those of short time scales (1, 3 and 6 months). In addition, the TRMM-derived SPI slightly overestimates the drought intensity compared to the station-derived SPI.

    SPI time series calculated from the TRMM 3B43 data (blue and red shaded bars) and station data (solid line) at different time scales: (a) 1 month; (b) 3 months; (c) 6 months; and (d) 12 months

    Figure 2. SPI time series calculated from the TRMM 3B43 data (blue and red shaded bars) and station data (solid line) at different time scales: (a) 1 month; (b) 3 months; (c) 6 months; and (d) 12 months

    Correlation analysis between the TRMM-derived SPI values and station-derived SPI values was conducted at different time scales during the period of 1998-2016 (Figure 3). The SPI values calculated using the two data sources are highly correlated. The correlation coefficients of the short time scales (1, 3, and 6 months) are all greater than 0.7, and the correlation coefficient of the long time scale (12 months) is greater than 0.5, indicating that the TRMM 3B43 products perform better at short time scales. Notably, the accuracy of SPI values is affected by the time series length, and the meteorological stations with low correlations are located near the boundaries of the basin, where the associated data are easily affected by topographical factors.

    Correlation coefficients of the SPI values calculated with the TRMM 3B43 products and the weather station data

    Figure 3. Correlation coefficients of the SPI values calculated with the TRMM 3B43 products and the weather station data

    3.2 Drought monitoring using TRMM data

    The MK trend test is used to detect the trends in SPI values in the MLRYRB at a 3-month time scale for the 1367 grids from 1998 to 2016 (Figure 4). The upward arrows represent wetter trends in the SPI values, whereas the downward arrows represent drier trends in the SPI values. In the overall study area, 974 grids exhibit increasing trends, that is, 71.25% experience wetter trends. Additionally, 393 grids exhibit decreasing trends, that is, 28.75% experience drier trends. The delta plain, the lower reaches of the Yangtze River, and the Poyang Lake watershed display upward trends, and the southern part of the Dongting Lake watershed, the eastern part of the middle reaches of the Yangtze River, and the western part of the Hanjiang River watershed also exhibit upward trends. The remaining regions display downward trends. For the trends in SPI values, 37.82%, 30.29%, and 17.34% of areas reached the positive significance levels of 0.1, 0.05, and 0.01, respectively, and 4.32%, 2.41%, and 0.51% of the areas reached the negative significance levels of 0.1, 0.05, and 0.01, respectively. In general, wetting trends in the entire region clearly prevailed over drying trends.

    Spatial distribution of the SPI value trends at the 3-month time scale in the MLRYRB

    Figure 4. Spatial distribution of the SPI value trends at the 3-month time scale in the MLRYRB

    To demonstrate the temporal variability of drought more explicitly, the SPI time series based on TRMM products were averaged over all 1367 grid cells to characterize the dry or wet conditions in the MLRYRB during the period of 1998-2016 (Figure 5). The SPI time series all indicated a wetting trend, and the SPI values on a 3-month scale refer to the sea-sonal water deficits caused by droughts. In addition, the May, August, November and February SPI values represent the spring, summer, autumn, and winter values, respectively. As shown in Figure 5b, a spring drought occurred in 2011; no summer droughts occurred; autumn droughts occurred in 1998 and 2007; and a winter drought occurred in 1999. Furthermore, as the time scale increased, the separation between dry and wet periods became more obvious. Figure 5d shows that drought events occurred frequently in 2001, 2002 and 2011.

    Temporal variability in the SPI values and the drought events of different severity grades from 1998-2016

    Figure 5.Temporal variability in the SPI values and the drought events of different severity grades from 1998-2016

    The time scale of 3 months exhibited the highest correlation coefficient (R2=0.9833). Therefore, the SPI values at a time scale of 3 months were selected to demonstrate the spatial distribution of the drought frequency in the MLRYRB during the period of 1998-2016. The frequency of drought events (SPI≤-1) and different drought levels (moderate drought, severe drought and extreme drought) based on the SPI values at the 3-month time scale are presented in Figure 6 to illustrate the spatial distribution of drought severity in the MLRYRB from 1998 to 2016. Figure 6a presents the spatial distribution of the total drought frequency in the study area. The Poyang Lake watershed region experienced the lowest drought frequency, potentially because rainfall is plentiful in the Poyang Lake watershed, averaging 1400 to 1900 mm annually. The middle reaches of the Yangtze River exhibited a high frequency of extreme drought, but the frequency of moderate drought was relatively low. The frequency of moderate drought was high in the lower reaches of the Yangtze River, but the frequency of extreme drought was relatively low. In addition, according to the ranges of the frequency values of moderate drought (Figure 6b), severe drought (Figure 6c), and extreme drought (Figure 6d), moderate drought occurs most frequently, followed by severe drought and extreme drought.

    Frequency of drought events and different drought levels (moderate drought, severe drought and extreme drought) based on the SPI values at the 3-month time scale in the MLRYRB from 1998 to 2016

    Figure 6. Frequency of drought events and different drought levels (moderate drought, severe drought and extreme drought) based on the SPI values at the 3-month time scale in the MLRYRB from 1998 to 2016

    In addition, the area percentages of the MLRYRB associated with different drought grades (moderate, severe and extreme) are shown in Figure 7 to further reveal the drought variations on spatial and temporal scales. Figure 7 shows the area percentages of moderate drought (areas in orange), severe drought (areas in pink) and extreme drought (areas in dark red) conditions. The figure illustrates that the most severe drought year was 2011 and that the area and frequency of moderate drought are the largest, followed by those of severe drought and extreme drought. In addition, the long-term SPI values (12 months) presented in Figure 7d suggest that sustained drought events occurred between March 2011 and April 2012 and covered up to 50% of the MLRYRB. Notably, in September 2011, 66.7% of the MLRYRB experienced drought events, of which moderate drought, severe drought, and extreme drought conditions comprised 21.5%, 34.2%, and 11.0% of the area, respectively. In addition, the regional spatial distribution of typical drought events in the MLRYRB from 1998-2016 based on SPI-3 is shown in Figure 8. In severe drought months in the MLRYRB, most of the area experienced drought events. The results show that the application of the TRMM 3B43 data provides a new method of calculating the spatial distribution of drought indices.

    Temporal evolution based on the TRMM 3B43-derived SPI values for different drought conditions (moderate, severe and extreme) at different time scales (1, 3, 6 and 12 months)

    Figure 7. Temporal evolution based on the TRMM 3B43-derived SPI values for different drought conditions (moderate, severe and extreme) at different time scales (1, 3, 6 and 12 months)

    4 Discussion

    Although the TRMM 3B43 satellite precipitation product has been well applied in drought monitoring in the MLRYRB, Wu et al. (2005) noted that the accuracy of the SPI values is affected by the length of the time series because reducing the length of time may lead to instability in parameter estimation. Therefore, to determine whether the application of TRMM satellite data in the MLRYRB is affected by the length of time, this study selected meteorological station data (as shown in Figure 1) from 1961 to 2016 to validate the reli-ability of TRMM-based satellite drought monitoring. Based on the meteorological station data, the SPI values at the four time scales (1, 3, 6 and 12 months) were calculated, and the SPI values from 1998 to 2016 were then selected and compared with the SPI values calculated from the TRMM data corresponding to site locations (Figure 9). Figure 9 shows that the SPI values at different time scales calculated using the two data sources are highly correlated and that the correlation coefficients (R2) are greater than 0.95.

    Spatial pattern of typical drought events based on the SPI values during the period of 1998-2016

    Figure 8. Spatial pattern of typical drought events based on the SPI values during the period of 1998-2016

    Based on the SPI values calculated from the meteorological site data for 56 years, the time series from 1998-2016 was selected, and the correlations with the SPI values calculated from the TRMM 3B43 data from corresponding sites were analyzed to obtain the spatial distribution of the correlation coefficients (Figure 10). Except for three stations in Figure 10c and six stations in Figure 10d, for which the correlation coefficients are less than 0.8, all other correlation coefficients are greater than 0.8, indicating that the correlation between the TRMM 3B43 product and station data based on the 56-year time series is high. Although Wu et al. (2005) noted that the calculation accuracy of the SPI values is influenced by the length of the time series, the results show that the accuracy of the SPI in the MLRYRB is affected slightly by the time series length, indicating that the TRMM data can be effectively applied for drought monitoring in the MLRYRB. In addition, because the TRMM precipitation product has been available since January 1998, long-term sequential drought index calculations are temporarily impossible; however, NASA’s Global Precipitation Measuring Mission will continue to provide long-range satellite precipitation products. Therefore, the shortcomings of the time series length can be resolved when the SPI drought index calculation is performed based on TRMM data in the future.

    SPI time series calculated from the TRMM 3B43 data (blue and red shaded bars) and station data (solid line) based on the 56-year time series at different time scales

    Figure 9. SPI time series calculated from the TRMM 3B43 data (blue and red shaded bars) and station data (solid line) based on the 56-year time series at different time scales

    Correlation coefficients for SPI values calculated with the TRMM 3B43 product and station data based on the 56-year time series

    Figure 10. Correlation coefficients for SPI values calculated with the TRMM 3B43 product and station data based on the 56-year time series

    5 Conclusions

    In this study, to assess the applicability of the TRMM 3B43 products for drought monitoring in the MLRYRB, the SPI drought indices from 1998 to 2016 at different time scales (1, 3, 6 and 12 months) were calculated based on the TRMM 3B43 satellite precipitation products and meteorological data collected at 60 meteorological stations. In addition, the correlation between the two data sources was assessed to investigate the performance of the TRMM 3B43 data. The main conclusions can be summarized as follows.

    (1) The SPI values exhibit a high degree of consistency over the different time scales (1, 3, 6 and 12 months) based on the two data sources, and the amplitude of fluctuations decreases with increasing time scale. As the time scale increases, the consistency of the SPI values calculated based on the two data sources decreases slightly.

    (2) The MK test method is applied to detect the trends in SPI values in the MLRYRB from 1998 to 2016. Notably, 71.25% of the entire study area experienced wetter trends, and 28.75% experienced drier trends, suggesting that wetting trends in the region clearly prevailed over drying trends.

    (3) The validation based on station data indicated that the SPI values calculated using the two data sources are highly correlated. The results suggest that the TRMM satellite precipitation products can be used to monitor drought events and effectively compensate for the errors associated with the spatial distribution of the SPI values generated by spatial interpolation. Therefore, the TRMM precipitation products can be confidently used instead of ground station observations to monitor and assess regional droughts, even in areas with sparse and unevenly distributed weather stations. The TRMM product also provides a new data source and technical support for future regional hydrological forecasting and disaster monitoring.

    References

    [1] J Cashion, V Lakshmi, D Bosch et al. Microwave remote sensing of soil moisture: Evaluation of the TRMM microwave imager (TMI) satellite for the Little River Watershed Tifton, Georgia. Journal of Hydrology, 307, 242-253(2005).

    [2] İ Dabanlı, K Mishra A, Z Sen. Long-term spatio-temporal drought variability in Turkey. Journal of Hydrology, 552, 779-792(2017).

    [3] A Dai. Drought under global warming: A review. Wiley Interdisciplinary Reviews: Climate Change, 2, 45-65(2011).

    [4] A Dai, E Trenberth K, T Qian. A global dataset of Palmer Drought Severity Index for 1870-2002: Relationship with soil moisture and effects of surface warming. Journal of Hydrometeorology, 5, 1117-1130(2004).

    [5] B Erazo, L Bourrel, F Frappart et al. Validation of satellite estimates (Tropical Rainfall Measuring Mission, TRMM) for rainfall variability over the Pacific slope and coast of Ecuador. Water, 10, 213(2018).

    [6] K Fan K, M Duan L, Q Zhang et al. Downscaling analysis of TRMM precipitation based on multiple high-resolution satellite data in the Inner Mongolia, China. Scientia Geographica Sinica, 37, 1411-1421(2017).

    [7] J Gao, G Tang, Y Hong. Similarities and improvements of GPM dual-frequency precipitation radar (DPR) upon TRMM precipitation radar (PR) in global precipitation rate estimation, type classification and vertical profiling. Remote Sensing, 9, 1142(2017).

    [8] X Gao, Q Xu, J Cong et al. Temporal and spatial patterns of droughts based on standard precipitation index (SPI) in Liaoning Province in recent 54 a. Ecology and Environmental Sciences, 24, 1851-1857(2015).

    [9] H Hamed K. Trend detection in hydrologic data: The Mann-Kendall trend test under the scaling hypothesis. Journal of Hydrology, 349, 350-363(2008).

    [10] C Hao Z, K Tong, L Zhang L et al. Applicability analysis of TRMM precipitation estimates in Tibetan Plateau. Hydrology, 31, 18-23(2011).

    [11] H Huang W, G Yang X, S Li M et al. Evolution characteristics of seasonal drought in the south of China during the past 58 years based on standardized precipitation index. Transactions of the Chinese Society of Agricultural Engineering, 26, 50-59(2010).

    [12] X Li, B He B, W Quan X et al. Use of the Standardized Precipitation Evapotranspiration Index (SPEI) to characterize the drying trend in Southwest China from 1982-2012. Remote Sensing, 7, 10917-10937(2015).

    [13] H Li X, Q Zhang, C Ye X. Dry/wet conditions monitoring based on TRMM rainfall data and its reliability validation over Poyang Lake basin, China. Water, 5, 1848-1864(2013).

    [14] H Liu S, H Yan D, H Wang et al. Evaluation of TRMM 3B42V7 at the basin scale over mainland China. Advances in Water Science, 27, 639-651(2016).

    [15] Q Ma Z, Q Zhou L, W Yu et al. Improving TMPA 3B43 V7 data sets using land-surface characteristics and ground observations on the Qinghai-Tibet Plateau. IEEE Geoscience and Remote Sensing Letters, 15, 178-182(2018).

    [16] Q Ma Z, Y Zhou, F Hu B et al. Downscaling annual precipitation with TMPA and land surface characteristics in China. International Journal of Climatology, 37, 5107-5119(2017).

    [17] B McKee T. Drought monitoring with multiple time scales, Proceedings of 9th Conference on Applied Climatology,. Boston(1995).

    [18] B McKee T, J Doesken N, J Kleist. The relationship of drought frequency and duration to time scales. In: Proceedings of the 8th Conference on Applied Climatology. American Meteorological Society Boston, MA, 179-183.

    [19] B McRoberts D, W Nielsen-Gammon J. The use of a high-resolution standardized precipitation index for drought monitoring and assessment. Journal of Applied Meteorology and Climatology, 51, 68-83(2012).

    [20] K Mishra A, P Singh V. A review of drought concepts. Journal of Hydrology, 391, 202-216(2010).

    [21] H Mondol M A, I Ara, C Das S. Meteorological drought index mapping in Bangladesh using Standardized Precipitation Index during 1981-2010. Advances in Meteorology, 1-17(2017).

    [22] G Naumann, P Barbosa, H Carrao et al. Monitoring drought conditions and their uncertainties in Africa using TRMM data. Journal of Applied Meteorology and Climatology, 51, 1867-1874(2012).

    [23] C Palmer W. Meteorological drought. Research Paper No.45. Washington, DC: US Department of Commerce. Weather Bureau, 59(1965).

    [24] R Patel N, P Chopra, K Dadhwal V. Analyzing spatial patterns of meteorological drought using standardized precipitation index. Meteorological Applications, 14, 329-336(2007).

    [25] G Santos C A, B Neto R M, S de Araujo Passos J et al. Drought assessment using a TRMM-derived standardized precipitation index for the upper Sao Francisco River basin, Brazil. Environmental Monitoring and Assessment, 189, 250(2017).

    [26] J Shan L, P Zhang L, Y Song J et al. Characteristics of dry-wet abrupt alternation events in the middle and lower reaches of the Yangtze River Basin and the relationship with ENSO. Journal of Geographical Sciences, 28, 1039-1058(2018).

    [27] L Shi B, Y Zhu X, C Hu Y et al. Drought characteristics of Henan province in 1961-2013 based on Standardized Precipitation Evapotranspiration Index. Journal of Geographical Sciences, 27, 311-325(2017).

    [28] H Tao, T Fischer, Y Zeng et al. Evaluation of TRMM 3B43 precipitation data for drought monitoring in Jiangsu Province, China. Water, 8, 221(2016).

    [29] F Tosunoglu, O Kisi. Trend analysis of maximum hydrologic drought variables using Mann-Kendall and Şen’s innovative trend method. River Research and Applications, 33, 597-610(2017).

    [30] H Wu, J Hayes M, A Wilhite D et al. The effect of the length of record on the standardized precipitation index calculation. International Journal of Climatology, 25, 505-520(2005).

    [31] F Zambrano, B Wardlow, T Tadesse et al. Evaluating satellite-derived long-term historical precipitation datasets for drought monitoring in Chile. Atmospheric Research, 186, 26-42(2017).

    [32] W Zeng H, J Li L. Accuracy validation of TRMM 3B43 data in Lancang river basin. Acta Geographica Sinica, 66, 994-1004(2011).

    [33] X Zhai L, Q Feng. Spatial and temporal pattern of precipitation and drought in Gansu Province, Northwest China. Natural Hazards, 49, 1-24(2009).

    [34] J Zhang M, Y He J, L Wang B et al. Extreme drought changes in Southwest China from 1960 to 2009. Journal of Geographical Sciences, 23, 3-16(2013).

    [35] Y Zhou, N Li, H Ji Z et al. Temporal and spatial patterns of droughts based on standard precipitation index (SPI) in Inner Mongolia during 1981-2010. Journal of Natural Resources, 28, 1694-1706(2013).

    Shaodan CHEN, Liping ZHANG, Yanjun ZHANG, Mengyao GUO, Xin LIU. Evaluation of Tropical Rainfall Measuring Mission (TRMM) satellite precipitation products for drought monitoring over the middle and lower reaches of the Yangtze River Basin, China[J]. Journal of Geographical Sciences, 2020, 30(1): 53
    Download Citation