Cheng JING1,1,1,1,1,1,1,1, Hui TAO1,1,1,1, Tong JIANG1,1,1,1,1,1,1,1,*, Yanjun WANG1,1,1,1..., Jianqing ZHAI1,1,1,1,1,1,1,1, Lige CAO1,1,1,1 and Buda SU1,1,1,1,1,1,1,1,1,1,1,1|Show fewer author(s)
Author Affiliations
11State Key Laboratory of Desert and Oasis Ecology, Xinjiang Institute of Ecology and Geography, CAS, Urumqi 830011, China12Collaborative Innovation Center on Forecast and Evaluation of Meteorological Disasters/Institute for Disaster Risk Management/School of Geographical Science, Nanjing University of Information Science & Technology, Nanjing Jiangsu 210044, China13National Climate Center, China Meteorological Administration, Beijing 100081, China14University of Chinese Academy of Sciences, Beijing 100049, Chinashow less
DOI: 10.1007/s11442-020-1715-x
Cite this Article
Cheng JING, Hui TAO, Tong JIANG, Yanjun WANG, Jianqing ZHAI, Lige CAO, Buda SU. Population, urbanization and economic scenarios over the Belt and Road region under the Shared Socioeconomic Pathways[J]. Journal of Geographical Sciences, 2020, 30(1): 68
Copy Citation Text
show less
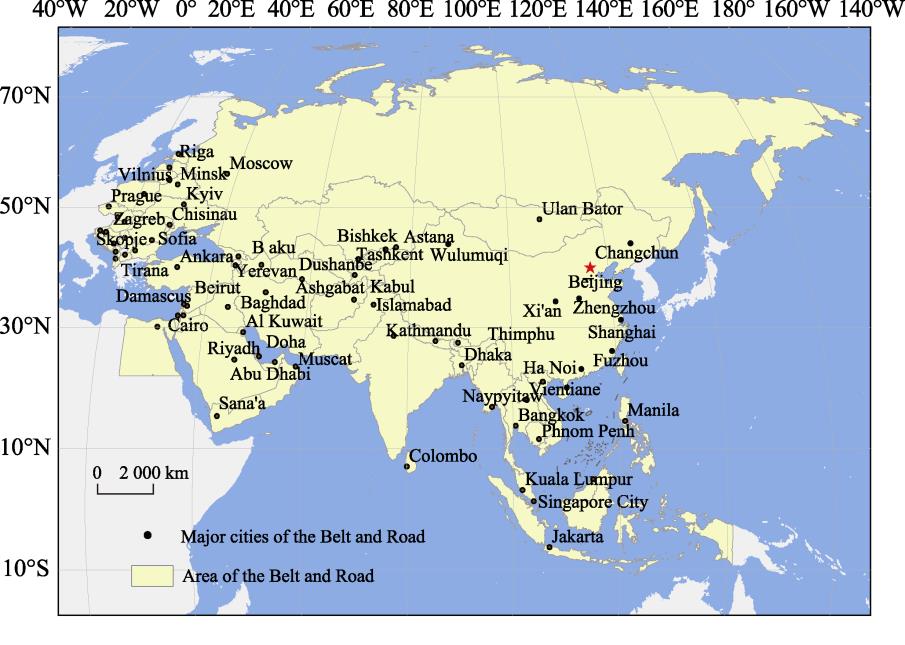
Fig. 1. Location of the Belt and Road region
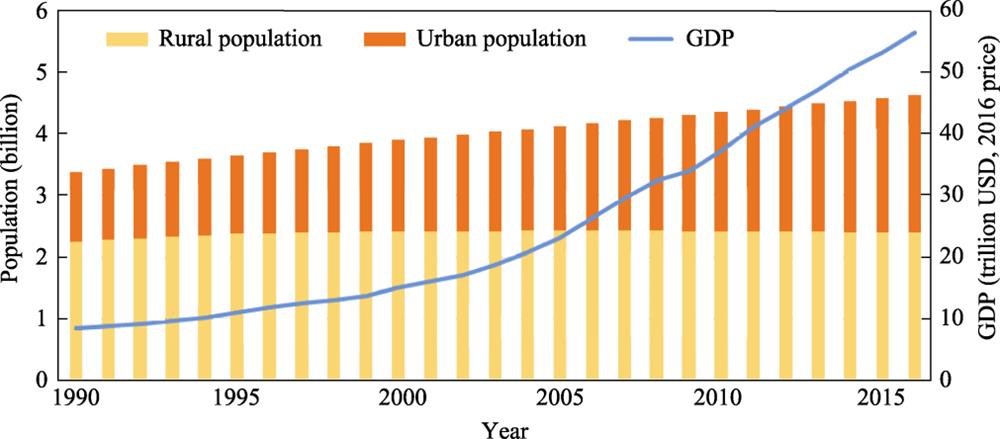
Fig. 2. Changes in the population, urbanization level and GDP in the Belt and Road region for 1990-2016
Fig. 3. Distribution of the population (a), urbanization (b) and economy (c) in the Belt and Road countries in 2016
Fig. 4. Projections of the population (a), urbanization (b) and economy (c) in the Belt and Road region for 2020-2050
Fig. 5. Changes in the population, urbanization and GDP throughout the Belt and Road region in 2050 compared with 2016
Fig. 6. Comparisons of the annual population (a), urbanization (b) and GDP (c) in the Belt and Road region in 2050 with the 2016 levels
| SSP1 | SSP2 | SSP3 | SSP4 | SSP5 |
|---|
| Fertility | Low | Medium | High | Low | Low | | Mortality | Low | Medium | High | Medium | Low | | Migration | Medium | Medium | Low | Medium | High | | Education | High (FT) | Medium (GET) | Low (CER) | Low (CER) | High (FT) | | TFP growth | Medium | Medium | Low | Medium | High |
|
Table 1. Assumptions of the key influencing factors on the population and economy for the SSPs
| Year | | 2010 | 2020 | 2030 | 2040 | 2050 |
|---|
| Urban | Low | 1.19 | 1.24 | 1.29 | 1.25 | 1.21 | | Medium | 1.19 | 1.61 | 1.61 | 1.61 | 1.61 | | High | 1.19 | 1.56 | 1.93 | 1.97 | 2.01 | | Rural | Low | 1.19 | 1.35 | 1.51 | 1.46 | 1.42 | | Medium | 1.64 | 1.89 | 1.89 | 1.89 | 1.89 | | High | 1.19 | 1.61 | 1.61 | 1.61 | 1.61 | | Total | Low | 1.19 | 1.28 | 1.37 | 1.31 | 1.25 | | Medium | 1.45 | 1.72 | 1.71 | 1.68 | 1.66 | | High | 1.19 | 1.61 | 1.61 | 1.61 | 1.61 |
|
Table 2. Assumptions of total fertility rate for the urban and rural populations in China
| Countries(Rate of changes) | Population | Urbanization | GDP |
|---|
| Top three | Last three | Top three | Last three | Top three | Last three |
|---|
| SSP1 | Bahrain (108%) | Moldova (-40%) | Nepal (195%) | Israel (1%) | TLS (1594%) | Azerbaijan (26%) | | Afghanistan (75%) | Lebanon (-22%) | Cambodia (167%) | Kuwait (2%) | Syria (1505%) | Singapore (62%) | | ARE (72%) | Tajikistan (-19) | Sri Lanka (160%) | Lebanon (5%) | Bhutan (949%) | Kazakhstan (67%) | | SSP2 | Bahrain (125%) | Moldova (-39%) | Nepal (103%) | Israel (1%) | Syria (1235%) | Azerbaijan (7%) | | Afghanistan (117%) | Lebanon (-17%) | Cambodia (87%) | Kuwait (2%) | TLS (977%) | Myanmar (40%) | | Yemen (105%) | Belarus (-14) | Tajikistan (82%) | Lebanon (5%) | Bhutan (845%) | Kazakhstan (47%) | | SSP3 | Afghanistan (164%) | Moldova (-24%) | Nepal (46%) | Thailand (-21%) | Syria (1235%) | Azerbaijan (-11%) | | Yemen (152%) | Hungary (-22%) | BIH (41%) | Indonesia (-9%) | TLS (977%) | Myanmar (3%) | | TLS (143%) | Poland (-18%) | Cambodia (33%) | Mongolia (-7%) | Bhutan (845%) | Romania (18%) | | SSP4 | Afghanistan (153%) | Moldova (-42%) | Nepal (195%) | Israel (1%) | Syria (857%) | Myanmar (-28%) | | Yemen (149%) | Lebanon (-23%) | Cambodia (167%) | Kuwait (2%) | Bhutan (670%) | Azerbaijan (7%) | | Iraq (127%) | Belarus (-20%) | Sri Lanka (160%) | Lebanon (5%) | TLS (442%) | Romania (47%) | | SSP5 | Bahrain (144%) | Moldova (-50%) | Nepal (195%) | Israel (1%) | Syria (1888%) | Azerbaijan (63%) | | Israel (103%) | Tajikistan (-38%) | Cambodia (167%) | Kuwait (2%) | TLS (1621%) | Singapore (99%) | | ARE (101%) | Georgia (-27%) | Sri Lanka (160%) | Lebanon (5%) | Bhutan (1265%) | Lithuania (102%) |
|
Table 3. Three countries with the fastest and slowest growth in 2050 with relative to 2016